
IFDP Notes
 Print
PrintApril 11, 2016
"Low-for-long" interest rates and net interest margins of banks in Advanced Foreign Economies
Stijn Claessens (FRB), Nicholas Coleman (FRB), and Michael Donnelly (FRB)1
1. Introduction
Since the global financial crisis (GFC), interest rates in many advanced economies have been low and in many cases are expected to remain low for some time. Low interest rates help economies recover and can enhance banks' balance sheets and performance by supporting asset prices and reducing non-performing loans. But persistently low interest rates may also erode the profitability of banks as low rates are typically associated with lower net interest margins -- NIMs, typically measured as net interest income divided by interest earning assets. While overall advanced economies' bank profitability, measured by return on assets, has recovered from the worst of the GFC, it remains low and many advanced economies' banks are facing profitability challenges, related to low net interest margins as well as weak loan and non-interest income growth. And while NIMs across many advanced economy banks have been trending down on a longer-term basis, they have fallen more sharply since the GFC, in part, as appears so, on account of lower interest rates.
But how strong is the link between interest rates and NIMs, and is this relationship different in low interest rate environments? This note explores the empirical evidence between changes in interest rates and NIMs for different interest rate environments to discover the potential adverse effects of a low interest rate on bank NIMs. Using cross-country evidence can be insightful to assess a situation that is not so common in any individual country. Overall, the new empirical analysis shows that low rates are contributing to weaker NIMs and identifies an adverse effect that is materially larger when interest rates are low. It suggests that these effects can be material for banks in some key advanced foreign economies (AFEs).2
2. Literature on the effects of low interest rates on banks' NIMs
In many ways, banks, of course, may benefit from low interest rates, directly (e.g., through valuation gains on securities they hold) and indirectly (e.g., as non-performing loans will be lower as borrowers' debt service will be less burdensome). The focus here is on the narrower question of the effects of low interest rates on banks' NIMs. Analytics and existing empirical findings suggest that, controlling for other factors, banks' NIMs are lower when interest rates are low. We briefly review the reasoning and this literature.
Low short-term interest rates can depress bank margins because for many types of deposits, banks are reluctant to lower deposit rates, especially below zero (while there is anecdotal evidence that some banks are passing negative rates onto corporate customers in select cases, banks have been reluctant to pass on negative policy rates to retail depositors). As a result, when interest rates decline, bank margins compress, since banks must pass on lower rates on assets based on contractual repricing terms (e.g., floating rate loans) and have an incentive to do so to those borrowers that have other financing choices (e.g., from corporate bond markets). Moreover, low long-term interest rates can depress NIMs by flattening the yield curve. Because banks transform short-dated liabilities into longer-dated assets, their NIMs are negatively affected by shallower yield curves. Modeling (see Appendix I) further suggests that, ceteris paribus, the effects are larger in a low-yield environment since, besides the reluctance to lower deposit rates below zero, spreads on loans over deposit rates can be expected to be lower.
Cross-country empirical evidence and studies for various individual countries support the negative effects of lower interest rates on net interest margins, with effects often found to be greater in low interest rate environments. Analyzing a sample of 108 relatively large international banks, many from Europe and Japan, and 16 from the United States, Borio, Gambacorta and Hofmann (2015) document the non-linear relationships between the interest rate level and the slope of the yield curve on one hand and banks' NIMs and profitability, i.e., return on assets, on the other hand. They confirm that effects on NIMs are stronger at lower levels of interest rates (50 basis points for a 1 percentage point change at a rate of 1% vs. 20 basis points at a rate of 6%) and when there is an unusually flat term structure.
Evidence for the United States (e.g., Genay and Podjasek, 2014) also finds that banks are adversely affected by interest rates that are low for an extended period of time through a narrower NIM. They also note, however, that the direct effects of low rates are small relative to the economic benefits, including through better support for asset quality.3 Analysis for Germany (Busch and Memmel, 2015) suggests that in normal interest rate environments the long-run effect of a 100 basis points change in the interest rate on NIMs is very small, close to 7 basis points. In the recent, low-interest rate environment, however, they find that banks' interest margins for retail deposits, especially for term deposits, have declined by up to 97 basis points. The Bundesbank's Financial Stability Review of September 2015, analyzing 1,500 banks, also finds that a persistently low interest rate is one of the main risk factors weighting on German banks' profitability. For Japan, analysis (Deutsche Bank, 2013) shows that the low-for-long interest rate there also contributed to the declining NIMs of Japanese banks. Over time, however, portfolio shifts towards investment in securities, a greater reliance on non-interest income, and a holding down of costs allowed Japanese banks' profitability to remain mostly positive. Evidence for other countries on the effects of (low) interest rates on NIMs and profitability is scarcer.
The literature has found that the direct effects of changes in interest rates on margins and profitability can vary by bank size. Analysis for U.S. banks suggests that in general rate changes have greater, short-run impact on small banks as they depend more on traditional intermediation of retail deposits, which are stickier in price, into loans, many of which are priced off floating rates. Large banks typically have greater ability to manage interest rate risks through the use of derivatives and the repricing of managed liabilities, and are thus less affected by low interest rates. Also, large banks, with their greater international reach, have more potential to increase lending abroad, and their more diversified business models can allow them to more easily expand non-interest income to offset lower margins. Since the GFC, however, large U.S. banks have seen their funding cost advantage erode and NIMs decline more than small banks, but this seems at least in part due to recent regulatory changes (Covas, Rezende and Voitech, 2015).
Capital markets seem to acknowledge some of the effects of low interest rate on banks' profitability. In their analysis, English, Van den Heuvel, and Zakrajsek (2012) find that while equity prices of U.S. banks fall following unanticipated increases in interest rates or a steepening of the yield curve, a large maturity gap weakens this effect, suggesting that on account of their maturity transformation function, banks gain relatively from a higher interest rate or a steeper yield curve. This shows that, conversely, a lower interest rate or a shallower yield curve hurts those banks that are more engaged in maturity transformation, at least relative to other banks.
3. New analysis
New cross-country analysis we conduct confirms and expands on these findings. We first describe below the data and sample of commercial banks we use, as well as some raw statistics. We then provide the methodology and empirical findings.
Data sample and raw comparisons. To investigate the impact of the short-term interest rate on banks' NIMs, a database was assembled with (yearly averages of) three-month and ten-year sovereign yields from Bloomberg and of bank balance sheet and income statement data from Bankscope at an annual frequency.4 The final sample contains 3,418 banks from 47 countries for 2005-2013.5 Unconsolidated data are used, where available, to isolate the effect of a country's interest rate on only the bank's operations in that country. Observations are only trimmed in cases where the data is logically inconsistent, for example when assets are below zero or when deposits are greater than liabilities. We additionally ignore observations where the NIM for a bank changes by more than ten percentage points from one year to the next.
To explore differential impacts, countries were classified each year as being in a low- or high-rate environment based on whether the interest rate on their 3-month sovereign bond was below or above 1.25 percent (other cutoffs were also tested and yielded similar results). Figure 1 shows the sample of countries covered and the range and median of the short-term yields in each. The variations in rates are large for many countries, and many countries are both in the high- and low-yield environment for some time (the median provides a sense of how long each country has been in each environment). Appendix Figure 1 shows the exact classification of countries in the low- and high-yield environments for 2005, 2009, and 2013. It is notable that many more countries, especially advanced economies, are in the low-yield environment post-GFC: 19 in 2009 vs. only two in 2005. These shifts help to estimate the differential impact of low interest rates on banks' NIM and profitability, and whether effects are greater the longer banks are in a low interest rate environment.
Figure 2 compares the broad composition of bank balance sheets in low- and high-rate environments. Overall, there do not appear to be major shifts in asset compositions or liability structures in low- versus high-rate environments that could be expected to drive differences in how net interest margins respond to interest rates. Banks have roughly the same loan-to-deposit and loan-to-asset ratios in the high-rate environment (the orange bars) as in the low-rate environment (the blue bars) at about 125 and 60 percent, respectively. Banks in the high-rate environment have slightly higher leverage ratios, while deposits-to-total liabilities and securities-over-assets are slightly higher in the low-rate environment, possibly because low rates are associated with lower economic and loan growth, less non-deposit borrowing, greater investment in safer securities, and lower profits and capital.
| Figure 1: Range of 3-Month Sovereign Yield by Country (2005-2013) |
|---|
 |
Note: The figure shows the range of the three-month sovereign yield for each country from 2005-2013. Values used are yearly averages of the implied three-month rate published daily by Bloomberg.
Sources: Bloomberg, staff calculations.
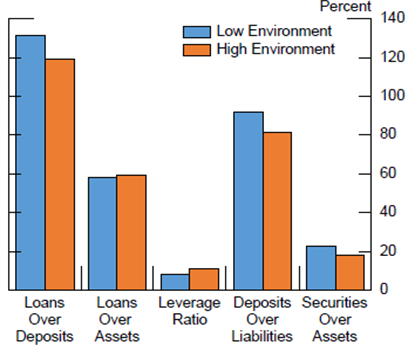
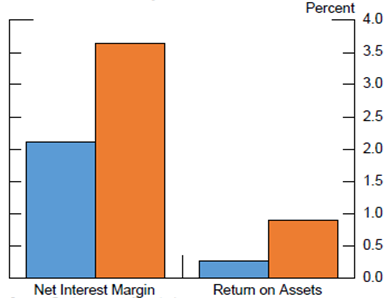
Figure 3 shows that average NIMs are higher in the high-rate environment (the orange bars) than in the low-rate environment (the blue bars). Profitability, measured by return on assets, is higher too in the high-rate environment, likely reflecting both higher NIMs and concurrent better overall economic and financial environments.
Methodology and findings. To isolate the direct effects of changes in interest rates on NIMs in low- and high-rate environments, we perform an econometric analysis that holds other factors constant, including any correlations that interest rates might have with economic growth, demand for loans, or supply of deposits. We regress a bank's NIM for each year on the average level of the three-month sovereign rate in that year, a common proxy for banks' marginal funding costs, controlling for the bank's own lagged NIM, other time-varying bank characteristics, and a bank fixed effect, as well as GDP growth and the spread between the three-month and ten-year sovereign rates. The sample is then split by banks in low- and high-interest rate environments Specifically, the regressions use the following empirical specification:
$$$$y_{ijt}=\beta _{0}+\beta _{1}y_{ijt-1}+\theta _{1}3MonthRate_{jt}+\theta_{2}RateSpread_{jt}+\theta _{3}Low_{jt}+y_{1}GDPgrowth_{jt}+y_{2}X_{it}+\delta _{i}+\varepsilon _{ijt}$$$$
Where:
- $$y_{ijt}$$ is the NIM of bank $$i$$ in country $$j$$ in year $$t$$,
- 3Month$$Rate_{jt}$$ is the yearly average 3-month government bond yield,
- $$Rat{eSpread}_{jt}$$ is the spread between the 10-year government bond yield and 3-month government bond yield,
- $$Low_{jt}$$ is a dummy equal to 1 if the country is in a "low rate environment" which we define to be under 1.25% on the 3-month rate.
- $${GDPgrowth_{jt}}_{it}$$ controls for the country's economic growth6
- $$X_{it}$$ are bank level controls, specifically total securities over total assets, deposits over total liabilities, and total equity capital over total assets
- $$\delta _{i}$$ is a bank fixed effect and $$\varepsilon_{ijt }$$ is an error term
Because the regressions control for each bank's average NIM and its country's general economic conditions, results can be interpreted as the direct effects of a change in the short-term interest rate on banks' NIMs.7
The baseline regression results show that a decrease in the short-term interest rate lowers NIMs in both a low- and high-rate rate environment, with effects symmetric for an interest rate increase. But other things equal, effects are statistically significantly larger in a low-rate environment. Figure 4 summarizes the regression results. For a representative bank, a one percentage-point decrease in the short-term rate is associated with a 9 basis-point decrease in NIM in the high-rate environment (the orange bars) versus a 17 basis-point decrease in NIM in the low-rate environment (the blue bars). Similar magnitudes and comparisons are found when using overall samples composed of different banks and countries.8 Even so, when conducting the analysis for individual countries, there is significant heterogeneity in effects. For example, a one percentage point decline in the 3-month sovereign rate leads to a 6 basis-point decline in NIMs in Austria, compared to a 27 basis-point decrease in Italy.
| Figure 4: Effect of 1 p.p. Decrease in 3-Month Yield |
|---|
 |
Note. The figure above reflects average differences among banks and estimated effects of a decrease in the three-month sovereign yield, respectively, for banks in a "low" rate environment and a "high" rate environment.
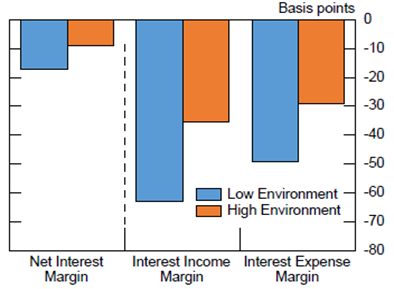
We next run regressions analyzing separately the effects of changes in interest rate on changes in interest expenses and on changes in interest income. The greater effects on NIMs in the low-rate environment is largely driven by the greater pass-through of low interest rates on interest income than on interest expense. Specifically, a one percentage point decrease in the short-term rate is associated with a 63 basis-point decrease in the ratio of interest income to earning assets in the low-rate environment and only a 35 basis-point decrease in the high-rate environment, a 28 basis-point difference. The equivalent difference is about 20 basis points for the ratio of interest expense to liabilities. In other words, at low rates, banks have greater difficulty reducing their funding rates, while they have to pass the lower rates to a greater degree on to their borrowers, likely due to greater competition, including from non-bank lenders, and lower demand for loans -- as economic activity is less in times of low interest rates, leading NIMs to decline more.
We also analyzed if effects differ by banks' maturity mismatches. We defined a bank as having a "long" maturity (asset and liabilities separately) if it has an average balance sheet maturity over the sample period greater than the median maturity for banks in its country and as having a "short" maturity otherwise. We then analyze using the same methodology, for a smaller sample of banks, the impact of a one percentage point increase in the short-term interest rate on the same period interest income ratio (the interest expense ratio) differentiating by the maturity of the banks' assets (liabilities).9 Consistent with a priori expectations, the analysis shows that the highest contemporaneous pass-through from a decrease in interest rates to interest income is for banks with short asset maturities in the low interest rate environment. Banks with longer maturity assets see statistically significantly less pass-through, 64 basis points vs. 92 basis points (Figure 5). Similarly, although somewhat lower, the pass-through to interest expenses is significantly higher in the low interest rate environment than in the high environment for banks with short liability maturities.
| Figure 5: Effect of 1 p.p. Decrease in 3-Month Sovereign Yield, by Duration |
|---|
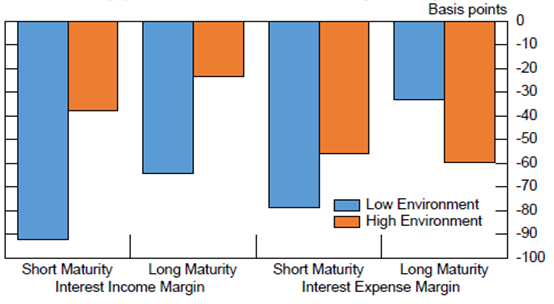 |
Note. The figure shows the estimated effect of a 1 percentage point decrease in the three-month sovereign yield on a bank's net interest income margin and interest expense margin adjusted for interest rate environment and a bank's balance sheet maturity. A bank is classified as having a "long" maturity if it has an average balance sheet maturity over the sample period greater than the median maturity for banks in its country, and is classified as having a "short" maturity otherwise. Assets are used to determine maturity for the interest income margin, while liabilities are used for the interest expense margin. This figure only includes those countries with over 100 banks reporting maturity information.
Sources: Bankscope, staff calculations.
4. Overall Effects for AFE Banking Systems and Conclusions
The cross-country analysis conducted suggests that low interest rates negatively affect many AFE banks' NIMs, which is consistent with several studies on individual countries. We can summarize our results by considering the situations of banking systems in four key AFEs, the euro area, Canada, Japan, and the UK, and comparing these to U.S. banks (Table 1). Wide differences remain between the relatively strong profitability reported by Canadian, U.K. and U.S. banks, and the weaker profitability reported by euro area and Japanese banks.10 These differences in profitability partially reflect differences in NIMs, which are typically lower in the AFEs than in the United States, as many AFE banks have higher shares of typically lower-yielding mortgages and sovereign debt. And the lower NIMs in the later period in turn likely reflect the large declines in sovereign yields in these economies.
| Table 1: Advanced Economy Bank Profitability |
|---|
| Median Return on Assets - 2007 | Median Return on Assets - 2013 | Median Net Interest Margin - 2007 | Median Net Interest Margin - 2013 | 3-Month Sovereign Yield - 2007 | 3-Month Sovereign Yield - 2014 | |
|---|---|---|---|---|---|---|
| Euro Area | 33 | 24 | 253 | 235 | 398 | 14 |
| Canada | 54 | 56 | 229 | 214 | 425 | 92 |
| Japan | 23 | 18 | 181 | 139 | 45 | 3 |
| United Kingdom | 84 | 66 | 195 | 128 | 535 | 31 |
| Advanced Foreign Economies | 30 | 22 | 236 | 213 | 277 | 10 |
| United States | 96 | 81 | 391 | 382 | 450 | 5 |
Sources: Bankscope, staff analysis.
Using our regression results, our estimates suggest that the NIMs in these four banking systems declined by roughly 26 basis points due to the actual decreases in interest rates between 2007 and 2013 (Table 2), or roughly 82 percent of the median decline in NIMs observed over this period, which was 32 basis points. These impacts vary by interest rate declines and are between 3 basis points for Japan and 46 basis points for the U.K. If already in a low-rate environment, e.g., Japan and the euro area today, estimates suggest a NIM contraction of 17 basis points for every 1 percentage point further decline in the 3 month rate.
| Table 2: Predicted and Observed Changes in Net Interest Margins from 2007-2013 |
|---|
| Change in 3-Month Rate (b.p.) | Predicted Change in Net Interest Margin (b.p.) | Observed Change in Net Interest Margin (b.p.) | Percent of Net Interest Margin Change Explained | |
|---|---|---|---|---|
| Euro Area | -373 | -33 | -34 | 97% |
| Canada | -329 | -29 | -39 | 74% |
| Japan | -38 | -3 | -39 | 8% |
| United Kingdom | -526 | -46 | -28 | 168% |
| Advanced Foreign Economies | -297 | -26 | -32 | 82% |
Note. Change in the 3-month rate is the change in the 3-month sovereign yield from 2007-2013. We predict a change of 8.8 basis points in a bank's net interest margin for every 100 basis point change in the sovereign's 3-month yield. Observed change is shown as the median change in net interest margins for banks in that sample.
There are caveats to this analysis, related to appropriate lags and potential other non-linearities between changes in interest rates and NIMs. First, there may be important non-linearities in the impact of interest rate changes in a low-yield environment compared to the high-yield environment not captured with our specification. Second, while we included one lag for the dependent variable, which was statistically significant with a coefficient of about 0.5, there are likely additional lags in the relationship between changes in interest rates and NIMs that are not captured (for example, as long-term loans are repriced over time at higher or lower interest rates, affecting NIMs many years after an interest rate change). Analysis using German banks, Memmel (2011), suggests for example that the full effects of repricing take place over a period of 1-1.5 years. This is consistent with the pattern in NIMs which seems to progressively decline as the banks are longer in a low interest rate environment (Figure 6). Third, the analysis only looks at the effect on current margins assuming no shifts in behavior, while changes in interest rates and the full effect on banks' NIMs (and profitability, capital adequacy and franchise values over time) may vary as banks adjust their funding structures, lending and investment portfolios and their non-interest activities. These adjustments have been found to be important in the case of Japan (see Deutsche Bank, 2013). Lastly, there have been many regulatory changes since the GFC that could also have affected banks' NIMs, as has been found for large U.S. banks (see Covas, Rezende and Voitech, 2015).
| Figure 6: Change in NIM in a Low Rate Environment |
|---|
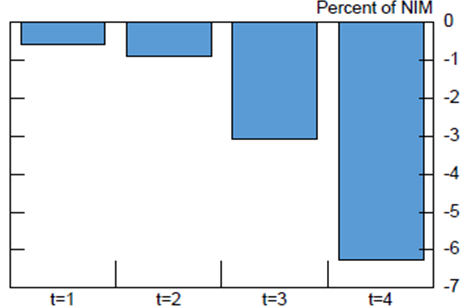 |
Note. The figure above reflects the average change in net interest margins between the year prior to entering the low interest rate environment and each successive year after entering a low rate environment, t=1 through t=4.
Sources: Bankscope, staff analysis.
While there are these and other caveats to the analysis, nevertheless, the findings suggest strongly that when NIMs are low -- due to persistently low rates or otherwise -- the important issue is how banks can adjust their activities and cost structures so as to offset low rates' adverse effects on profitability and capital. Similar regressions of the effects of low interest rates on bank ROA show no consistent results, however, likely as the direct effects of changes in interest rates on NIMs are confounded by the volatility in other sources of income and costs, including gains on security holdings and provisioning, especially since the GFC, and possibly because banks are taking actions to offset the effects on ROAs of changes in NIMs due to interest rate declines (as well as in light of recent regulatory changes, heightened market pressures, and changed opportunities). Although institutions are making adjustments, such efforts take time, as Japan's experience shows, with limited immediate payoffs when facing weak cyclical conditions and deleveraging pressures. As such, banking systems in many low interest rate countries will face challenges. Until lost income can be offset through other actions, lower profitability will reduce financial institutions' ability to build and attract capital, increasing their vulnerability to shocks and declines in market confidence and undermining their ability to support the real economy.
Appendix I: Effects of low interest rates: Analytics and Modelling
Analytics
At the individual institution level, exposures to fluctuations in interest rates can vary significantly. Relevant factors determining this variation include the amount held of fixed income assets (e.g., (government) bonds), the maturity and repricing nature of liabilities and assets, and the related degree of maturity mismatches. The degree to which fluctuations in short-term interest rates impact banks' NIMs and profitability (and bank's equity market valuation) depends importantly on the maturity and repricing structure of banks' assets and liabilities, accounting for the use of hedging tools, and the degree to which banks can and do alter their balance sheets and activities in response to the changes in interest rates. Banks with shorter-term and frequently repriced assets (or liabilities) will experience a larger decrease in interest income (or interest expense) as the short-term interest rate falls compared to banks with longer-term and infrequently repriced assets (or liabilities). In addition to asset-liability mismatches, the impact of interest rate changes on banks' NIMs depends on banks' relative ability to pass on changes in the interest rate to depositors and borrowers.
Typically though, as they transform short-dated liabilities in longer-dated assets, banks are negatively affected by shallower yield curves which act to lower their NIMs and overall profitability. The NIM is effectively the mark-up that banks charge on their liabilities to fund their assets and reflects the liquidity transformation that banks perform, borrowing liquid deposits and funding themselves more generally with short-term liabilities and making illiquid loans and investing in longer-dated securities. Ceteris paribus, bank margins increase as the steepness of the yield curve increases as then the difference between bank (short-term) borrowing and (long-term) lending rates increases. Controlling for the steepness of the spread, the level of the short-term interest rate may be important as well for bank margins (see modelling). Especially when interest rates are close to zero, the de-facto lower bound for at least retail deposits, banks may see their margins compress as they have greater difficulty adjusting deposit rates down, while they still have to pass on the lower rate to their borrowers.
Effects of changes in interest rates on NIMs and profitability may vary by bank size. Large banks may be able to more effectively hedge interest rate risk so a change in the short-term interest rate could have a smaller short-run effect on changes in interest income than for small banks. At the same time, borrowers from large banks have greater opportunities to switch banks, forcing large banks to pass on low interest rate to a greater degree to their borrowers. Smaller banks may rely more on retail deposits, so a low interest rate could have a relatively less beneficial impact on their expenses.
While lower interest rates need not adversely affect banks, and the overall literature finds ambiguous results, pass-through of low interest rate can be expected to be even less to deposit rates at lower rates/ZLB. As a consequence, NIMs can decline. Institutions, notably those with more long-dated and fixed-price liabilities (i.e., insurance and pension funds), will typically see their net worth fall. Different than banks, contractual savings institutions have some time and scope though to adjust premiums and benefits. Distributional/adverse effects arise when some types of banks and other institutions (small, large, other) are more affected.
The impact of interest rate changes on overall bank profitability and capital adequacy positions is more ambiguous as it will vary on the state of the economy. For example, if low interest rate environments tend to happen in a period where demand for loans is low as well, or where banks are (capital or otherwise) constrained and otherwise deleveraging after a financial crisis, this may (further) suppress NIMs and overall profitability, especially when banks are also facing balance sheets problems and deleveraging, say in the wake of a crisis. The net impact on asset quality and non-performing loans, which feed into profitability, is more ambiguous as low rates make on one hand loan payments easier for borrowers but also may be associated with poorer quality borrowers getting loans. More generally, the state of the economy will importantly both influence the scope for profitable banking business and the level of interest rates. Related, effects of decreases in interest rates on the equity valuation of banks are often found to be positive, re?ecting the net effect of a combination of capital gains on longer-term assets and lower discount rates on future earnings, and expectations of higher future pro?ts, the latter as changes in interest rates (in part due to monetary policy actions) relate to expected economic growth and thereby loan demand and asset quality. When interest rates adversely affect banks' profitability and valuations, they can also impede banks' ability to raise new capital.
Besides the direct effects on banks' NIMs and profitability, banks may also alter their activities in responses to changes in interest rates. If short-term interest rates or spreads are not high enough to allow banks to reach their profit goals, banks may switch out of lending to opportunities to earn non-interest income, such as fee income from underwriting or asset management. This ability to engage in other activities will vary across countries depending on financial system structures, e.g., bank vs. market-based, and regulations. It may also vary across banks in ways related to bank size. Large banks are for example more likely to be able to engage in non-interest earning activities, such as investment banking or wealth management.
Theoretical Interpretation of NIM
Empirically, we find that the NIMs are higher when interest rates are higher, but NIMs are more sensitive to interest rates fluctuations when the level of interest rates is lower. This empirical result is consistent with a theoretical breakdown of the components of NIM.
First, consider the definition of the NIM:
$$$$Net\ Interest\ Margin=\frac{Interest\ Income-Interest\ Expense}{Average\ Earning\ Assets}$$$$
By definition, interest income can be written as the product of the bank's earning assets and the interest rate on lending, r, while interest expense can be written as the product of the bank's interest bearing liabilities and the interest rate on borrowing, r'.
$$$$Net\ Interest\ Margin=\frac{Avg.\ Earing\ Assets*r-Int.\ Bearing\ Liab.\ *r'}{Avg.\ Earning\ Assets}$$$$
We can write interest bearing liabilities as a ratio of average earning assets, so
$$$$Int.\ Bearing\ Liab.=\lambda *Avg.\ Earnign\ Assets, where\ \lambda =\frac{Int.\ Bearing\ Liabilities}{Avg.\ Earning\ Assets}$$$$
Likewise, we can define the ratio of the interest rate on borrowing and lending as: $$r^{\prime }=\phi \ast r, where\ \phi =\frac{borrowing rate}{lending rate}$$
Therefore,
$$$$Net\ Interest\ Margin=\frac{Avg.\ Earning\ Assets*r-Avg.\ Earning\ Assets*\ \lambda *\ \phi *r}{Average\ Earning\ Assets}$$$$
Taken together this becomes $$\mathrm{NIM=r(1-\ }\mathrm{\lambda }\mathrm{\phi }\mathrm{)}$$. In order to model how NIMs change as the interest rate level changes, it is easiest to assume a static balance sheet, i.e. that $$\lambda$$ is a fixed constant which yields three cases to consider how the borrowing rate relates to the lending rate.
Case 1: $$\phi $$ is static (e.g., the deposit rate is an unchanging proportion of the loan rate).
If this were the case then the rate of change of NIM in relation to r would be $$\frac{dNIM}{dr}=1-\ \lambda \phi $$
Because $$\lambda$$ and $$\phi $$ are both constants, the change in NIM would also be constant as r changes.
Case 2: $$\phi =\frac{r-a}{r}$$ (e.g., the deposit rate is a fixed spread below the loan rate).
If this were the case then we can substitute in $$\frac{r-a}{r}$$ for $$\phi $$ and we find that
$$$$NIM=\ r\left(1-\ \lambda \phi \right)=r\left[1-\ \lambda \left(\frac{r-a}{r}\right)\right]=r\left(1-\ \lambda \right) \ \lambda a$$$$
Then the rate of change of NIM in relation to r would be $$\frac{dNIM}{dr}=1-\ \lambda $$
Because we assume $$\lambda$$ to be a constant, the change in NIM would also be constant as r changes.
Case 3: $$\phi =r^{\alpha -1}$$, for $$\alpha >1$$ and $$r>0$$ and (e.g. the deposit rate grows as a proportion of the loan rate).
If this were the case then we can substitute in $$r^{\alpha -1}$$ for $$\phi $$ and we find that
$$$$NIM=\ r\left(1-\ \lambda \phi \right)=r\left(1-\lambda r^{\alpha -1}\right)=r-\lambda r^{\alpha }$$$$
Then the rate of change of NIM in relation to r would be $$\frac{dNIM}{dr}=1-\ \lambda \alpha r^{\alpha -1}$$
Because we assume $$\lambda $$ and $$\alpha $$ to be constant, the change in NIM would shrink as r increases, and would be greater when r is lower. In other words, the NIM would be more sensitive to changes in the interest rate when the interest rate is closer to zero.
Conclusion: Given our empirical results, we reject cases 1 and 2 as our tests are consistent with case 3. This result implies that there is an important non-linearity in the mapping of the short-term interest rate to the lending and borrowing interest rates.
| Appendix Figure 1: Country Assignments by "Low" vs "High" 3-Month Sovereign Rate |
|---|
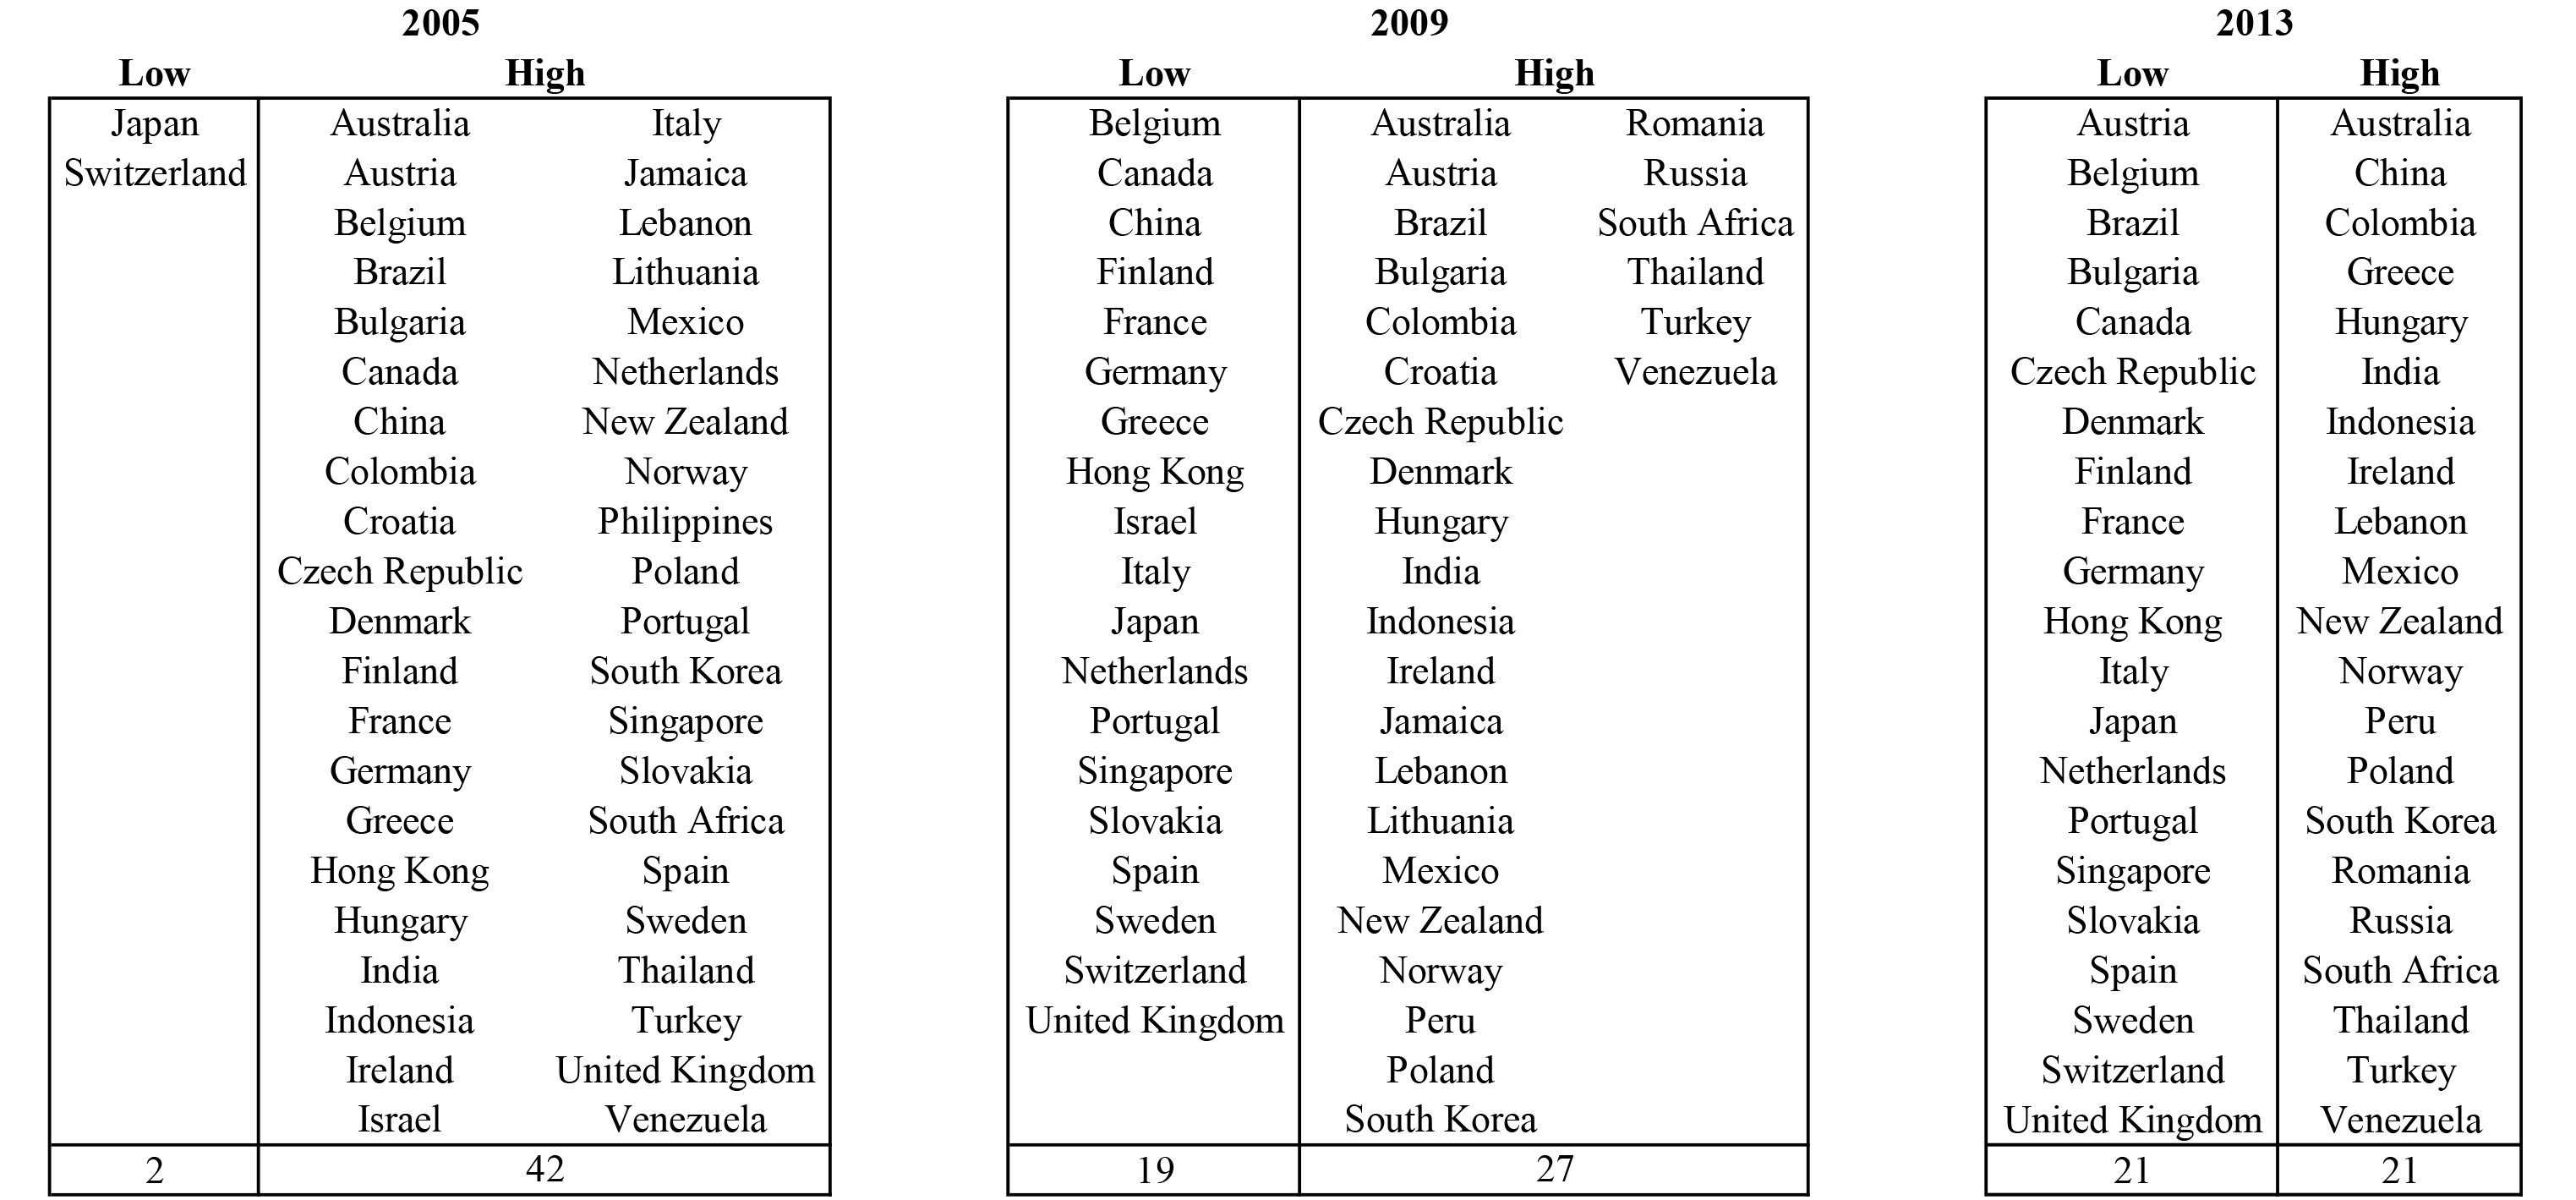 |
Note: The figure shows how countries were classified for three years in the sample from 2005-2013. A country was classified as being in the "low" rate environment if its average three-month implied sovereign yield for that year was less than or equal to 1.25 percent and was classified as being in a "high" rate environment otherwise.
Sources: Bloomberg, staff calculations.
References
Adrian, Tobias, and Nellie Liang, 2014, "Monetary Policy, Financial Conditions, and Financial Stability," Federal Reserve Bank of New York Staff Reports, no. 690 September.
Borio, Claudio E. V. and Gambacorta, Leonardo and Hofmann, Boris, 2015, "The Influence of Monetary Policy on Bank Profitability," (October), BIS Working Paper No. 514.
Busch, Ramona and Christoph Memmel, 2015, "Banks' net interest margin and the level of interest rates," Discussion Papers 16/2015, Deutsche Bundesbank, Research Centre.
Bundesbank, 2015, "Financial Stability Review," September.
Covas, Francisco B. Marcelo Rezende, and Cindy M. Vojtech, 2015, "Why Are Net Interest Margins of Large Banks So Compressed?", FEDS Notes, October.
Dell'Ariccia, Giovanni, and Robert Marquez, 2013, "Interest Rates and the Bank Risk taking Channel," Annual Review of Financial Economics 5(1), 123--141.
Deutsche Bank, 2013, "Ultra-low interest rate: How Japanese banks have coped," June.
English, William B., Skander J. Van den Heuvel, and Egon Zakrajsek, 2012, "Interest Rate Risk and Bank Equity Valuations," FEDS Working Paper 2012-26.
ECB 2015, "Financial Stability Review," May, Frankfurt.
Genay, Hesna and Rich Podjasek, 2014, "What is the impact of a low interest rate environment on bank profitability?," Chicago Fed Letter, 324, July.
Memmel, Christoph, 2011, "Banks' exposure to interest rate risk, their earnings from term transformation, and the dynamics of the term structure," Journal of Banking and Finance, 35, 282--289.
1. We would like to thank William English and other Federal Reserve System colleagues for extensive comments. The views expressed in this note are those of the authors and should not be attributed to the Board of Governors of Federal Reserve System. Return to text
2. An overall assessment of how low interest rates may affect banks is beyond the scope of this note. For example, low interest rates can lead to valuation gains on securities, affect the quality of loans and related changes in loan-loss provisioning, etc. We also do not review whether low interest rates may lead to unhealthy reach for yield by banks (see Adrian and Liang (2014) and Dell'Ariccia and Marquez (2014) for (literature) reviews of the links between risk taking and interest rates). Return to text
3. Similarly, a study of 98 EU banks (ECB 2015) finds that macroeconomic factors, and not interest rates, have had the most importance for bank health since the global financial crisis. Return to text
4. Implied yields on currently outstanding three-month and ten-year bonds are used since not every country has at all points in time bonds maturing exactly three months or ten years later. These daily rates are then averaged over each year. Return to text
5. A limitation of Bankscope is that it focuses on relatively large banks within countries so results may be biased. That said, many smaller (and unlisted) banks are still included. Return to text
6. We also included in regressions commercial real estate prices, house prices, unemployment rates, and stock market performances. Because these data are not available for many countries and longer periods, it decreased coverage to such a degree that we preferred to use a more parsimonious specification. For those countries where we had these data, however, regression results were robust. Return to text
7. We additionally studied the impact of changes in the interest rate on banks' return on assets and of changes in the slope of the yield curve on NIMs and on return on assets. Here less consistent patterns emerged, as was also the case for Genay and Podjasek (2014). We suspect that over this period, which includes the global financial crisis, non-interest income and expense items, such as provisioning for non-performing loans, and large valuation gains and losses led to (even) greater volatility in banks' profitability, obscuring the direct effects of changes in interest rates. Return to text
8. Results hold for unbalanced or balanced samples, samples with or without U.S. banks, and trimming observations differently. Return to text
9. The sample was split into "long" versus "short" maturity of bank by first taking the average maturity for each bank over the sample period and then calculating the median average duration by country. Banks above the median average duration within each country were then classified to have a "long" and below a "short" duration. Besides differences in maturity structure, there can also be differences in the frequency of repricing of claims with the same final maturity, as for example, in fixed vs. variable rate mortgages. Consistent data on such differences across banks and countries is not available, however. Return to text
10. Accounting differences across countries can limit direct comparability of U.S. and AFE financial statements. For example, derivatives are reported to some extent at net values for U.S. banks but are largely at gross values under International Financial Reporting Standards, which has the effect of inflating assets and reducing return on asset figures for AFE banks. Gross derivatives represent roughly 15 percent for a representative European bank sample assets on a weighted basis, a material share, but not one that would substantially affect the profitability and NIM comparisons. Return to text
Please cite as:
Claessens, Stijn, Nicholas S. Coleman, and Michael Donnelly (2016). "'Low-for-Long' Interest Rates and Net Interest Margins of Banks in Advanced Foreign Economies," IFDP Notes. Washington: Board of Governors of the Federal Reserve System, April 11, 2016. https://doi.org/10.17016/2573-2129.20
Disclaimer: IFDP Notes are articles in which Board economists offer their own views and present analysis on a range of topics in economics and finance. These articles are shorter and less technically oriented than IFDP Working Papers.
