Minutes of the Federal Open Market Committee
March 15-16, 2016
In conjunction with the Federal Open Market Committee (FOMC) meeting held on March 15-16, 2016, meeting participants submitted their projections of the most likely outcomes for real output growth, the unemployment rate, inflation, and the federal funds rate for each year from 2016 to 2018 and over the longer run. Each participant's projection was based on information available at the time of the meeting, together with his or her assessment of appropriate monetary policy and assumptions about the factors likely to affect economic outcomes. The longer-run projections represent each participant's assessment of the value to which each variable would be expected to converge, over time, under appropriate monetary policy and in the absence of further shocks to the economy. "Appropriate monetary policy" is defined as the future path of policy that each participant deems most likely to foster outcomes for economic activity and inflation that best satisfy his or her individual interpretation of the Federal Reserve's objectives of maximum employment and stable prices.
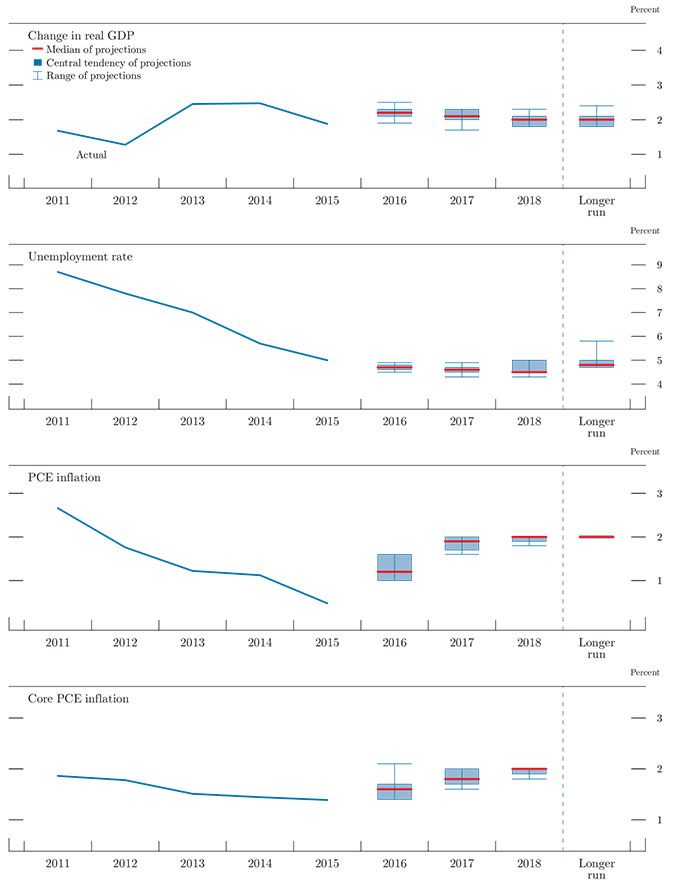
FOMC participants generally expected that, under appropriate monetary policy, growth in real gross domestic product (GDP) would be at or somewhat above their individual estimates of the longer-run growth rate in 2016 and 2017 and would converge toward the longer-run rate in 2018 (table 1 and figure 1). All participants projected that by the end of the current year, the unemployment rate would decline to, or fall below, their individual estimates of the longer-run normal unemployment rate--that is, their projected unemployment gaps would be zero or negative--and that these zero or negative gaps would persist through 2018, even though many participants reduced their estimates of the longer-run normal rate. All participants projected that inflation, as measured by the four-quarter change in the price index for personal consumption expenditures (PCE), would pick up in 2016 and 2017 from the very low rate seen in 2015. Participants generally projected inflation to be either at or just slightly below the Committee's 2 percent objective by the end of 2018.
Table 1. Economic projections of Federal Reserve Board members and Federal Reserve Bank presidents, under their individual assessments of projected appropriate monetary policy, March 2016
Percent
| Variable | Median1 | Central tendency2 | Range3 | ||||||||||||
|---|---|---|---|---|---|---|---|---|---|---|---|---|---|---|---|
| 2016 | 2017 | 2018 | Longer run | 2016 | 2017 | 2018 | Longer run | 2016 | 2017 | 2018 | Longer run | ||||
| Change in real GDP | 2.2 | 2.1 | 2.0 | 2.0 | 2.1 - 2.3 | 2.0 - 2.3 | 1.8 - 2.1 | 1.8 - 2.1 | 1.9 - 2.5 | 1.7 - 2.3 | 1.8 - 2.3 | 1.8 - 2.4 | |||
| December projection | 2.4 | 2.2 | 2.0 | 2.0 | 2.3 - 2.5 | 2.0 - 2.3 | 1.8 - 2.2 | 1.8 - 2.2 | 2.0 - 2.7 | 1.8 - 2.5 | 1.7 - 2.4 | 1.8 - 2.3 | |||
| Unemployment rate | 4.7 | 4.6 | 4.5 | 4.8 | 4.6 - 4.8 | 4.5 - 4.7 | 4.5 - 5.0 | 4.7 - 5.0 | 4.5 - 4.9 | 4.3 - 4.9 | 4.3 - 5.0 | 4.7 - 5.8 | |||
| December projection | 4.7 | 4.7 | 4.7 | 4.9 | 4.6 - 4.8 | 4.6 - 4.8 | 4.6 - 5.0 | 4.8 - 5.0 | 4.3 - 4.9 | 4.5 - 5.0 | 4.5 - 5.3 | 4.7 - 5.8 | |||
| PCE inflation | 1.2 | 1.9 | 2.0 | 2.0 | 1.0 - 1.6 | 1.7 - 2.0 | 1.9 - 2.0 | 2.0 | 1.0 - 1.6 | 1.6 - 2.0 | 1.8 - 2.0 | 2.0 | |||
| December projection | 1.6 | 1.9 | 2.0 | 2.0 | 1.2 - 1.7 | 1.8 - 2.0 | 1.9 - 2.0 | 2.0 | 1.2 - 2.1 | 1.7 - 2.0 | 1.7 - 2.1 | 2.0 | |||
| Core PCE inflation4 | 1.6 | 1.8 | 2.0 | 1.4 - 1.7 | 1.7 - 2.0 | 1.9 - 2.0 | 1.4 - 2.1 | 1.6 - 2.0 | 1.8 - 2.0 | ||||||
| December projection | 1.6 | 1.9 | 2.0 | 1.5 - 1.7 | 1.7 - 2.0 | 1.9 - 2.0 | 1.4 - 2.1 | 1.6 - 2.0 | 1.7 - 2.1 | ||||||
| Memo: Projected appropriate policy path | |||||||||||||||
| Federal funds rate | 0.9 | 1.9 | 3.0 | 3.3 | 0.9 - 1.4 | 1.6 - 2.4 | 2.5 - 3.3 | 3.0 - 3.5 | 0.6 - 1.4 | 1.6 - 2.8 | 2.1 - 3.9 | 3.0 - 4.0 | |||
| December projection | 1.4 | 2.4 | 3.3 | 3.5 | 0.9 - 1.4 | 1.9 - 3.0 | 2.9 - 3.5 | 3.3 - 3.5 | 0.9 - 2.1 | 1.9 - 3.4 | 2.1 - 3.9 | 3.0 - 4.0 | |||
Note: Projections of change in real gross domestic product (GDP) and projections for both measures of inflation are percent changes from the fourth quarter of the previous year to the fourth quarter of the year indicated. PCE inflation and core PCE inflation are the percentage rates of change in, respectively, the price index for personal consumption expenditures (PCE) and the price index for PCE excluding food and energy. Projections for the unemployment rate are for the average civilian unemployment rate in the fourth quarter of the year indicated. Each participant's projections are based on his or her assessment of appropriate monetary policy. Longer-run projections represent each participant's assessment of the rate to which each variable would be expected to converge under appropriate monetary policy and in the absence of further shocks to the economy. The projections for the federal funds rate are the value of the midpoint of the projected appropriate target range for the federal funds rate or the projected appropriate target level for the federal funds rate at the end of the specified calendar year or over the longer run. The December projections were made in conjunction with the meeting of the Federal Open Market Committee on December 15-16, 2015.
1. For each period, the median is the middle projection when the projections are arranged from lowest to highest. When the number of projections is even, the median is the average of the two middle projections. Return to table
2. The central tendency excludes the three highest and three lowest projections for each variable in each year. Return to table
3. The range for a variable in a given year includes all participants' projections, from lowest to highest, for that variable in that year. Return to table
4. Longer-run projections for core PCE inflation are not collected. Return to table
Figure 1. Medians, central tendencies, and ranges of economic projections, 2016–18 and over the longer run*
Accessible version of figure 1 | Return to figure 1
As shown in figure 2, participants expected that it would be appropriate to raise the target range for the federal funds rate gradually over the projection period as headwinds to economic growth dissipate slowly over time and as inflation rises toward the Committee's goal of 2 percent. Consistent with this outlook, nearly all participants projected that the appropriate level of the federal funds rate would be below their individual estimates of its longer-run level through 2018.
Figure 2. FOMC participants' assessments of appropriate monetary policy: Midpoint of target range or target level for the federal funds rate*
Accessible version of figure 2 | Return to figure 2
Almost all participants regarded the levels of uncertainty associated with their forecasts for economic growth and the unemployment rate as broadly similar to the norms of the previous 20 years and shared a similar view regarding the uncertainty surrounding their inflation projections. Participants were about evenly divided as to whether they judged the risks to their forecasts for real GDP growth to be weighted to the downside or broadly balanced; no participant saw risks to real GDP growth as weighted to the upside. Participants who thought that risks to their outlook for real GDP growth were skewed to the downside tended to cite developments in foreign economies, recent volatility in financial markets, or the limited capacity of policy to respond to adverse developments as contributing to that view. Risk perceptions regarding the unemployment rate were more dispersed. Most participants regarded risks to their unemployment rate forecasts as broadly balanced, but four participants considered risks as skewed toward a higher unemployment rate, and two viewed risks as weighted toward a lower unemployment rate. A majority of participants thought that the risks attending their projections for PCE price inflation were weighted to the downside; almost all of these participants also saw risks to core PCE inflation as tilted in the same direction. Among the reasons cited by participants for perceptions of downside risk to their inflation projections were ongoing developments in overseas economies and their possible implications for U.S. import prices, declines in energy prices since December, and low readings for some indicators of long-term inflation expectations.
The Outlook for Economic Activity
A substantial majority of participants expected that, conditional on their individual assumptions about appropriate monetary policy, real GDP in 2016 and 2017 would increase at a rate above their individual estimates of the longer-run normal growth rate before decelerating to a pace at or near their individual estimates of the longer-run normal rate. A number of participants indicated that they expected domestic factors--including improving labor market conditions, stronger household and business balance sheets, lower consumer energy prices, and a still-accommodative stance of monetary policy--to contribute to strength in aggregate expenditures, while foreign conditions were projected to be a source of weakness for some time.
Compared with their forecasts prepared for the Summary of Economic Projections (SEP) in December, most participants marked down their projections of real GDP growth in 2016, and several did so for 2017. Overall, the median value of participants' projections for real GDP growth in 2016 was revised down a little to 2.2 percent, and that for 2017 was revised down slightly to 2.1 percent.
The median forecast for the unemployment rate was a bit lower in 2017 and 2018 than in December and showed a modest downward tilt over the three years of the forecast. Participants cited stronger-than-expected labor market data in recent months as a factor explaining these revisions. Moreover, many participants also reduced their estimates of the longer-run normal rate of unemployment, resulting in a modest reduction in the median of the longer-run rate. Thus, while a majority expected the unemployment rate gap to turn negative by the end of this year, fewer participants projected a negative gap at that time than was the case in December. For 2017, all participants projected a negative unemployment rate gap, and a substantial majority did so for 2018 as well. All told, however, the medians of the unemployment rate gaps for the three years of the projection were essentially unchanged from the December SEP.
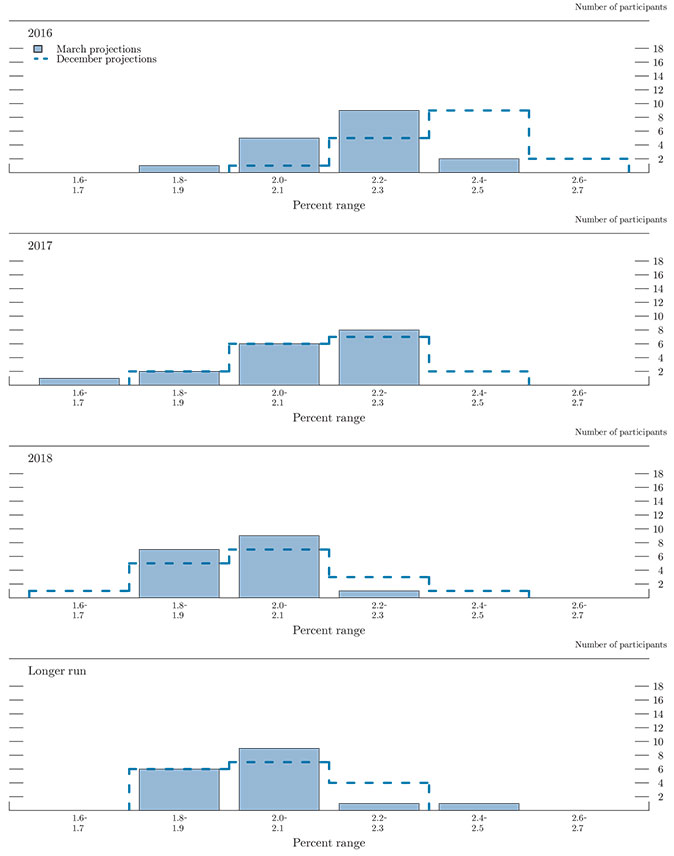
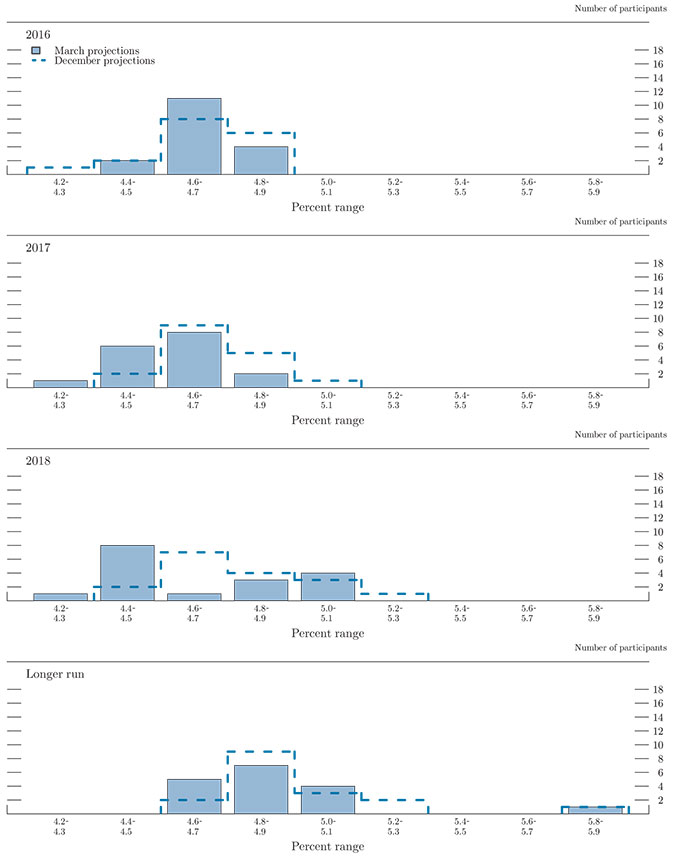
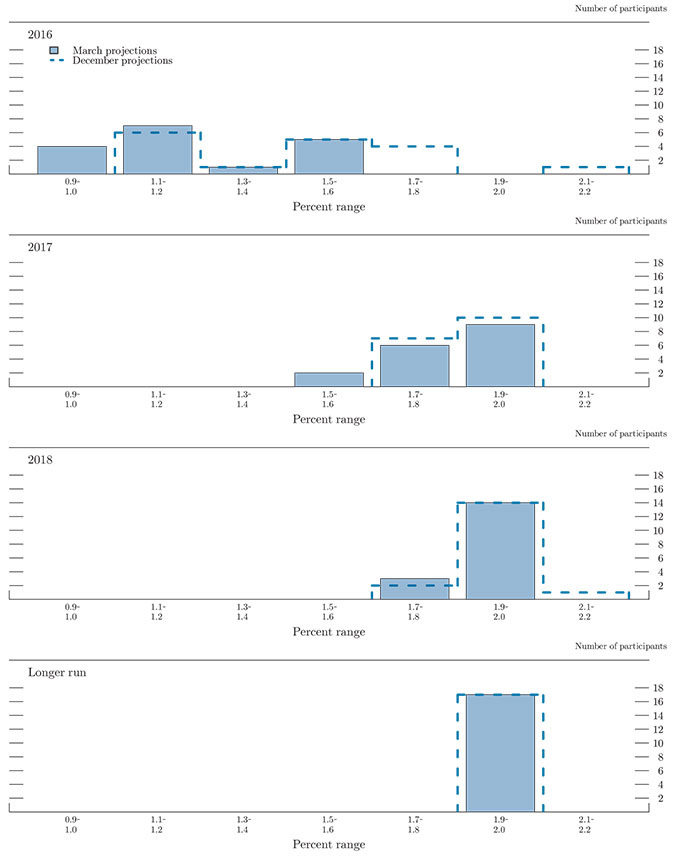
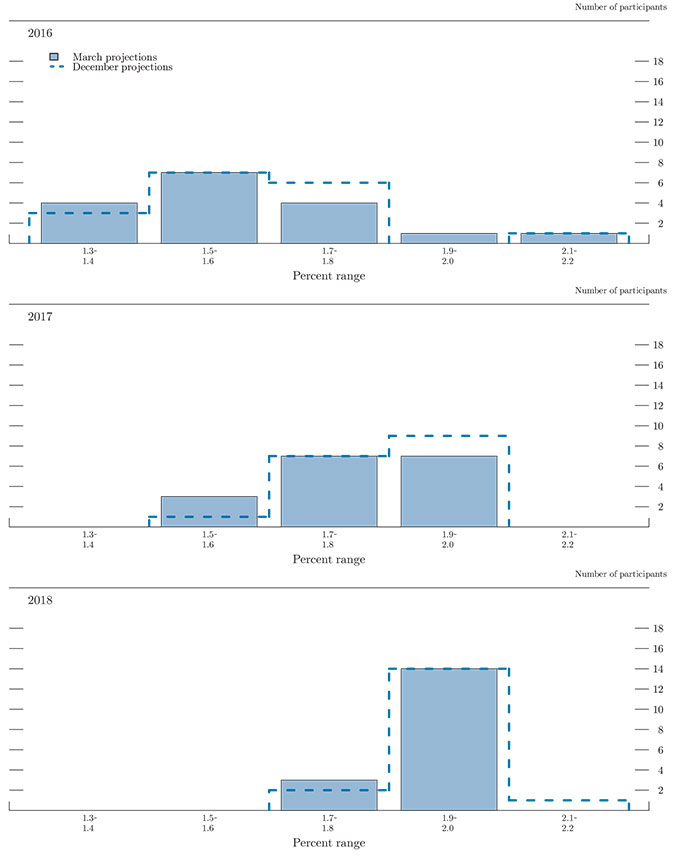
Figures 3.A and 3.B show the distribution of participants' views regarding the likely outcomes for real GDP growth and the unemployment rate through 2018 and in the longer run. The distribution of the projections of GDP growth shifted toward lower values for 2016; differences from December for 2017 and 2018 were less noteworthy, but there was a modest narrowing of the distribution for 2018. The distributions of projections for the unemployment rate in 2017 and beyond shifted modestly toward lower values, relative to the December SEP, on the basis of strong labor market indicators in recent months.
Figure 3.A. Distribution of participants' projections for the change in real GDP, 2016-18 and over the longer run*
Accessible version of figure 3.A | Return to figure 3.A
Figure 3.B. Distribution of participants' projections for the unemployment rate, 2016-18 and over the longer run*
Accessible version of figure 3.B | Return to figure 3.B
The Outlook for Inflation
All participants projected PCE price inflation to pick up in 2016 and to rise further in 2017. For 2018, nearly all expected PCE price inflation to be at or very close to the Committee's 2 percent longer-run objective. However, relative to the December SEP, almost all participants marked down their projections for PCE price inflation in 2016, observing that declines in energy prices since the end of last year and continued strength in the dollar were expected to impart additional downward pressure on inflation this year. Many participants also lowered their projections for inflation in 2017, although the median value for that year was unchanged. Inflation projections in 2018 were little changed from December. Regarding core PCE price inflation, some participants marked down their projections for 2016, although almost all still expected core inflation to rise gradually over the projection period and to be at or very close to 2 percent by the end of 2018. Factors cited by participants as contributing to their expectation that inflation will rise over the medium term included recent readings for core inflation, an anticipation that improvements in labor markets will continue, the fading effects of recent dollar appreciation and declines in oil prices, and an assessment that long-term inflation expectations will remain at levels consistent with the FOMC's 2 percent objective, all supported by a stance of monetary policy that participants generally described as accommodative.
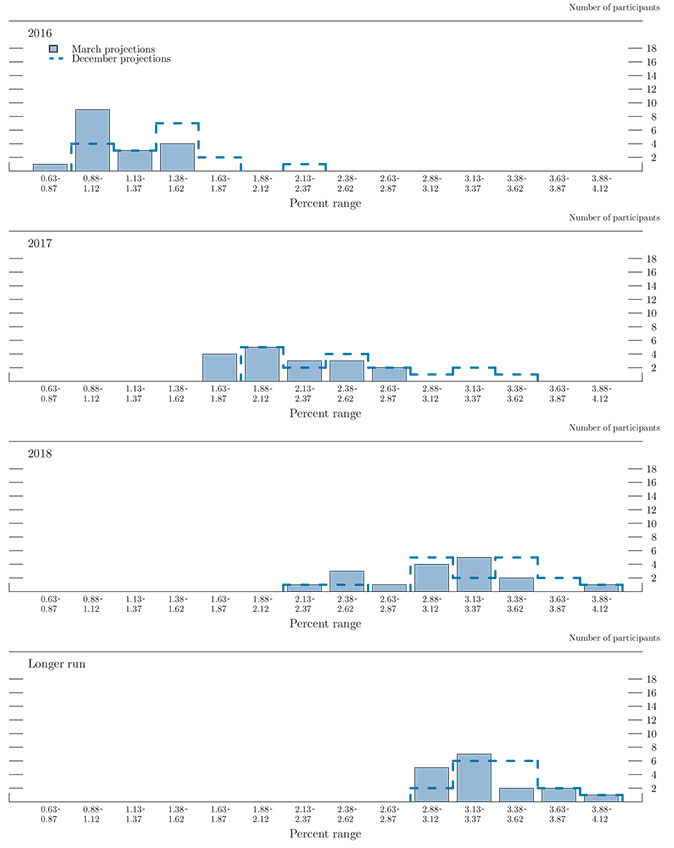
Figures 3.C and 3.D provide information on the distribution of participants' views about the outlook for inflation. The distribution for PCE price inflation in 2016 shifted notably to the left compared with the December SEP, while changes in the distributions of projections for 2017 and 2018 were small. The distributions of participants' projections for core PCE price inflation shifted only a touch toward lower values for 2017 and 2018 as compared with December.
Figure 3.C. Distribution of participants' projections for PCE inflation, 2016-18 and over the longer run*
Accessible version of figure 3.C | Return to figure 3.C
Figure 3.D. Distribution of participants' projections for core PCE inflation, 2016-18*
Accessible version of figure 3.D | Return to figure 3.D
Appropriate Monetary Policy
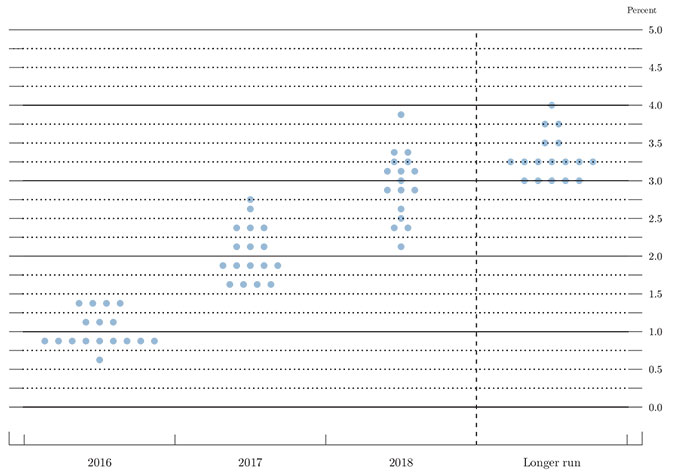
Figure 3.E provides the distribution of participants' judgments regarding the appropriate level of the target federal funds rate at the end of each calendar year from 2016 to 2018 and over the longer run. Relative to December, the projections of the appropriate levels of the federal funds rate over the next three years shifted notably toward lower values. The median projections for the federal funds rate at the end of 2016 and 2017 both declined 0.50 percentage point, to levels of 0.88 percent and 1.88 percent, respectively, while the median for the end of 2018 fell 0.25 percentage point, to 3.0 percent. The median for the federal funds rate in the longer run was also reduced 0.25 percentage point, to 3.25 percent. The view that a lower path of the federal funds rate relative to December would be appropriate for achieving the Committee's objectives was broadly shared across participants, especially for the first two years of their forecasts. Given their expectations that certain factors would continue to restrain economic growth for a time, that inflation will increase only gradually to 2 percent, and that the economic and policy outlook entails asymmetric risks over the next few years, participants generally projected that a gradual rise in the federal funds rate over that period would be appropriate; almost all participants judged it advisable for the federal funds rate to remain below their individual estimates of its longer-run normal level through the end of 2018.
Figure 3.E. Distribution of participants' judgments of the midpoint of the appropriate target range for the federal funds rate or the appropriate target level for the federal funds rate, 2016-18 and over the longer run*
Accessible version of figure 3.E | Return to figure 3.E
Although the median of participants' projections of the federal funds rate in the longer run moved lower, the range of estimates for the longer-run rate was unchanged from December. Hence, with all participants anticipating that inflation would eventually reach the Committee's objective of 2 percent, the range of participants' judgments of the longer-run level of the real federal funds rate was also unchanged from December, at 1 to 2 percent; the median value for the longer-run real rate was 1.25 percent, down 0.25 percentage point from December.
Participants' views of the appropriate path for monetary policy were informed by their judgments about the outlook for economic activity, labor markets, and inflation as well as the risks and uncertainties associated with that outlook. One important consideration for many participants was their assessment that several factors--including weak foreign economic conditions, a persistently high exchange value of the dollar, and tighter financial conditions--will continue to restrain economic growth for a time and thus collectively imply a temporarily low level for the neutral rate of interest. These forces, combined with the current proximity of short-term interest rates to their effective lower bound and the related asymmetry of risks around the outlook for real GDP growth and inflation, were noted as reasons why a gradual approach to raising the federal funds rate would be appropriate, provided that the outlook for the economy unfolded about as expected. Another consideration underlying the anticipated gradual removal of policy accommodation involved the prospects for inflation to return to the Committee's objective of 2 percent. In assessing those prospects, participants weighed the implications of a range of factors, including indicators of longer-run inflation expectations and the magnitude and persistence of the effects of both low energy prices and the earlier appreciation of the dollar. Judgments regarding the likely future strength of the labor market and future wage gains also figured into participants' forecasts for inflation.
Uncertainty and Risks
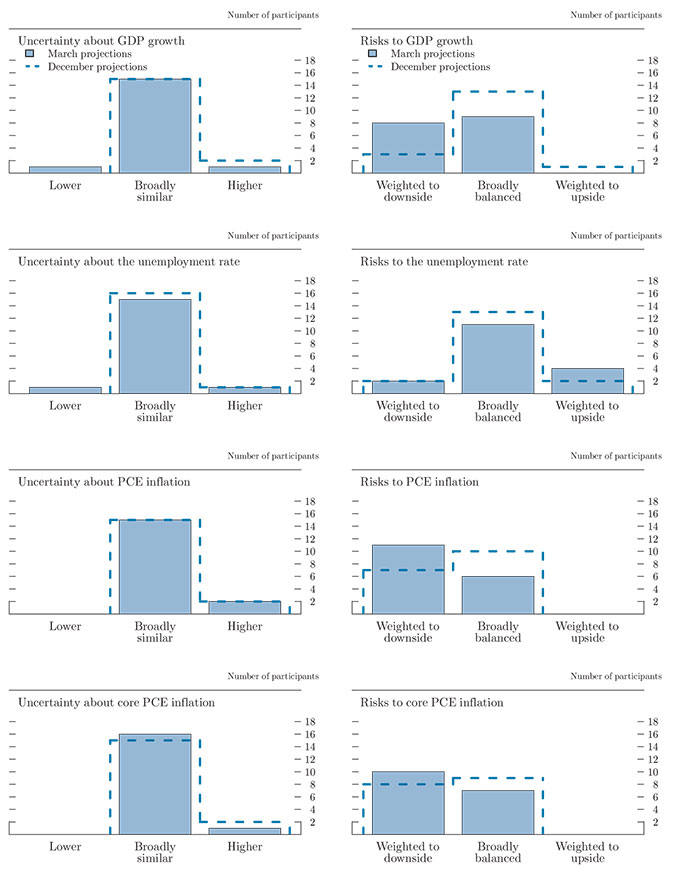
As in the December SEP, nearly all participants judged the levels of uncertainty around their projections for real GDP growth, the unemployment rate, and both headline and core PCE price inflation as broadly similar to the average levels of the past 20 years (as shown in the left-hand column of figure 4).1 In contrast, participants revised appreciably their assessments of the risks to real GDP growth, the unemployment rate, and both headline and core inflation since December (as shown in the right-hand column). Eight participants saw the risks to real GDP growth as weighted to the downside--up from three in December. Four participants saw risks to the unemployment rate as skewed toward higher unemployment--two more than in December--while two continued to see risks weighted toward lower unemployment. Explanations for the less marked shift in risks to the outlook for the unemployment rate versus the outlook for real GDP growth included favorable labor market news over the past three months. More generally, participants cited financial market and global economic conditions, either on their own or coupled with the limited capacity of policymakers to respond to possible adverse economic conditions, as reasons for the downward tilt to their perceptions of the risks to growth. Turning to inflation, 11 participants indicated that the risks to their headline inflation forecasts were skewed to the downside, up from 7 in December, and nearly all of these participants saw the same tilt to the risks for core inflation. Many participants noted some recent evidence of a deterioration, or an absence of improvement, in indicators of long-term inflation expectations as contributing to increased downside risks for inflation, while some pointed to the further declines in energy prices.
Table 2. Average historical projection error ranges
Percentage points
| Variable | 2016 | 2017 | 2018 |
|---|---|---|---|
| Change in real GDP1 | ±1.6 | ±2.1 | ±2.1 |
| Unemployment rate1 | ±0.5 | ±1.2 | ±1.7 |
| Total consumer prices2 | ±0.9 | ±1.1 | ±1.1 |
Note: Error ranges shown are measured as plus or minus the root mean squared error of projections for 1996 through 2015 that were released in the spring by various private and government forecasters. As described in the box "Forecast Uncertainty," under certain assumptions, there is about a 70 percent probability that actual outcomes for real GDP, unemployment, and consumer prices will be in ranges implied by the average size of projection errors made in the past. For more information, see David Reifschneider and Peter Tulip (2007), "Gauging the Uncertainty of the Economic Outlook from Historical Forecasting Errors," Finance and Economics Discussion Series 2007-60 (Washington: Board of Governors of the Federal Reserve System, November); and Board of Governors of the Federal Reserve System, Division of Research and Statistics (2014), "Updated Historical Forecast Errors (PDF)," memorandum, April 9.
1. Definitions of variables are in the general note to table 1. Return to table
2. Measure is the overall consumer price index, the price measure that has been most widely used in government and private economic forecasts. Projection is percent change, fourth quarter of the previous year to the fourth quarter of the year indicated. Return to table
Figure 4. Uncertainty and risks in economic projections*
Accessible version of figure 4 | Return to figure 4
The economic projections provided by the members of the Board of Governors and the presidents of the Federal Reserve Banks inform discussions of monetary policy among policymakers and can aid public understanding of the basis for policy actions. Considerable uncertainty attends these projections, however. The economic and statistical models and relationships used to help produce economic forecasts are necessarily imperfect descriptions of the real world, and the future path of the economy can be affected by myriad unforeseen developments and events. Thus, in setting the stance of monetary policy, participants consider not only what appears to be the most likely economic outcome as embodied in their projections, but also the range of alternative possibilities, the likelihood of their occurring, and the potential costs to the economy should they occur.
Table 2 summarizes the average historical accuracy of a range of forecasts, including those reported in past Monetary Policy Reports and those prepared by the Federal Reserve Board's staff in advance of meetings of the Federal Open Market Committee. The projection error ranges shown in the table illustrate the considerable uncertainty associated with economic forecasts. For example, suppose a participant projects that real gross domestic product (GDP) and total consumer prices will rise steadily at annual rates of, respectively, 3 percent and 2 percent. If the uncertainty attending those projections is similar to that experienced in the past and the risks around the projections are broadly balanced, the numbers reported in table 2 would imply a probability of about 70 percent that actual GDP would expand within a range of 1.4 to 4.6 percent in the current year and 0.9 to 5.1 percent in the second and third years. The corresponding 70 percent confidence intervals for overall inflation would be 1.1 to 2.9 percent in the current year and 0.9 to 3.1 percent in the second and third years.
Because current conditions may differ from those that prevailed, on average, over history, participants provide judgments as to whether the uncertainty attached to their projections of each variable is greater than, smaller than, or broadly similar to typical levels of forecast uncertainty in the past, as shown in table 2. Participants also provide judgments as to whether the risks to their projections are weighted to the upside, are weighted to the downside, or are broadly balanced. That is, participants judge whether each variable is more likely to be above or below their projections of the most likely outcome. These judgments about the uncertainty and the risks attending each participant's projections are distinct from the diversity of participants' views about the most likely outcomes. Forecast uncertainty is concerned with the risks associated with a particular projection rather than with divergences across a number of different projections.
As with real activity and inflation, the outlook for the future path of the federal funds rate is subject to considerable uncertainty. This uncertainty arises primarily because each participant's assessment of the appropriate stance of monetary policy depends importantly on the evolution of real activity and inflation over time. If economic conditions evolve in an unexpected manner, then assessments of the appropriate setting of the federal funds rate would change from that point forward.
1. Table 2 provides estimates of the forecast uncertainty for the change in real GDP, the unemployment rate, and total consumer price inflation over the period from 1996 through 2015. At the end of this summary, the box "Forecast Uncertainty" discusses the sources and interpretation of uncertainty in the economic forecasts and explains the approach used to assess the uncertainty and risks attending the participants' projections. Return to text