Report to the Congress on Government-Administered,
General-Use Prepaid Cards, July 2015
- Background
- Survey Data and Results
Survey Data and Results
The Board distributed a survey to 15 issuers to collect prevalence-of-use and fee data on federal, state, and local government-administered payment programs that used prepaid cards as a method to disburse funds in calendar year 2014.10 All issuers responded, reporting data for 889 programs.11 These data represent programs from all 50 states and the District of Columbia.12
To reduce reporting burden on the public, the Board made several material changes to the data collection process this year. For example, the Board did not administer the FR 3063b survey of government agencies (government survey). Instead, the Board relied on the data collected from the FR 3063a survey of issuers (issuer survey) and publicly available government expenditure data to calculate prevalence-of-use metrics. In addition, the Board significantly revised and simplified the reporting process for the issuer survey.13
Many of the figures in this report are not comparable with corresponding figures in previous reports.14 Because of the changes the Board made to the data collection process this year, the Board computed many of the metrics in this report using a new methodology or data source. Where possible, the Board has provided a limited number of year-over-year comparisons in this report by applying this year's methodology to data collected in previous years. As the Board collects additional years of data under the revised issuer survey, the Board intends to provide more information on general trends in these reports regarding the government-administered prepaid card market.
Prevalence of Use
In this Section:
Calendar Year 2014: Prepaid Card Disbursements
For calendar year 2014, government agencies disbursed $148 billion through prepaid cards across reported programs.15 These prepaid disbursements represent approximately 2.5 percent of total government expenditures in 2014.16
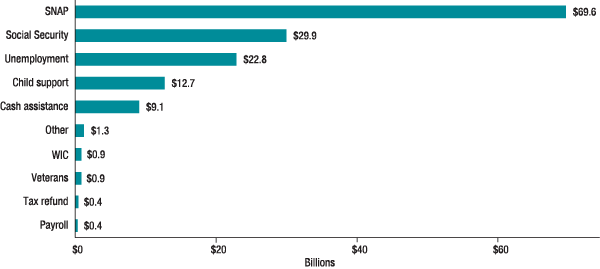
Total funds disbursed through prepaid cards varied widely by program type, as shown in figure 1. State agencies administering SNAP disbursed $70 billion to EBT cards in 2014, accounting for just under half of prepaid funding across all reported programs. The Social Security Administration distributed approximately $30 billion though prepaid cards, representing one-fifth of all reported funds disbursed through prepaid cards. Unemployment insurance, child support, and cash assistance programs largely accounted for the remaining one-third.17 In contrast, Veterans Affairs, WIC, tax refund, and payroll programs each accounted for less than 1 percent of total prepaid disbursements.

Across the largest program types that provide a prepaid card disbursement option, state and local programs tend to have higher rates of prepaid card use than federal programs. Funds disbursed under state SNAP programs, for example, are distributed exclusively through prepaid cards. Similarly, state agencies disbursed a relatively high proportion (66 percent) of unemployment insurance payments through prepaid cards.18 In contrast, prepaid card disbursements represent only 3.5 percent of the $845 billion in benefit payments made under federal Social Security programs.19 Similarly, the Department of Veterans Affairs disbursed only 1.3 percent of program funds through prepaid cards.
Year-over-Year Comparisons
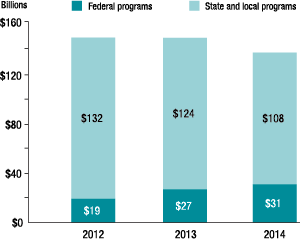
Although the Board has collected only one year of data under the latest version of the issuer survey, the Board was able to make a limited number of year-over-year comparisons by analyzing the subset of data collected consistently over the last three years.20 Across these data, disbursements to prepaid cards fell 8 percent between 2013 and 2014, from $151 billion to $139 billion. As shown in figure 2, this decrease is driven by a 13 percent reduction in prepaid disbursements across reported state and local programs, a trend that has continued since 2012. The drop in state and local card funding is due, in part, to a $5 billion decrease in SNAP benefits disbursed from 2013 to 2014. Additionally, issuers have indicated that the decrease in state and local card funding partially reflects shrinking unemployment insurance benefits due to the expiration of the Emergency Unemployment Compensation (EUC) benefit program for the long-term unemployed in December 2013. Indeed, according to data obtained from the Department of Labor, the number of unemployment insurance beneficiaries decreased 39 percent from 2013 to 2014.21 Although this decline is mostly attributable to the termination of EUC benefits, it is also partly attributable to a reduction in regular state unemployment compensation claims in the face of improving economic conditions. As figure 2 shows, the decline in state and local card funding in 2014 was partially offset by an increase in federal card funding, reflecting a 15 percent increase in prepaid card disbursements under Social Security programs.
Fees Collected by Issuers
In this Section:
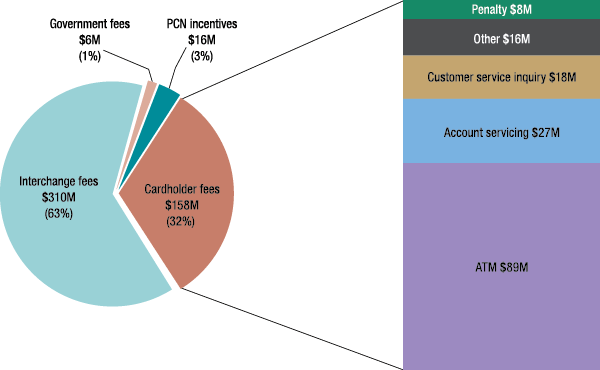
Issuers receive revenue from two main sources: interchange fees and cardholder fees.22 Less commonly, issuers also receive incentive payments from payment card networks and fees from government offices for providing prepaid services.23 In 2014, issuers reported collecting $310 million in interchange fees, $158 million in cardholder fees, $16 million in payment card network incentive fees, and $6 million in fees assessed to government offices.24 Figure 3 illustrates the various sources of revenue collected by issuers in 2014.25 Relative to 2013, interchange and cardholder fee revenue each decreased by $17 million in 2014, or 5 percent and 10 percent, respectively. These decreases in revenue may be partly attributable to the decrease in card funding for state and local disbursement programs.
Interchange Fees
As shown in table 1, the interchange fees from prepaid card purchase transactions have been relatively stable since the Board began collecting these data in 2010.26 Across all programs from 2013 to 2014, the average interchange fee per purchase transaction decreased by 2 cents, and the average purchase transaction value fell by 78 cents. The average interchange fee as a percent of purchase transaction value remained unchanged at 1.2 percent from 2013 to 2014.
The average interchange fee as a percent of purchase transaction value remained at 1.1 percent for federal programs in 2014. It decreased slightly for state and local programs, to 1.2 percent in 2014 from 1.3 percent in 2013. Like other year-over-year comparisons in this report, the calculations of average purchase transaction value and the average interchange fee per purchase transaction are sensitive to changes in the pool of reported programs, which differs from year to year.27
Transactions made using government prepaid cards are generally exempt from the interchange fee standards of Regulation II. The average interchange fee as a percent of purchase transaction value for government prepaid card transactions is similar to that for all debit card transactions exempt from the interchange fee caps of Regulation II.28
| Average value of purchase transaction1 (dollars) | Average interchange fee per purchase transaction2 (dollars) | Average interchange fee as percentage of purchase transaction value3 (percent) | |||||||||||||
|---|---|---|---|---|---|---|---|---|---|---|---|---|---|---|---|
| 2010 | 2011 | 2012 | 2013 | 2014 | 2010 | 2011 | 2012 | 2013 | 2014 | 2010 | 2011 | 2012 | 2013 | 2014 | |
| Total | 28.41 | 30.94 | 29.99 | 29.94 | 29.16 | 0.30 | 0.33 | 0.34 | 0.36 | 0.34 | 1.1 | 1.1 | 1.1 | 1.2 | 1.2 |
| Federal programs | 35.49 | 36.82 | 38.11 | 44.83 | 38.53 | 0.38 | 0.40 | 0.40 | 0.48 | 0.41 | 1.1 | 1.1 | 1.1 | 1.1 | 1.1 |
| State and local programs | 27.42 | 29.81 | 28.14 | 25.58 | 24.85 | 0.29 | 0.32 | 0.33 | 0.33 | 0.31 | 1.1 | 1.1 | 1.2 | 1.3 | 1.2 |
1. Average value of purchase transaction: Value of settled purchase transactions divided by the number of settled purchase transactions. Return to table
2. Average interchange fee per purchase transaction: Total interchange fees divided by the number of settled purchase transactions. Return to table
3. Average interchange fee as percentage of purchase transaction value: Total interchange fees divided by the value of settled purchase transactions. Return to table
Cardholder Fees
The data provided by issuers show that cardholder fee revenue as a percentage of program funds disbursed by prepaid card remained unchanged at 0.23 percent between 2013 and 2014.
In addition to negotiating cardholder fee rates, government offices often restrict the number and type of cardholder fees that an issuer can charge. Most government offices require issuers to offer cardholders a certain number of free ATM or over-the-counter (OTC) cash withdrawals and prohibit issuers from charging cardholders certain types of fees, such as monthly maintenance fees.29 Occasionally, issuers provide cardholders with more-favorable terms than those mandated by government offices, such as unlimited in-network ATM and OTC withdrawals.
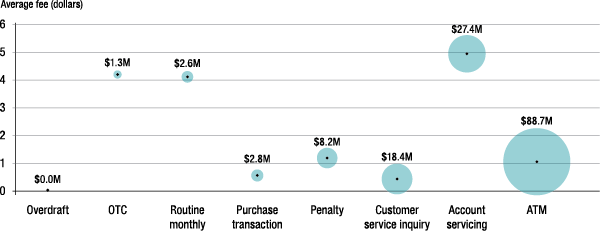
Figure 4 illustrates the total revenue issuers collected and the average charge per occurrence by cardholder fee type in 2014. The Board excluded transactions for which no fee was assessed from the average fee calculations. In 2014, issuers collected $88.7 million on ATM cash withdrawals, accounting for 56 percent of revenue issuers received from cardholder fees. The average fee charged by an issuer for an ATM cash withdrawal was $1.06 per transaction. Account servicing fees represent roughly 17 percent of total cardholder fee revenue, while customer service inquiry, penalty, purchase transaction fees, and routine monthly fees largely account for the remaining 27 percent of total cardholder fee revenue. Account servicing fees are the highest type of cardholder fee, at an average of $4.94 per occurrence. Revenue from overdraft fees virtually disappeared in 2014, following a steep decline from 2012 to 2013. As of July 21, 2012, prepaid cards that may incur overdraft fees are ineligible for the exemption from the interchange fee standards of Regulation II.30 It appears that, rather than lose the exemption, issuers have largely abandoned overdraft fees.

Note: Size of bubble represents total revenue from fee.
Position of black dot on vertical axis represents average fee when charged.
Although figures 3 and 4 illustrate the distribution of cardholder fee revenue on an aggregate level, this distribution is not representative of any particular program. Government offices and issuers negotiate a cardholder fee schedule for each program. Furthermore, the proportion of transactions resulting in the assessment of a cardholder fee depends heavily on the type of program. As a result, there is significant heterogeneity in cardholder fees across programs that use prepaid cards to disburse funds.
Fees Paid by Issuers
Issuers pay fees to third parties when a cardholder withdraws cash from an out-of-network ATM or bank.31 In 2014, issuers reported paying approximately $58 million in fees to third parties for ATM withdrawals and $13 million in fees to third parties for OTC cash withdrawals.32
References
10. "Government-Administered, General-Use Prepaid Card Survey--Issuer Survey," FR 3063a, OMB No. 7100-0343, Board, www.federalreserve.gov/paymentsystems/files/FR3063a_government_issuer_survey_2014.pdf. The FR 3063a survey is conducted annually to collect information for this report. The Board identified issuers to survey by consulting with relevant payment card networks. Return to text
11. For the 2014 data, issuers self-reported the number of programs included in their responses. In previous years, the Board provided lower-bound approximations for program counts because issuers were not required to report the number. Because of this change in methodology, the program counts in this report are not comparable to corresponding counts in previous reports. Return to text
12. The Board also collected a limited amount of prevalence-of-use data from the U.S. Treasury, the USDA's Food and Nutrition Service, and two nonbank payment providers that process EBT transactions. Program counts were not available from these organizations. Return to text
13. Proposed Agency Information Collection Activities; Comment Request, 79 Fed. Reg. 56,368 (September 19, 2014), www.gpo.gov/fdsys/pkg/FR-2014-09-19/pdf/2014-22357.pdf. Finalized at, Agency Information Collection Activities: Announcement of Board Approval Under Delegated Authority and Submission to OMB, 70 Fed. Reg. 71,767 (December 3, 2014), www.gpo.gov/fdsys/pkg/FR-2014-12-03/pdf/2014-28432.pdf. In the previous version of the issuer survey, a respondent was required to complete the questionnaire for each individual government-administered payment program for which the respondent is the prepaid card issuer. In the new version of the survey, respondents are required to complete the survey at most twice: once for all federal programs (in aggregate) and once for all state/local programs (in aggregate). The Board revised the reporting structure to reduce reporting burden on respondents without significantly compromising the value of the data collected. In addition, the Board streamlined the survey by combining relevant sections of the previous version of the questionnaire. The Board also added a new section to capture information on revenue received by issuers other than through interchange and cardholder fees. A section-by-section description of the changes to the issuer survey is provided in the Board's September 2014 Federal Register notice. Return to text
14. See "Payment Research," Board, last modified August 11, 2014, www.federalreserve.gov/paymentsystems/payres_papers.htm, for previous Board reports to the Congress on government-administered, general-use prepaid cards. Return to text
15. In previous years, the Board used the government survey data to estimate total funds disbursed through prepaid cards. As discussed earlier in this report, the Board did not administer the government survey this year. Because of this methodological change, the prepaid card disbursement figures in this report are not comparable with corresponding figures in previous reports.
Funds disbursed onto prepaid cards but ultimately returned to government agencies are excluded from this figure. The value of funds returned to government agencies is de minimis (equal to 0.3 percent of gross funds disbursed through prepaid cards in 2014).
Return to text16. "Table 3.1. Government Current Receipts and Expenditures," U.S. Department of Commerce, Bureau of Economic Analysis, last modified June 24, 2015, http://www.bea.gov/iTable/iTable.cfm?ReqID=16#reqid=16&step=1&isuri=1. Total government expenditures include expenditures of federal, state, and local governments. Return to text
17. Cash assistance includes TANF, Low Income Home Energy Assistance Program, child care, refugee assistance, and general assistance programs. Return to text
18. "Monthly Program and Financial Data," U.S. Department of Labor (DOL), accessed June 2015, www.ows.doleta.gov/unemploy/claimssum.asp. Disbursements for state unemployment insurance totaled $34.9 billion in 2014. Return to text
19. Information about total payments made under Social Security programs was provided by the U.S. Treasury. Return to text
20. For calendar years 2012-14, the Board has consistently collected data on network-branded (for example, Visa and MasterCard) government-administered, general-use prepaid cards through the issuer survey. For the same period, the Board has also consistently collected information on SNAP disbursements from the U.S. Department of Agriculture's Food and Nutrition Service. Before the calendar year 2014 data collection, the Board did not obtain complete data on EBT WIC, and EBT cash-assistance programs and did not include these EBT programs in the year-over-year calculations for this report to ensure comparability across years. Return to text
21. "Unemployment Insurance Data," DOL, last modified June 18, 2015, http://workforcesecurity.doleta.gov/unemploy/data.asp. For this comparison, the number of unemployed beneficiaries includes beneficiaries of regular state unemployment compensation, as well as EUC and Extended Benefits. Return to text
22. 12 CFR 235.2(j). An interchange fee is any fee established, charged, or received by a payment card network and paid by a merchant or a merchant acquirer for the purpose of compensating an issuer for its involvement in an electronic debit transaction. Merchant acquirers typically pass the cost of these fees on to merchants. Interchange fees, in effect, are a cost to merchants and a source of revenue to issuers. Return to text
23. Incentive payments are payments received by an issuer from a payment card network with respect to debit card transactions or debit-card-related activity. Issuer incentives may be based on reaching specified volume levels, promoting the network's brand through marketing activities, converting the issuer's debit card base to a different signature network, or undertaking other activities. Incentive payments do not include payments from a network to an issuer for traditional banking services the issuer provides to the network (for example, transaction account services to the network). Issuers may also receive revenue from interest on program funds held in pooled bank accounts before the beneficiaries use them; however, the Board does not gather data on this source of revenue. Return to text
24. Consistent with previous reports, the Board calculated all revenue figures in this report using data collected through the issuer survey on the population of network-branded government-administered, general-use prepaid cards (excluding EBT cards). For EBT card programs, states generally pay an issuer or processor based on the number of beneficiaries enrolled in a program per month, in part, because there are no interchange fees associated with these card programs. Certain cardholder fees, such as a fee for card replacement, may also apply to EBT programs. Return to text
25. The Board added questions on revenue from payment card network incentive payments and fees assessed to government offices to the newly revised issuer survey. Because the Board did not collect information on these sources of revenue in previous years, the percentages of total revenue for each revenue type in the pie chart are not comparable with corresponding figures in previous reports. Return to text
26. In previous reports to the Congress on government-administered, general-use prepaid cards, the Board reported on interchange fee statistics broken out by network type (between transactions processed over single-message and dual-message networks). Interchange fee statistics for the broader population of debit cards by network type are published on the Board's website on Average Debit Card Interchange Fee by Payment Card Network. Because interchange fees by network type historically have not varied substantially between government-administered, general-use prepaid cards and the broader population of all exempt debit cards, the Board no longer collects information by network type in the issuer survey for this report. For more information, see "Regulation II (Debit Card Interchange Fees and Routing), Average Debit Card Interchange Fee by Payment Card Network," Board, last modified May 12, 2015, www.federalreserve.gov/paymentsystems/regii-average-interchange-fee.htm. Return to text
27. The pool of reported programs changes over time because government agencies may add or eliminate programs and may alter disbursement methods for existing programs. Return to text
28. See "Regulation II (Debit Card Interchange Fees and Routing), Average Debit Card Interchange Fee by Payment Card Network," Board, last modified May 12, 2015, www.federalreserve.gov/paymentsystems/regii-average-interchange-fee.htm. Government-administered, general-use prepaid card transactions constitute approximately 1.6 percent of all exempt transactions. Return to text
29. "Government-Administered, General-Use Prepaid Card Survey--Issuer Survey," FR 3063a, OMB No. 7100-0343, pp. 31-33, Board, www.federalreserve.gov/paymentsystems/files/FR3063a_government_issuer_survey_2014.pdf. Definitions of the various cardholder fees mentioned in this report are referenced. Because the Board made minor changes to some of the definitions of cardholder fees in the newly revised issuer survey, many of the cardholder fee metrics in this report are not comparable to corresponding metrics in previous reports. Return to text
30. 15 USC 1693o-2(a)(7)(B). Pursuant to section 920 (a)(7)(B) of the EFTA, the exemption from the interchange fee standards of Regulation II does not apply if, on or after July 21, 2012, the issuer may charge the cardholder an overdraft fee with respect to the card, or an ATM fee for the first withdrawal per calendar month from an ATM that is part of the issuer's network. Return to text
31. Issuers pay fees to ATM operators for each ATM cash withdrawal to compensate the operator for the costs of deploying and maintaining the ATMs and of providing cash services to the issuers' cardholders. Issuers pay fees to banks for each OTC cash withdrawal to compensate the bank for the costs of staffing the teller window and providing cash services to the issuers' cardholders. In addition to ATM and OTC fees, issuers pay fees to payment card networks (such as switch, license, and connectivity fees). The Board does not survey issuers of government-administered prepaid cards regarding network fees. Across all debit cards, issuers paid networks approximately 4.4 cents per transaction in 2014. For more information, see "Regulation II (Debit Card Interchange Fees and Routing), Average Debit Card Interchange Fee by Payment Card Network," Board, last modified May 12, 2015, www.federalreserve.gov/paymentsystems/regii-average-interchange-fee.htm. Return to text
32. On average, issuers paid approximately 40 cents per ATM cash withdrawal and $2.39 per OTC cash withdrawal in 2014. Because of limited data, the Board approximated the number of ATM and OTC withdrawals resulting in a fee. Therefore, the calculations of average ATM and OTC fees paid by issuers are estimates. Return to text


