

 Print
Print
Federal Reserve
BULLETIN
The 2013 Home Mortgage Disclosure Act Data
Sections of this Page
Note: This article was republished on September 3, 2015. Please see the Errata section.
The Home Mortgage Disclosure Act of 1975 (HMDA) requires most mortgage lending institutions with offices in metropolitan areas to disclose to the public detailed information about their home-lending activity each year. The HMDA data include the disposition of each application for mortgage credit; the type, purpose, and characteristics of each home mortgage that lenders originate or purchase during the calendar year; the census-tract designations of the properties related to those loans; loan pricing information; personal demographic and other information about loan applicants, including their race or ethnicity and income; and information about loan sales (see appendix A for a full list of items reported under HMDA).1
HMDA was enacted to help members of the public determine whether financial institutions are serving the housing needs of their local communities and treating borrowers and loan applicants fairly, provide information that could facilitate the efforts of public entities to distribute funds to local communities for the purpose of attracting private investment, and help households decide where they may want to deposit their savings.2 The data have proven to be valuable for research and are often used in public policy deliberations related to the mortgage market.3
The main objective of this article is to provide an overview of the 2013 HMDA data and
to help document mortgage market activity over time as captured in the HMDA data. Mortgage debt is by far the largest component of household debt in the United States, and mortgage transactions can have important implications for households' financial well-being. The HMDA data are the most comprehensive source of publicly available information on the U.S. mortgage market, providing unique details on how much mortgage credit gets extended each year, who obtains such credit, and which institutions provide such credit.
In 2013, economic and housing conditions continued to improve, with house prices rising significantly during the course of the year, particularly in areas where they had declined sharply during the recession. Mortgage interest rates, though still low by historical standards, increased about 1 percentage point during the year. While credit conditions still were tight going into 2014, some data, such as the Federal Reserve Board's Senior Loan Officer Opinion Survey on Bank Lending Practices, suggest that credit standards for prime mortgages may have eased somewhat in 2013.4 Finally, the new ability-to-repay and qualified mortgage standards, which generally require creditors to make a reasonable, good faith determination of a consumer's ability to repay any consumer credit transaction secured by a dwelling and establish certain protections from liability under this requirement for "qualified mortgages," may have influenced lending patterns to some extent in 2013, even though they did not take effect until January 2014.5
This article presents data since 2004 describing mortgage market activity and lending patterns, including the incidence of higher-priced or nonprime lending and rates of denial on mortgage applications, across different demographic groups and lender types.6 In addition, we use a unique data set composed of HMDA records matched to borrowers' credit records, introduced in last year's Federal Reserve Bulletin article on the topic, to reexamine the factors that might help explain the large differences in the incidence of higher-priced lending across borrowers of different races and ethnicities during the housing boom.7
Here are some of the key findings:
- The number of mortgage originations in 2013 declined 11 percent, to 8.7 million from 9.8 million in 2012. This decrease was led by a drop in refinance mortgages for one- to four-family properties, which fell by over 1.5 million, or 23 percent, likely because mortgage interest rates increased significantly during 2013. Partially offsetting the decrease in refinancing, one- to four-family home-purchase originations grew by almost 370,000, or 13 percent, from 2012. This increase came on the heels of a rise of similar magnitude in the previous year. Still, purchase originations in 2013 were low by historical standards, standing below levels as far back as 1993.
- The government-backed share of first-lien home-purchase loans for one- to four-family, owner-occupied, site-built properties (that is, the share of loans backed by insurance from the Federal Housing Administration (FHA) or by guarantees from the Department of Veterans Affairs (VA), the Farm Service Agency (FSA), or the Rural Housing Service (RHS)) stood at about 38 percent in 2013, down from 45 percent in 2012 and from a peak of 54 percent in 2009. This decline reflected a decrease in the FHA share of loans, while the VA and FSA/RHS shares have held steady since 2009. A series of increases, starting in 2010, in the mortgage insurance premiums (MIPs) that the FHA charges borrowers may have been one important reason for the falling share of FHA loans. The share of government-backed home-purchase loans declined across all population groups from 2012 to 2013. In 2013, at the high end, almost 71 percent of black home-purchase borrowers and 63 percent of Hispanic white home-purchase borrowers took out a nonconventional loan; at the low end, 16 percent of Asian home-purchase borrowers used nonconventional loans.
- After declines each year from 2005 through 2011, home-purchase originations for one- to four-family, owner-occupied, site-built properties grew significantly in 2012 and 2013. However, the degree of growth over these two years varied substantially across demographic groups. Loans to Asian and high-income borrowers have grown most quickly at 42 percent and 50 percent, respectively, while loans to black or African American and low- or moderate-income (LMI) borrowers have grown most slowly at just 12 percent and 7 percent, respectively.
- The higher-priced fraction of first-lien home-purchase loans for one- to four-family, owner-occupied, site-built properties (the fraction of loans with annual percentage rates (APRs) of at least 1.5 percentage points above the prime offer rate) more than doubled in 2013 from 2012, to about 7 percent. However, this increase was driven by a sharp jump in higher-priced FHA loans, as changes to the FHA's MIPs in 2013 (including lengthening the period over which the annual insurance premium is required to be paid) on top of the changes in previous years appear to have pushed the APRs on many FHA home-purchase loans just over the threshold of 150 basis points.
- We use a special data set composed of HMDA loan records matched to borrowers' credit records to help better understand why substantial differences exist in the incidence of higher-priced lending to different racial and ethnic groups. The HMDA data alone--with information on borrower income and loan amount--explain very little of these differences. The matched data provide information on borrowers' credit scores, and differences in scores across groups help explain a large portion of the differences in higher-priced lending. Some differences still remain after controlling for credit scores. The matched data do not contain some important risk characteristics (such as down-payment size or income documentation level), so we are unable to determine the extent to which the remaining discrepancies are attributable to these unobserved factors or discrimination.
Mortgage Applications and Originations
In 2013, 7,190 institutions reported data on nearly 14 million home mortgage applications (including about 1.9 million applications that were closed by the lender for incompleteness or were withdrawn by the applicant before a decision was made) that resulted in about 8.7 million originations. The number of originations in 2013 was down from 9.8 million originations in 2012 (table 1). (Data on the number of reporting institutions will be discussed in more detail in the section "Lending Institutions.")
| Characteristic of loan and of property |
2004 | 2005 | 2006 | 2007 | 2008 | 2009 | 2010 | 2011 | 2012 | 2013 |
|---|---|---|---|---|---|---|---|---|---|---|
| 1-4 Family | ||||||||||
| Home purchase | ||||||||||
| Applications | 9,804 | 11,685 | 10,929 | 7,609 | 5,060 | 4,217 | 3,848 | 3,650 | 4,025 | 4,554 |
| Originations | 6,437 | 7,391 | 6,740 | 4,663 | 3,139 | 2,793 | 2,547 | 2,430 | 2,743 | 3,112 |
| First lien, owner occupied | 4,789 | 4,964 | 4,429 | 3,454 | 2,628 | 2,455 | 2,218 | 2,073 | 2,344 | 2,680 |
| Site-built, conventional | 4,107 | 4,425 | 3,912 | 2,937 | 1,581 | 1,089 | 1,005 | 999 | 1,251 | 1,622 |
| Site-built, nonconventional | 553 | 411 | 386 | 394 | 951 | 1,302 | 1,151 | 1,019 | 1,034 | 993 |
| FHA share (percent) | 74.6 | 68.6 | 66.0 | 65.8 | 78.9 | 77.0 | 77.4 | 70.9 | 68.0 | 62.7 |
| VA share (percent) | 21.6 | 26.7 | 29.0 | 27.1 | 15.2 | 13.9 | 15.2 | 18.2 | 19.9 | 24.3 |
| FSA/RHS share (percent) | 3.9 | 4.7 | 5.0 | 7.1 | 5.9 | 9.0 | 7.4 | 10.9 | 12.1 | 13.0 |
| Manufactured, conventional | 106 | 100 | 101 | 95 | 68 | 43 | 44 | 40 | 44 | 51 |
| Manufactured, nonconventional | 24 | 27 | 30 | 29 | 28 | 21 | 17 | 15 | 14 | 14 |
| First lien, non-owner occupied | 857 | 1,053 | 880 | 607 | 412 | 292 | 285 | 314 | 355 | 385 |
| Junior lien, owner occupied | 738 | 1,224 | 1,269 | 552 | 93 | 44 | 42 | 41 | 43 | 45 |
| Junior lien, non-owner occupied | 53 | 150 | 162 | 50 | 6 | 2 | 2 | 1 | 1 | 1 |
| Refinance | ||||||||||
| Applications | 16,085 | 15,907 | 14,046 | 11,566 | 7,805 | 9,983 | 8,433 | 7,422 | 10,528 | 8,549 |
| Originations | 7,591 | 7,107 | 6,091 | 4,818 | 3,491 | 5,772 | 4,969 | 4,330 | 6,670 | 5,131 |
| First lien, owner occupied | 6,497 | 5,770 | 4,469 | 3,659 | 2,934 | 5,301 | 4,516 | 3,856 | 5,932 | 4,385 |
| Site-built, conventional | 6,115 | 5,541 | 4,287 | 3,407 | 2,363 | 4,264 | 3,835 | 3,315 | 4,972 | 3,628 |
| Site-built, nonconventional | 297 | 151 | 110 | 180 | 506 | 979 | 646 | 508 | 918 | 713 |
| FHA share (percent) | 68.3 | 77.3 | 87.5 | 91.5 | 92.2 | 83.7 | 79.3 | 63.2 | 61.2 | 61.1 |
| VA share (percent) | 31.4 | 22.4 | 12.3 | 8.3 | 7.6 | 15.9 | 20.3 | 35.9 | 37.8 | 37.7 |
| FSA/RHS share (percent) | .2 | .3 | .2 | .1 | .2 | .4 | .4 | .9 | .9 | 1.2 |
| Manufactured, conventional | 77 | 70 | 60 | 56 | 42 | 36 | 25 | 25 | 31 | 32 |
| Manufactured, nonconventional | 7 | 8 | 12 | 16 | 22 | 22 | 10 | 9 | 11 | 12 |
| First lien, non-owner occupied | 618 | 582 | 547 | 474 | 330 | 350 | 359 | 394 | 660 | 671 |
| Junior lien, owner occupied | 464 | 729 | 1,036 | 661 | 219 | 115 | 88 | 74 | 74 | 70 |
| Junior lien, non-owner occupied | 13 | 25 | 39 | 23 | 9 | 7 | 6 | 5 | 5 | 5 |
| Home improvement | ||||||||||
| Applications | 2,200 | 2,544 | 2,481 | 2,218 | 1,413 | 832 | 670 | 675 | 779 | 833 |
| Originations | 964 | 1,096 | 1,140 | 958 | 573 | 390 | 341 | 335 | 381 | 425 |
| Multifamily 1 | ||||||||||
| Applications | 61 | 58 | 52 | 54 | 43 | 26 | 26 | 35 | 47 | 51 |
| Originations | 48 | 45 | 40 | 41 | 31 | 19 | 19 | 27 | 37 | 40 |
| Total applications | 28,151 | 30,193 | 27,508 | 21,448 | 14,320 | 15,057 | 12,977 | 11,782 | 15,379 | 13,987 |
| Total originations | 15,040 | 15,638 | 14,011 | 10,480 | 7,234 | 8,974 | 7,876 | 7,122 | 9,831 | 8,707 |
| Memo | ||||||||||
| Purchased loans | 5,142 | 5,868 | 6,236 | 4,821 | 2,935 | 4,301 | 3,229 | 2,939 | 3,164 | 2,794 |
| Requests for preapproval 2 | 1,068 | 1,260 | 1,175 | 1,065 | 735 | 559 | 445 | 429 | 474 | 516 |
| Requests for preapproval that were approved but not acted on |
167 | 166 | 189 | 197 | 99 | 61 | 53 | 55 | 64 | 72 |
| Requests for preapproval that were denied |
171 | 231 | 222 | 235 | 177 | 155 | 117 | 130 | 149 | 163 |
Note: Components may not sum to totals because of rounding. Applications include those withdrawn and those closed for incompleteness. FHA is Federal Housing Administration; VA is U.S. Department of Veterans Affairs; FSA is Farm Service Agency; RHS is Rural Housing Service.
1. A multifamily property consists of five or more units. Return to table
2. Consists of all requests for preapproval. Preapprovals are not related to a specific property and thus are distinct from applications. Return to table
Source: Here and in subsequent tables and figures, except as noted, Federal Financial Institutions Examination Council, data reported under the Home Mortgage Disclosure Act (www.ffiec.gov/hmda).
Refinance mortgages for one- to four-family properties dropped by over 1.5 million, or 23 percent, from 2012 to 2013, as mortgage interest rates increased from historic lows during the year. According to Freddie Mac's Primary Mortgage Market Survey, the offer rate for prime conventional conforming mortgages increased from an average of 3.35 percent in December 2012 to 4.46 percent in December 2013.
In contrast to the decline in refinance activity, one- to four-family home-purchase originations grew by almost 370,000, or 13 percent, from 2012. Most one- to four-family home-purchase loans are first liens for owner-occupied properties. In the past two years, such loans have grown almost 30 percent, from nearly 2.1 million in 2011 to almost 2.7 million in 2013. Still, the volume of such purchase originations has not yet climbed back to the level observed as far back as 1993 (figure 1).8
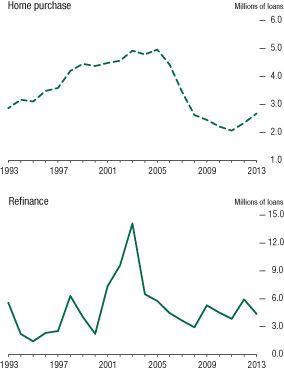
Note: Mortgage originations for one- to four-family owner-occupied properties, with junior-lien loans excluded in 2004 and later.
The number of first-lien home-purchase loans for non-owner-occupied properties--that is, purchases of rental properties or vacation and second homes--also increased in 2013, to 385,000 from 355,000 in 2012. But relative to its peak in 2005, the number of originations for non-owner-occupied properties is still about 63 percent lower.
The growth in first-lien home-purchase lending (including for both owner-occupied and non-owner-occupied properties) from 2012 to 2013 varied across the United States (figure 2). In several states, home-purchase lending increased over 20 percent. At the other end of the spectrum, in several states--including some states closely associated with the housing boom and bust, such as Nevada, California, and Arizona--home-purchase
loan growth was less than 10 percent.
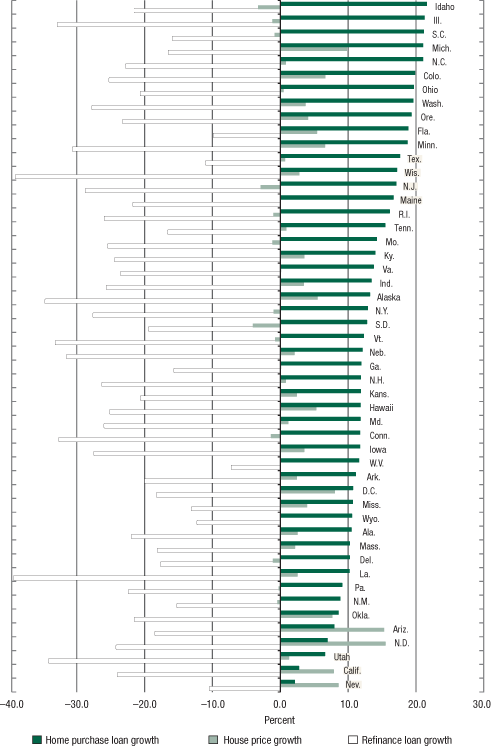
Note: First-lien mortgage originations for one- to four-family properties. House price growth is measured as the rate of change in the
Zillow Home Value Index for single-family residences from December 2011 to December 2012; house price growth data not available for Maine and Wyoming.
Source: FFIEC HMDA data; Zillow.
The decline in refinance lending also varied across the United States, but the magnitudes of these declines were not closely correlated with the strength of home-purchase loan growth, as suggested by figure 2. Finally, figure 2 also displays state-level home price growth from December 2011 to December 2012. Although positive trends in home prices could potentially spur both home-purchase and refinance loan growth, there does not appear to be a strong connection at the state level. For instance, home prices grew most strongly in Arizona and North Dakota, but these increases were not associated with relatively high rates of subsequent growth in home-purchase lending.
In addition to lien and occupancy status, the HMDA data provide details on the type of loan (conventional or not) and the type of property securing the loan (site-built or manufactured home).9 In table 1, the volume of first-lien lending for owner-occupied properties is further disaggregated by loan and property type. As shown, nonconventional, or government-backed, home-purchase loans for site-built properties declined slightly in 2013, while conventional loans increased about 30 percent. The nonconventional share of first-lien home-purchase loans for one- to four-family, owner-occupied, site-built properties stood at about 38 percent in 2013, down from 45 percent in 2012 and from its peak of 54 percent in 2009. That said, the nonconventional share remains above historically normal levels going back to 1993 (figure 3).
Nonconventional lending is more common among home-purchase loans and usually involves loans with high loan-to-value (LTV) ratios, offering investors mortgage insurance protection against losses due to borrower default. The analogue in the conventional market is insurance offered by private mortgage insurance (PMI) companies. In fact, PMI or some other credit enhancement is required by statute for loans with LTVs above 80 percent that are sold to the government-sponsored enterprises (GSEs) Fannie Mae and Freddie Mac. Another high-LTV alternative, frequently used during the housing boom, is for borrowers to obtain a junior-lien loan (a "piggyback" loan) alongside an 80 percent first lien to collectively finance more than 80 percent of the purchase price.10
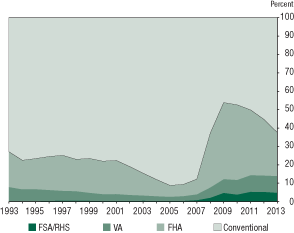
Note: Home-purchase mortgage originations for one- to four-family owner-occupied properties, with junior-lien loans excluded in 2004 and later. Nonconventional loans are those insured by the Federal Housing Administration (FHA) or backed by guarantees from the U.S. Department of Veterans Affairs (VA), the Farm Service Agency (FSA), or the Rural Housing Service (RHS).
The sharp rise in nonconventional lending after the financial crisis likely reflects reduced availability and relatively high prices for conventional high-LTV financing options, particularly for borrowers with less-than-excellent credit scores.11 Junior-lien home-purchase loans have been limited in recent years, with just 45,000 such loans in 2013, compared with over 550,000 in 2007 and nearly 1.3 million in 2006 (as shown in table 1).12 In addition, PMI issuance declined to historic lows by 2010 as PMI companies tightened standards and raised prices and the GSEs imposed additional fees for high-LTV loans (PMI data not shown in tables).13
As noted earlier and as shown in figure 3, the nonconventional share of home-purchase loans has been declining since 2009. Figure 3 also shows that the decline in the nonconventional share reflects a decrease in the FHA share of loans, while the VA and FSA/RHS shares have held steady since 2009. One factor that may help explain the reduction in the FHA share is a series of increases in the annual MIP that the FHA charges borrowers, which were implemented to help improve the financial health of the FHA. Between October 2010 and April 2013, the annual MIP for a typical home-purchase loan more than doubled from 0.55 percent of the loan amount to 1.35 percent.14 Also, in 2013, the FHA extended the period over which the annual MIP is required to be paid. For a typical home-purchase loan, the annual premium must now be paid over the life of the loan instead of until the LTV ratio falls below 78 percent. Although this change has no effect on the initial cost of the mortgage, it would change the potential longer-term cost if borrowers held the mortgage after the LTV ratio fell below 78 percent.
The remainder of table 1 provides additional details on the breakdown of one- to four-family home-purchase and refinance loans by lien and occupancy status and by property and loan type. Table 1 also provides the number of applications for and originations of home-improvement loans for one- to four-family properties, many of which are junior liens or unsecured, and total multifamily property (consisting of five or more units) applications and originations across all three loan purposes (home purchase, refinance, and home improvement). Finally, the HMDA data include details about preapproval requests for home-purchase loans and loans purchased by reporting institutions during the reporting year, although the purchased loans may have been originated at any point in time. Table 1 shows that, for 2013, lenders reported information on about 2.8 million loans that they had purchased from other institutions. Lenders also reported roughly 516,000 preapproval requests, including approved requests that turned into actual loan applications for specific properties.15
Mortgage Outcomes by Income and by Race and Ethnicity
Jump to:
A key attribute of the HMDA data is that they help policymakers and the broader public better understand the distribution of mortgage credit to different demographic groups. The next set of tables provides information on loan shares, product usage, denial rates, reasons for denial, and mortgage pricing for population groups defined by applicant income, neighborhood income, and applicant race and ethnicity (tables 2-6). These tables focus on first-lien home-purchase and refinance loans for one- to four-family, owner-occupied, site-built properties. As can be seen from table 1, such loans accounted for about 81 percent of all HMDA originations in 2013.
The Distribution of Home Loans across Demographic Groups
Table 2 shows different groups' shares of home-purchase and refinance loans and how these shares have changed over time. For example, black borrowers' share of home-purchase loans (conventional and nonconventional loans combined) was 4.8 percent in 2013, down from 5.1 percent in 2012 and from 8.7 percent in 2006. In contrast, the non-Hispanic white share of home-purchase loans was 70.2 percent in 2013, up slightly over 2012 and well above the 61.2 percent mark in 2006.
| Characteristic of borrower and of neighborhood |
2004 | 2005 | 2006 | 2007 | 2008 | 2009 | 2010 | 2011 | 2012 | 2013 |
|---|---|---|---|---|---|---|---|---|---|---|
| A. Home purchase | ||||||||||
| Borrower race and ethnicity 1 | ||||||||||
| Asian | 4.8 | 5.0 | 4.5 | 4.5 | 4.9 | 5.3 | 5.5 | 5.2 | 5.3 | 5.7 |
| Black or African American | 7.1 | 7.7 | 8.7 | 7.6 | 6.3 | 5.7 | 6.0 | 5.5 | 5.1 | 4.8 |
| Other minority 2 | 1.4 | 1.3 | 1.1 | 1.0 | .9 | .9 | .9 | .8 | .8 | .7 |
| Hispanic white | 7.6 | 10.5 | 11.7 | 9.0 | 7.9 | 8.0 | 8.1 | 8.3 | 7.7 | 7.3 |
| Non-Hispanic white | 57.1 | 61.7 | 61.2 | 65.4 | 67.5 | 67.9 | 67.6 | 68.7 | 69.9 | 70.2 |
| Joint | 2.3 | 2.3 | 2.3 | 2.5 | 2.8 | 2.8 | 2.7 | 2.8 | 2.9 | 3.1 |
| Missing | 19.8 | 11.5 | 10.5 | 10.1 | 9.6 | 9.3 | 9.1 | 8.6 | 8.3 | 8.2 |
| All | 100 | 100 | 100 | 100 | 100 | 100 | 100 | 100 | 100 | 100 |
| Borrower income 3 | ||||||||||
| Low or moderate | 27.7 | 24.6 | 23.6 | 24.7 | 28.1 | 36.7 | 35.5 | 34.4 | 33.4 | 28.4 |
| Middle | 26.9 | 25.7 | 24.7 | 25.2 | 27.1 | 26.7 | 25.6 | 25.2 | 25.2 | 25.2 |
| High | 41.4 | 45.5 | 46.7 | 47.0 | 43.1 | 34.7 | 37.4 | 38.8 | 40.0 | 44.8 |
| Income not used or not applicable | 4.0 | 4.2 | 5.0 | 3.1 | 1.8 | 1.8 | 1.4 | 1.5 | 1.5 | 1.5 |
| All | 100 | 100 | 100 | 100 | 100 | 100 | 100 | 100 | 100 | 100 |
| Neighborhood income 4 | ||||||||||
| Low or moderate | 14.5 | 15.1 | 15.7 | 14.4 | 13.1 | 12.6 | 12.1 | 10.8 | 12.8 | 12.7 |
| Middle | 48.7 | 49.2 | 49.5 | 49.6 | 49.8 | 50.2 | 49.4 | 48.6 | 43.6 | 43.7 |
| High | 35.8 | 34.7 | 33.7 | 35.1 | 35.9 | 35.8 | 37.7 | 38.6 | 43.2 | 43.2 |
| All | 100 | 100 | 100 | 100 | 100 | 100 | 100 | 100 | 100 | 100 |
| B. Refinance | ||||||||||
| Borrower race and ethnicity1 | ||||||||||
| Asian | 3.5 | 2.9 | 3.0 | 3.1 | 3.1 | 4.1 | 5.2 | 5.4 | 5.5 | 4.7 |
| Black or African American | 7.4 | 8.3 | 9.6 | 8.4 | 6.0 | 3.5 | 2.9 | 3.1 | 3.3 | 4.4 |
| Other minority2 | 1.4 | 1.4 | 1.3 | 1.1 | .8 | .6 | .5 | .6 | .6 | .7 |
| Hispanic white | 6.2 | 8.6 | 10.1 | 8.7 | 5.3 | 3.2 | 3.0 | 3.3 | 3.9 | 5.0 |
| Non-Hispanic white | 57.2 | 60.9 | 59.6 | 62.7 | 70.7 | 74.6 | 74.3 | 73.5 | 72.5 | 70.5 |
| Joint | 2.1 | 2.1 | 1.9 | 2.0 | 2.2 | 2.6 | 2.7 | 2.8 | 3.1 | 3.1 |
| Missing | 22.1 | 15.7 | 14.6 | 14.1 | 11.9 | 11.4 | 11.4 | 11.3 | 11.1 | 11.6 |
| All | 100 | 100 | 100 | 100 | 100 | 100 | 100 | 100 | 100 | 100 |
| Borrower income3 | ||||||||||
| Low or moderate | 26.2 | 25.5 | 24.7 | 23.3 | 23.5 | 19.6 | 19.0 | 19.2 | 19.6 | 21.1 |
| Middle | 26.3 | 26.8 | 26.1 | 25.6 | 25.5 | 22.5 | 22.5 | 21.3 | 21.8 | 21.7 |
| High | 38.8 | 40.8 | 43.7 | 46.1 | 44.8 | 45.8 | 49.6 | 48.1 | 47.7 | 46.3 |
| Income not used or not applicable | 8.6 | 6.9 | 5.4 | 4.9 | 6.2 | 12.1 | 8.9 | 11.4 | 10.9 | 10.8 |
| All | 100 | 100 | 100 | 100 | 100 | 100 | 100 | 100 | 100 | 100 |
| Neighborhood income4 | ||||||||||
| Low or moderate | 15.3 | 16.5 | 17.9 | 16.1 | 11.9 | 7.7 | 7.2 | 7.3 | 10.1 | 12.1 |
| Middle | 50.0 | 51.3 | 52.0 | 52.2 | 51.9 | 47.5 | 46.1 | 45.5 | 41.9 | 43.8 |
| High | 33.9 | 31.6 | 29.4 | 31.0 | 35.2 | 43.5 | 46.0 | 45.6 | 47.6 | 43.9 |
| All | 100 | 100 | 100 | 100 | 100 | 100 | 100 | 100 | 100 | 100 |
| Memo | ||||||||||
| Number of home-purchase loans (thousands) | 4,660 | 4,836 | 4,298 | 3,331 | 2,533 | 2,391 | 2,157 | 2,018 | 2,286 | 2,615 |
| Number of refinance loans (thousands) | 6,412 | 5,692 | 4,397 | 3,588 | 2,869 | 5,243 | 4,481 | 3,823 | 5,890 | 4,341 |
Note: First-lien mortgages for one- to four-family family, owner-occupied, site-built homes. Rows may not sum to 100 because of rounding or, for the distribution by neighborhood income, because property location is missing.
1. Applications are placed in one category for race and ethnicity. The application is designated as joint if one applicant was reported as white and the other was reported as one or more minority races or if the application is designated as white with one Hispanic applicant and one non-Hispanic applicant. If there are two applicants and each reports a different minority race, the application is designated as two or more minority races. If an applicant reports two races and one is white, that applicant is categorized under the minority race. Otherwise, the applicant is categorized under the first race reported. "Missing" refers to applications in which the race of the applicant(s) has not been reported or is not applicable or the application is categorized as white but ethnicity has not been reported. Return to table
2. Consists of applications by American Indians or Alaska Natives, Native Hawaiians or other Pacific Islanders, and borrowers reporting two or more minority races. Return to table
3. The categories for the borrower-income group are as follows: Low- or moderate-income (or LMI) borrowers have income that is less than 80 percent of estimated contemporaneous area median family income (AMFI), middle-income borrowers have income that is at least 80 percent and less than 120 percent of AMFI, and high-income borrowers have income that is at least 120 percent of AMFI. Return to table
4. The categories for the neighborhood-income group are based on the ratio of census-tract median family income to area median family income from the 2006-10 American Community Survey data for 2012 and 2013 and from the 2000 census for 2004-11, and the three categories have the same cutoffs as the borrower-income groups (see note 3). Return to table
The bottom of the table provides the total loan counts for each year, and thus the number of loans to a given group in a given year can be easily derived.16 From 2011 to 2013, the total number of home-purchase loans increased about 30 percent, from about 2 million to about 2.6 million, but the rate of growth varied significantly for different groups. Home-purchase loans to Asian borrowers grew most quickly at about 42 percent, while those to black borrowers grew least quickly at just under 12 percent.
In terms of borrower income, the share of home-purchase loans to LMI borrowers declined significantly in 2013 from 2012, from 33.4 percent to 28.4 percent.17 In fact, the number of loans to LMI borrowers declined slightly from 2012 despite growth in the overall number of home-purchase loans.
From 2012 to 2013, home-purchase loan shares by neighborhood or census-tract income group held steady.18 It is important to note that shares by neighborhood in 2012 and 2013 are not perfectly comparable to those in 2011 and earlier because census-tract definitions and census-tract median family income estimates were revised in 2012 based on 2010 census data and 2006-10 American Community Survey data, whereas the 2004-11 data relied on 2000 census income and population data.19
In contrast to home-purchase lending, shares of refinance loans to black and Hispanic-white borrowers and to LMI borrowers have risen in the past two years. While overall refinance lending declined between 2012 and 2013 from 5.9 million loans to 4.3 million loans, the number of refinance loans to black and Hispanic-white borrowers nearly held steady.
Variation across Demographic Groups in Nonconventional Loan Use
Table 3 shows that black and Hispanic-white borrowers are much more likely to use nonconventional loans than conventional loans compared with other racial and ethnic groups. In 2013, almost 71 percent of black home-purchase borrowers and 63 percent of Hispanic white home-purchase borrowers took out a nonconventional loan, compared with about 35 percent of non-Hispanic white home-purchase borrowers and just 16 percent of Asian home-purchase borrowers. These numbers have declined from their peaks in 2009 and 2010, when over three-fourths of black and Hispanic-white home-purchase borrowers and over one-half of non-Hispanic white home-purchase borrowers took out nonconventional loans.
Nonconventional usage also rises as borrower and neighborhood income falls. In 2013, the majority of home-purchase borrowers and about 50 percent of those borrowing to purchase homes in LMI neighborhoods used nonconventional loans, compared with about one-fourth of high-income borrowers and 28 percent of borrowers in high-income neighborhoods.
Greater reliance on nonconventional loans may reflect the relatively low down-payment requirements of the FHA and VA lending programs, which serve the needs of borrowers who have few assets to meet down-payment and closing-cost requirements.20 The patterns of product incidence could also reflect the behavior of lenders to some extent; for example, concerns have been raised about the possibility that lenders steer borrowers in certain neighborhoods toward government-backed loans.21
With respect to refinance loans, minority and lower-income borrowers are again more likely to use nonconventional than conventional loans. But, in general, nonconventional loans are less prevalent in refinance lending.22
| Characteristic of borrower and of neighborhood | 2004 | 2005 | 2006 | 2007 | 2008 | 2009 | 2010 | 2011 | 2012 | 2013 |
|---|---|---|---|---|---|---|---|---|---|---|
| A. Home purchase | ||||||||||
| Borrower race and ethnicity 1 | ||||||||||
| Asian | 2.9 | 1.8 | 2.1 | 2.6 | 13.4 | 26.1 | 26.6 | 25.8 | 21.9 | 16.0 |
| Black or African American | 21.7 | 14.3 | 13.6 | 21.7 | 64.1 | 82.0 | 82.9 | 80.3 | 77.3 | 70.6 |
| Other minority 2 | 14.0 | 9.3 | 9.4 | 14.8 | 48.4 | 67.6 | 68.8 | 65.9 | 62.3 | 55.3 |
| Hispanic white | 13.7 | 7.5 | 7.0 | 12.4 | 51.4 | 75.4 | 77.0 | 74.1 | 70.6 | 62.8 |
| Non-Hispanic white | 11.1 | 8.9 | 9.5 | 11.5 | 35.4 | 52.0 | 50.3 | 47.4 | 42.2 | 35.3 |
| Joint | 16.9 | 12.8 | 14.4 | 17.2 | 46.4 | 59.4 | 56.3 | 53.6 | 48.9 | 41.8 |
| Missing | 11.3 | 5.1 | 5.7 | 8.8 | 32.7 | 50.6 | 49.4 | 45.9 | 39.5 | 31.9 |
| Borrower income 3 | ||||||||||
| Low or moderate | 20.3 | 15.2 | 14.9 | 16.0 | 46.1 | 65.3 | 66.6 | 64.5 | 59.8 | 52.3 |
| Middle | 14.3 | 11.0 | 12.6 | 16.8 | 46.1 | 60.4 | 59.3 | 57.0 | 51.5 | 45.5 |
| High | 5.3 | 3.9 | 4.9 | 7.5 | 26.7 | 38.5 | 37.2 | 34.3 | 29.6 | 25.0 |
| Neighborhood income 4 | ||||||||||
| Low or moderate | 15.8 | 9.7 | 9.6 | 13.8 | 45.5 | 64.4 | 65.1 | 61.1 | 57.9 | 49.6 |
| Middle | 14.1 | 10.2 | 10.8 | 14.2 | 42.7 | 59.8 | 59.4 | 56.9 | 52.1 | 44.5 |
| High | 7.1 | 5.4 | 6.1 | 7.6 | 27.4 | 43.4 | 42.0 | 39.4 | 34.7 | 28.0 |
| Memo: All borrowers | 11.9 | 8.5 | 9.0 | 11.8 | 37.6 | 54.4 | 53.4 | 50.5 | 45.2 | 38.0 |
| B. Refinance | ||||||||||
| Borrower race and ethnicity1 | ||||||||||
| Asian | 1.2 | .7 | .6 | 1.0 | 4.6 | 5.7 | 4.7 | 4.3 | 6.0 | 6.7 |
| Black or African American | 11.1 | 5.8 | 4.4 | 10.2 | 39.2 | 53.8 | 42.0 | 37.8 | 38.7 | 37.0 |
| Other minority2 | 5.5 | 3.4 | 2.4 | 4.9 | 20.0 | 28.3 | 23.3 | 21.9 | 25.5 | 24.9 |
| Hispanic white | 5.6 | 2.6 | 1.9 | 3.9 | 20.5 | 36.2 | 28.1 | 22.9 | 26.9 | 25.7 |
| Non-Hispanic white | 4.0 | 2.4 | 2.6 | 4.9 | 15.9 | 16.8 | 13.6 | 12.2 | 14.2 | 14.8 |
| Joint | 7.5 | 3.7 | 3.4 | 6.2 | 19.5 | 21.1 | 16.6 | 16.3 | 20.1 | 20.4 |
| Missing | 4.2 | 1.9 | 1.7 | 4.1 | 18.7 | 19.0 | 12.5 | 13.6 | 16.5 | 16.8 |
| Borrower income3 | ||||||||||
| Low or moderate | 2.3 | 1.6 | 2.9 | 5.7 | 18.3 | 16.6 | 14.0 | 11.5 | 9.3 | 9.4 |
| Middle | 1.7 | 1.3 | 2.7 | 6.2 | 19.6 | 13.2 | 12.2 | 10.9 | 9.0 | 9.6 |
| High | .8 | .6 | 1.1 | 2.7 | 10.5 | 7.2 | 6.7 | 6.3 | 5.5 | 6.2 |
| Neighborhood income4 | ||||||||||
| Low or moderate | 5.9 | 3.2 | 2.9 | 6.3 | 24.6 | 31.3 | 23.1 | 19.6 | 22.2 | 22.1 |
| Middle | 5.2 | 3.0 | 2.9 | 5.8 | 20.2 | 22.3 | 17.5 | 16.0 | 18.4 | 18.9 |
| High | 2.9 | 1.7 | 1.6 | 3.0 | 11.3 | 12.1 | 10.0 | 9.3 | 11.7 | 12.4 |
| Memo: All borrowers | 4.6 | 2.6 | 2.5 | 5.0 | 17.6 | 18.7 | 14.4 | 13.3 | 15.6 | 16.4 |
Note: First-lien mortgages for one- to four-family, owner-occupied, site-built homes. Nonconventional loans are those insured by the Federal Housing Administration or backed by guarantees from the U.S. Department of Veterans Affairs, the Farm Service Agency, or the Rural Housing Service.
1. See table 2, note 1. Return to table
2. See table 2, note 2. Return to table
3. See table 2, note 3. Return to table
4. See table 2, note 4. Return to table
Denial Rates and Denial Reasons
In 2013, the overall denial rate on applications for home-purchase loans of 14.5 percent was about the same as in 2012, while the denial rate for refinance loan applications of 22.7 percent was somewhat higher than in 2012 (as shown in table 4).23 Over longer horizons, denial rates have exhibited significant variation. For example, the denial rate for conventional home-purchase loan applications of about 13 percent in 2013 was almost 6 percentage points lower than in 2006, while the denial rate for nonconventional home-purchase loan applications of 17 percent in 2013 was about 5 percentage points higher than in 2006. Changes in raw denial rates over time reflect not only changes in credit standards, but also changes in the demand for credit and in the composition of borrowers applying for mortgages. For example, the significant decline in the denial rate on applications for conventional home-purchase loans since the housing boom years despite tightened credit standards could stem from a relatively large drop in applications from riskier applicants.
| Type of loan and race and ethnicity of borrower |
2004 | 2005 | 2006 | 2007 | 2008 | 2009 | 2010 | 2011 | 2012 | 2013 |
|---|---|---|---|---|---|---|---|---|---|---|
| A. Home purchase | ||||||||||
| Conventional and nonconventional 1 | ||||||||||
| All applicants | 14.4 | 16.0 | 18.0 | 18.7 | 18.0 | 15.5 | 15.6 | 15.8 | 14.8 | 14.5 |
| Asian | 13.7 | 15.9 | 16.9 | 17.5 | 19.2 | 16.3 | 15.8 | 16.5 | 15.7 | 15.1 |
| Black or African American | 23.6 | 26.5 | 30.3 | 33.5 | 30.6 | 25.5 | 24.8 | 26.0 | 25.9 | 25.5 |
| Other minority 2 | 19.4 | 20.8 | 24.0 | 26.7 | 25.5 | 21.2 | 21.9 | 20.9 | 20.7 | 21.5 |
| Hispanic white | 18.3 | 21.1 | 25.1 | 29.5 | 28.3 | 22.2 | 21.8 | 21.1 | 20.2 | 20.5 |
| Non-Hispanic white | 11.1 | 12.2 | 12.9 | 13.3 | 14.0 | 12.8 | 12.9 | 13.1 | 12.4 | 12.2 |
| Conventional only | ||||||||||
| All applicants | 14.6 | 16.3 | 18.5 | 19.0 | 18.3 | 15.8 | 15.2 | 15.1 | 13.6 | 12.9 |
| Asian | 13.7 | 16.0 | 17.1 | 17.5 | 19.1 | 15.8 | 14.8 | 15.5 | 14.4 | 13.9 |
| Black or African American | 25.0 | 27.8 | 31.9 | 35.7 | 37.6 | 35.8 | 33.6 | 33.2 | 32.1 | 28.5 |
| Other minority2 | 19.7 | 21.2 | 24.8 | 27.8 | 29.0 | 25.9 | 28.0 | 24.6 | 23.7 | 22.6 |
| Hispanic white | 18.6 | 21.4 | 25.7 | 30.5 | 32.5 | 26.9 | 24.9 | 24.2 | 22.4 | 21.5 |
| Non-Hispanic white | 11.2 | 12.3 | 13.2 | 13.3 | 14.1 | 13.3 | 12.9 | 12.7 | 11.6 | 10.9 |
| Nonconventional only1 | ||||||||||
| All applicants | 13.3 | 12.5 | 12.1 | 16.2 | 17.4 | 15.3 | 16.0 | 16.5 | 16.3 | 17.0 |
| Asian | 12.6 | 11.6 | 10.6 | 15.5 | 20.2 | 17.7 | 18.6 | 19.3 | 20.2 | 20.7 |
| Black or African American | 17.7 | 16.8 | 16.2 | 22.8 | 25.3 | 22.6 | 22.7 | 23.9 | 23.9 | 24.2 |
| Other minority2 | 16.8 | 16.3 | 15.2 | 18.6 | 20.9 | 18.7 | 18.7 | 18.8 | 18.8 | 20.5 |
| Hispanic white | 16.3 | 17.2 | 15.7 | 20.5 | 23.1 | 20.4 | 20.7 | 19.9 | 19.2 | 20.0 |
| Non-Hispanic white | 10.7 | 10.2 | 10.0 | 13.1 | 13.9 | 12.5 | 13.0 | 13.6 | 13.6 | 14.4 |
| B. Refinance | ||||||||||
| Conventional and nonconventional1 | ||||||||||
| All applicants | 29.5 | 32.6 | 35.4 | 39.6 | 37.7 | 24.0 | 23.3 | 23.8 | 19.8 | 22.7 |
| Asian | 18.8 | 23.5 | 27.5 | 32.6 | 32.5 | 21.4 | 19.5 | 20.1 | 17.4 | 20.5 |
| Black or African American | 39.9 | 42.2 | 44.1 | 52.0 | 56.0 | 42.2 | 41.7 | 40.0 | 32.8 | 33.9 |
| Other minority2 | 33.7 | 35.5 | 40.6 | 52.0 | 57.4 | 37.3 | 35.3 | 34.4 | 30.0 | 30.5 |
| Hispanic white | 28.7 | 30.1 | 33.2 | 43.0 | 49.1 | 36.4 | 33.4 | 33.2 | 27.4 | 28.7 |
| Non-Hispanic white | 24.1 | 26.9 | 30.1 | 33.7 | 32.2 | 20.7 | 20.6 | 21.3 | 17.7 | 20.0 |
| Conventional only | ||||||||||
| All applicants | 30.1 | 32.9 | 35.6 | 39.9 | 37.0 | 22.1 | 21.3 | 22.3 | 19.3 | 22.0 |
| Asian | 18.8 | 23.5 | 27.5 | 32.5 | 31.5 | 20.2 | 18.5 | 19.4 | 17.0 | 20.0 |
| Black or African American | 41.7 | 43.0 | 44.7 | 53.3 | 60.9 | 48.6 | 41.4 | 40.6 | 34.7 | 35.1 |
| Other minority2 | 34.5 | 35.7 | 40.9 | 52.6 | 59.4 | 38.4 | 34.8 | 34.4 | 31.1 | 31.0 |
| Hispanic white | 29.3 | 30.2 | 33.3 | 43.2 | 50.2 | 38.9 | 33.6 | 33.5 | 28.9 | 29.8 |
| Non-Hispanic white | 24.6 | 27.1 | 30.4 | 33.9 | 31.5 | 19.1 | 18.9 | 20.1 | 17.4 | 19.4 |
| Nonconventional only1 | ||||||||||
| All applicants | 15.0 | 20.1 | 21.9 | 31.6 | 40.9 | 31.1 | 33.3 | 32.2 | 22.1 | 25.9 |
| Asian | 15.0 | 20.0 | 22.0 | 38.5 | 48.9 | 37.2 | 34.2 | 32.7 | 22.1 | 26.1 |
| Black or African American | 17.5 | 23.6 | 24.6 | 33.7 | 43.5 | 35.1 | 42.2 | 39.1 | 29.4 | 31.6 |
| Other minority2 | 15.2 | 25.8 | 22.2 | 34.8 | 45.4 | 34.1 | 37.0 | 34.4 | 26.6 | 28.9 |
| Hispanic white | 15.7 | 23.6 | 26.3 | 34.6 | 43.4 | 31.4 | 33.0 | 32.3 | 23.2 | 25.4 |
| Non-Hispanic white | 12.0 | 17.6 | 19.7 | 28.3 | 36.1 | 27.4 | 29.3 | 29.0 | 19.6 | 23.0 |
Note: First-lien mortgages for one- to four-family, owner-occupied, site-built homes. For a description of how borrowers are categorized by race and ethnicity, see table 2, note 1.
1. Nonconventional loans are those insured by the Federal Housing Administration or backed by guarantees from the U.S. Department of Veterans Affairs, the Farm Service Agency, or the Rural Housing Service. Return to table
2. See table 2, note 2. Return to table
As in past years, black, Hispanic white, and "other minority" borrowers had notably higher denial rates in 2013 than non-Hispanic whites, while denial rates for Asian borrowers were more similar to those for non-Hispanic white borrowers. For example, the denial rates for conventional home-purchase loans were about 29 percent for blacks, 22 percent for Hispanic whites, 23 percent for other minorities, 14 percent for Asians, and 11 percent for non-Hispanic whites.
Previous research and experience gained in the fair lending enforcement process show that differences in denial rates and in the incidence of higher-priced lending (the topic of the next subsection) among racial or ethnic groups stem, at least in part, from credit-risk-related factors not available in the HMDA data, such as credit history (including credit scores) and LTV ratios. Differential costs of loan origination and the competitive environment also may bear on the differences in pricing, as may differences across populations in credit-shopping activities.
Despite these limitations, the HMDA data play an important role in fair lending enforcement. The data are regularly used by bank examiners to facilitate the fair lending examination and enforcement processes. When examiners for the federal banking agencies evaluate an institution's fair lending risk, they analyze HMDA price data and loan application outcomes in conjunction with other information and risk factors that can be drawn directly from loan files or electronic records maintained by lenders, as directed by the Interagency Fair Lending Examination Procedures.24 The availability of broader information allows the examiners to draw stronger conclusions about institution compliance with the fair lending laws.
Lenders can, but are not required to, report up to three reasons for denying a mortgage application, selecting from nine potential denial reasons (as shown in table 5). Among denied first-lien applications for one- to four-family, owner-occupied, site-built properties in 2013, 79 percent of home-purchase applications and about 77 percent of refinance applications had at least one reported denial reason. The most frequently cited denial reason for both home-purchase and refinance loans was the applicant's credit history (note that the columns in table 5 can add up to more than 100 percent because lenders can cite more than one denial reason). For home-purchase applications, the second-most-cited denial reason was the debt-to-income ratio, while, for refinance applications, the second-most-cited denial reason was collateral. For both home-purchase and refinance applications, collateral is more likely to be cited as a denial reason on conventional than nonconventional applications.
Denial reasons vary across racial and ethnic groups to some degree. For example, among denied home-purchase loan applications in 2013, credit history was cited as a denial reason for 30 percent of black applicants, 21 percent of Hispanic white applicants, 23 percent of non-Hispanic white applicants, and just 13 percent of Asian applicants. The debt-to-income ratio was cited most often as a denial reason for Asian home-purchase applicants at 27 percent, compared with 21 percent for non-Hispanic white applicants at the lower end. Finally, collateral was cited most often as a denial reason on home-purchase applications for non-Hispanic whites at 15 percent, compared with 10 percent for black applicants.
| Type of loan and race and ethnicity of borrower |
Debt-to- income ratio |
Employ- ment history |
Credit history |
Collateral | Insuf- ficient cash |
Unveri- fiable infor- mation |
Credit applica- tion incom- plete |
Mortgage insurance denied |
Other | No reason given |
|---|---|---|---|---|---|---|---|---|---|---|
| A. Home purchase | ||||||||||
| Conventional and nonconventional 1 | ||||||||||
| All applicants | 22.1 | 3.7 | 22.9 | 14.1 | 6.3 | 5.9 | 11.2 | .8 | 10.3 | 21.0 |
| Asian | 27.2 | 4.8 | 13.4 | 14.3 | 6.9 | 9.1 | 15.1 | .6 | 12.3 | 15.9 |
| Black or African American | 23.9 | 2.7 | 30.0 | 10.3 | 6.8 | 4.8 | 8.1 | .6 | 9.9 | 23.1 |
| Other minority 2 | 23.1 | 3.4 | 27.7 | 11.5 | 6.7 | 5.9 | 9.4 | .8 | 9.4 | 22.2 |
| Hispanic white | 24.7 | 3.8 | 20.5 | 12.6 | 6.6 | 6.3 | 8.5 | .6 | 11.0 | 24.5 |
| Non-Hispanic white | 21.0 | 3.9 | 22.5 | 15.4 | 6.1 | 5.6 | 11.6 | .9 | 10.1 | 20.8 |
| Conventional only | ||||||||||
| All applicants | 22.1 | 3.2 | 21.7 | 16.4 | 6.8 | 6.2 | 12.2 | 1.3 | 10.1 | 19.1 |
| Asian | 26.3 | 4.4 | 11.9 | 15.4 | 7.1 | 9.4 | 16.5 | .8 | 12.6 | 14.9 |
| Black or African American | 22.6 | 2.1 | 36.3 | 12.3 | 7.4 | 4.1 | 7.0 | 1.6 | 9.3 | 20.4 |
| Other minority2 | 22.8 | 2.7 | 30.5 | 12.2 | 7.2 | 5.9 | 8.6 | 1.4 | 8.9 | 21.8 |
| Hispanic white | 24.2 | 3.3 | 22.5 | 15.6 | 7.6 | 7.0 | 8.8 | 1.3 | 10.9 | 20.6 |
| Non-Hispanic white | 21.5 | 3.3 | 20.8 | 17.6 | 6.7 | 6.0 | 12.4 | 1.4 | 9.5 | 19.3 |
| Nonconventional only1 | ||||||||||
| All applicants | 22.1 | 4.4 | 24.3 | 11.4 | 5.6 | 5.4 | 10.0 | .2 | 10.6 | 23.3 |
| Asian | 30.3 | 5.9 | 18.5 | 10.7 | 6.3 | 8.0 | 10.4 | .05 | 11.3 | 19.3 |
| Black or African American | 24.6 | 2.9 | 26.6 | 9.2 | 6.4 | 5.1 | 8.7 | .1 | 10.2 | 24.5 |
| Other minority2 | 23.4 | 4.0 | 25.1 | 10.8 | 6.2 | 6.0 | 10.2 | .2 | 9.9 | 22.6 |
| Hispanic white | 25.1 | 4.2 | 19.1 | 10.5 | 6.0 | 5.9 | 8.3 | .1 | 11.0 | 27.1 |
| Non-Hispanic white | 20.4 | 4.7 | 24.8 | 12.3 | 5.2 | 5.2 | 10.5 | .2 | 10.8 | 22.8 |
| B. Refinance | ||||||||||
| Conventional and nonconventional1 | ||||||||||
| All applicants | 16.6 | 1.1 | 20.3 | 18.6 | 3.4 | 4.8 | 12.4 | .2 | 11.5 | 23.1 |
| Asian | 26.0 | 1.8 | 14.5 | 16.3 | 3.5 | 8.2 | 14.2 | .3 | 13.0 | 16.6 |
| Black or African American | 13.2 | .6 | 25.8 | 15.6 | 4.4 | 3.7 | 10.7 | .2 | 12.5 | 25.6 |
| Other minority2 | 18.2 | 1.0 | 23.2 | 15.3 | 3.6 | 5.5 | 12.0 | .2 | 13.2 | 21.2 |
| Hispanic white | 19.7 | 1.2 | 21.8 | 13.6 | 4.2 | 6.0 | 11.2 | .2 | 14.0 | 21.6 |
| Non-Hispanic white | 16.9 | 1.2 | 18.8 | 20.4 | 3.4 | 4.8 | 12.7 | .3 | 11.2 | 22.7 |
| Conventional only | ||||||||||
| All applicants | 18.9 | 1.2 | 21.1 | 19.6 | 3.0 | 5.1 | 13.1 | .3 | 11.3 | 19.7 |
| Asian | 27.4 | 1.9 | 14.5 | 16.8 | 3.3 | 8.4 | 14.5 | .3 | 12.7 | 15.1 |
| Black or African American | 16.4 | .6 | 28.5 | 16.4 | 3.5 | 3.7 | 11.6 | .3 | 11.1 | 21.6 |
| Other minority2 | 21.3 | 1.1 | 24.5 | 15.8 | 3.0 | 6.0 | 12.6 | .3 | 12.4 | 17.8 |
| Hispanic white | 22.4 | 1.2 | 22.8 | 14.6 | 3.2 | 6.1 | 11.6 | .3 | 12.8 | 19.6 |
| Non-Hispanic white | 18.9 | 1.3 | 19.3 | 21.3 | 3.1 | 5.0 | 13.4 | .3 | 10.9 | 19.6 |
| Nonconventional only1 | ||||||||||
| All applicants | 7.5 | .8 | 17.2 | 14.7 | 5.0 | 3.7 | 9.8 | .04 | 12.7 | 36.6 |
| Asian | 12.1 | 1.2 | 15.4 | 12.1 | 5.6 | 6.3 | 10.8 | .1 | 16.0 | 31.4 |
| Black or African American | 6.8 | .5 | 20.5 | 13.8 | 6.3 | 3.6 | 9.1 | .03 | 15.3 | 33.6 |
| Other minority2 | 7.9 | .6 | 18.7 | 13.7 | 5.6 | 3.8 | 10.1 | .1 | 16.0 | 32.6 |
| Hispanic white | 10.3 | 1.0 | 18.2 | 10.4 | 7.7 | 5.5 | 9.7 | .02 | 18.2 | 28.7 |
| Non-Hispanic white | 7.7 | .9 | 16.1 | 16.1 | 4.7 | 3.7 | 9.9 | .04 | 12.6 | 36.4 |
Note: Denials on first-lien mortgage applications for one- to four-family, owner-occupied, site-built homes. Columns sum to more than 100 because lenders may report up to three denial reasons. For a description of how borrowers are categorized by race and ethnicity, see table 2, note 1.
1. See table 4, note 1. Return to table
2. See table 2, note 2. Return to table
The Incidence of Higher-Priced Lending
Current price-reporting rules under HMDA, in effect since October 2009, define higher-priced first-lien loans as those with an APR of at least 1.5 percentage points above the average prime offer rate (APOR) for loans of a similar type (for example, a 30-year fixed-rate mortgage).25 The spread for junior-lien loans must be at least 3.5 percentage points for such loans to be considered higher priced. The APOR, which is published weekly by the Federal Financial Institutions Examination Council, is an estimate of the APR on loans being offered to high-quality prime borrowers based on the contract interest rates and discount points reported by Freddie Mac in its Primary Mortgage Market Survey.26
In 2013, the fraction of home-purchase loans (again, first liens for one- to four-family, owner-occupied, site-built properties) above the higher-priced threshold increased to 7.1 percent from 3.1 percent in 2012 (as shown in table 6.A ). This increase stemmed from a rise in the higher-priced share of nonconventional loans from 3 percent to nearly 14 percent (the higher-priced share of conventional loans declined slightly). More specifically, the higher-priced fraction of FHA home-purchase loans spiked from about 5 percent in early 2013 to about 40 percent after May 2013, with an overall average incidence for the year of about 22 percent (table 7).27 In contrast, less than 1 percent of VA and FSA/RHS loans were higher priced in 2013. The rise in higher-priced FHA lending reflects, at least in part, the slight increase in the FHA annual MIP in April 2013 (on top of increases in 2010, 2011, and 2012), in addition to the FHA's lengthening the period over which the annual MIP is required to be paid beginning in June 2013.28 For example, on a 30-year loan with an initial LTV over 90 percent (the vast majority of FHA loans), the annual MIP is now required to be paid over the life of the loan (as discussed earlier), whereas the previous policy was to automatically cancel premium payments once the LTV reached 78 percent.29 These changes appear to have pushed many FHA home-purchase loans just over the reporting threshold; as shown in table 7, over 75 percent of higher-priced FHA home-purchase loans were within 0.5 percentage point of the higher-priced threshold.
There was little increase in the higher-priced fraction of refinance mortgages (as shown in table 6.A). In contrast to nonconventional home-purchase loans, the higher-priced share of nonconventional refinance loans increased only slightly. Perhaps an important factor here is that, in 2012, the FHA reduced the annual MIP on streamline refinances of FHA loans endorsed before June 2009 to 0.55 percent.30
Table 6.A also shows that, in 2013, black and Hispanic-white borrowers had the highest incidences of higher-priced loans within both the conventional and nonconventional loan types. Table 6.A provides the raw rates of higher-priced lending by group from 2004 to 2013, but, as discussed in detail in previous Bulletin articles on the HMDA data, the raw rates reported in the public HMDA data can be difficult to compare over time for two main reasons. First, a different price-reporting rule was in place prior to October 2009. And, second, the previous price-reporting rule created unintended distortions in reporting over time (which is why the reporting rule was changed).
Under the previous rule, lenders were required to compare the APR on a mortgage with the yield on a Treasury security with a comparable term to maturity to determine whether the loan should be considered higher priced. If the difference exceeded 3 percentage points for a first-lien loan or 5 percentage points for a junior-lien loan, the loan was classified as higher priced and the rate spread (the amount of the difference) was reported. Unfortunately, using comparable-term Treasury securities as the benchmark rate generated differences over time in the incidence of reported higher-priced lending that were independent of changes in the supply of and demand for riskier mortgage loans.
One effect of the old pricing rule is that, in periods when the yield curve is steep (that is, when shorter-term Treasury rates are significantly lower than longer-term Treasury rates), a loan would be less likely to be reported as higher priced than in periods when the yield curve is flat, all else being equal. Since most mortgages prepay well before the stated term of the loan, lenders typically use relatively shorter-term interest rates when setting the price of mortgage loans. For example, lenders often price 30-year fixed-rate mortgages based on the yields on securities with maturities of 10 years or less. As such, when shorter-term Treasury rates fall relative to longer-term rates, mortgage rates get pulled down relative to longer-term Treasury rates, essentially raising the bar for a mortgage to be classified as higher priced. While the current reporting rule defines higher-priced loans as those with a spread over the prime mortgage rate, or APOR, of at least 1.5 percentage points, in 2004, when the yield curve was relatively steep, a 30-year fixed-rate mortgage's spread over the APOR would have had to have been about 2.2 percentage points over the APOR to meet the threshold of 300 basis points over the Treasury rate. A similar steepening of the yield curve affected reported higher-priced lending during 2009 prior to the rule change.
A second effect of tying the higher-priced definition to Treasury rates is that, when there is a "flight to quality," such as during the financial crisis, investors flock to the safest securities, such as Treasury securities, increasing the spread between Treasury securities and other instruments, including prime mortgages.31 In contrast to the first effect, this flight-to-quality effect lowers the bar for a loan to be reported as higher priced. At some points in the latter half of 2008, 30-year fixed-rate mortgages with spreads over the APOR of just 1 percentage point would have been reported as higher priced.
Table 6.B provides adjusted rates of higher-priced lending intended to be more comparable over time. Using the dates of application and origination (which are not released in the public HMDA data files), we can estimate the APR of loans that were originated under the old pricing rule. This estimated APR can then be compared with the APOR instead of with Treasury rates, as is done under the new price-reporting rule. Finally, because the implied threshold spread over the APOR during the previous reporting regime got to as high as about 2.5 percentage points, table 6.B reports the fraction of loans with an estimated APR spread over the APOR (or the actual reported spread for loans made under the new rules) of at least 2.5 percentage points.32
Because of the higher adjusted threshold imposed, the frequencies of higher-priced mortgage lending reported in table 6.B are significantly lower than those in table 6.A, but they should be more comparable over time. The rates in table 6.B may also provide a better sense of the extent of subprime lending, rather than a combination of subprime and near-prime lending, since the threshold is 2.5 percentage points over the APOR rather than 1.5 percentage points. Notably, table 6.B suggests that, by 2008, there was very little subprime lending. In addition, whereas table 6.A indicates that the rate of higher-priced lending in 2013 had risen from 2012 and was almost one-third the rate in 2006, table 6.B shows that the adjusted rate in 2013 was slightly lower than in 2012 and was less than one-twentieth what it was in 2006. Finally, in 2013, the differences across racial and ethnic groups are more muted than in table 6.A: Almost no borrowers, regardless of race or ethnicity, got loans with a spread over the APOR in excess of 2.5 percentage points, in stark contrast to the patterns during the height of the housing boom in 2005 and 2006.
One shortcoming of this adjustment technique is that we assume all loans are 30-year fixed-rate mortgages because the HMDA data do not provide information on the term or rate structure. Perhaps the most significant implication of this assumption is that, despite our adjustments, the extent of higher-priced lending in 2004 relative to other years is understated (alternatively, the growth in higher-priced lending between 2004 and 2005 is still overstated despite our adjustments). During the housing boom, adjustable-rate mortgages were quite prevalent, and the APRs on such loans are tied to even shorter-term Treasury rates than fixed-rate mortgages. Thus, when the yield curve is relatively steep, as in 2004, the bar for adjustable-rate mortgages to be reported as higher priced would have been even higher than for fixed-rate mortgages.
| Type of loan and race and ethnicity of borrower |
2004 | 2005 | 2006 | 2007 | 2008 | 2009 | 2010 | 2011 | 2012 | 2013 |
|---|---|---|---|---|---|---|---|---|---|---|
| A. Home purchase | ||||||||||
| Conventional and nonconventional 1 | ||||||||||
| All applicants | 9.8 | 22.5 | 23.2 | 12.7 | 8.1 | 4.6 | 2.2 | 3.3 | 3.1 | 7.1 |
| Asian | 5.5 | 16.3 | 16.4 | 7.6 | 4.0 | 2.4 | 1.0 | 1.5 | 1.4 | 3.0 |
| Black or African American | 24.3 | 46.7 | 46.4 | 27.6 | 14.5 | 7.1 | 3.0 | 5.0 | 5.3 | 14.2 |
| Other minority 2 | 14.4 | 30.3 | 30.7 | 16.1 | 9.1 | 5.3 | 2.3 | 3.5 | 3.4 | 8.7 |
| Hispanic white | 17.5 | 42.0 | 43.3 | 25.9 | 15.8 | 8.1 | 3.9 | 6.1 | 5.9 | 16.8 |
| Non-Hispanic white | 7.8 | 15.5 | 16.0 | 9.6 | 7.2 | 4.3 | 2.2 | 3.1 | 2.9 | 6.1 |
| Conventional only | ||||||||||
| All applicants | 11.0 | 24.5 | 25.3 | 14.0 | 7.3 | 4.6 | 3.3 | 3.8 | 3.2 | 2.9 |
| Asian | 5.6 | 16.6 | 16.7 | 7.7 | 3.3 | 1.9 | 1.0 | 1.3 | 1.2 | 1.1 |
| Black or African American | 30.6 | 54.1 | 53.4 | 34.0 | 17.4 | 8.7 | 6.1 | 8.0 | 6.7 | 6.1 |
| Other minority2 | 16.1 | 33.3 | 33.6 | 18.5 | 9.5 | 6.7 | 4.6 | 5.5 | 5.1 | 4.9 |
| Hispanic white | 20.0 | 45.3 | 46.3 | 28.9 | 17.7 | 11.0 | 9.6 | 10.7 | 8.7 | 7.3 |
| Non-Hispanic white | 8.6 | 16.9 | 17.5 | 10.5 | 6.5 | 4.8 | 3.4 | 3.9 | 3.2 | 2.9 |
| Nonconventional only1 | ||||||||||
| All applicants | 1.2 | .9 | 1.8 | 3.0 | 9.5 | 4.6 | 1.3 | 2.7 | 3.0 | 13.8 |
| Asian | 2.4 | .6 | .8 | 1.3 | 8.2 | 3.9 | .8 | 2.0 | 1.9 | 13.1 |
| Black or African American | 1.4 | 1.6 | 2.5 | 4.5 | 12.8 | 6.8 | 2.4 | 4.3 | 4.9 | 17.6 |
| Other minority2 | 4.4 | .7 | 2.1 | 2.4 | 8.8 | 4.7 | 1.2 | 2.5 | 2.4 | 11.7 |
| Hispanic white | 2.0 | 1.4 | 3.5 | 4.5 | 14.0 | 7.1 | 2.2 | 4.5 | 4.7 | 22.4 |
| Non-Hispanic white | 1.0 | .7 | 1.5 | 2.5 | 8.4 | 3.9 | 1.0 | 2.3 | 2.5 | 12.0 |
| B. Refinance | ||||||||||
| Conventional and nonconventional1 | ||||||||||
| All applicants | 14.5 | 25.0 | 30.3 | 21.0 | 10.9 | 3.8 | 1.8 | 2.1 | 1.5 | 1.9 |
| Asian | 5.8 | 15.1 | 19.5 | 12.5 | 3.1 | .9 | .4 | .5 | .4 | .5 |
| Black or African American | 30.0 | 46.2 | 50.7 | 38.1 | 22.8 | 9.0 | 6.5 | 6.8 | 4.1 | 3.8 |
| Other minority2 | 17.6 | 26.9 | 32.3 | 23.8 | 13.9 | 4.7 | 2.6 | 2.6 | 2.0 | 2.2 |
| Hispanic white | 18.2 | 32.6 | 36.9 | 26.5 | 15.1 | 7.0 | 4.4 | 4.4 | 2.6 | 3.1 |
| Non-Hispanic white | 12.3 | 20.4 | 25.0 | 17.6 | 10.2 | 3.7 | 1.8 | 2.2 | 1.5 | 2.0 |
| Conventional only | ||||||||||
| All applicants | 15.2 | 25.7 | 31.0 | 21.8 | 10.4 | 3.1 | 1.3 | 1.5 | 1.2 | 1.5 |
| Asian | 5.8 | 15.2 | 19.6 | 12.5 | 2.9 | .7 | .2 | .3 | .3 | .3 |
| Black or African American | 33.7 | 49.0 | 52.8 | 41.5 | 27.6 | 9.9 | 4.0 | 4.2 | 2.9 | 3.3 |
| Other minority2 | 18.2 | 27.7 | 32.9 | 24.5 | 14.7 | 4.8 | 1.9 | 2.2 | 1.7 | 2.0 |
| Hispanic white | 19.2 | 33.4 | 37.5 | 27.3 | 16.0 | 7.2 | 3.3 | 3.3 | 2.3 | 2.4 |
| Non-Hispanic white | 12.8 | 20.9 | 25.6 | 18.2 | 9.8 | 3.1 | 1.3 | 1.6 | 1.2 | 1.6 |
| Nonconventional only1 | ||||||||||
| All applicants | 1.5 | .9 | 3.1 | 6.6 | 13.2 | 6.7 | 4.9 | 5.9 | 3.2 | 3.9 |
| Asian | 3.6 | 2.1 | 2.5 | 4.9 | 8.9 | 4.8 | 3.1 | 4.0 | 1.8 | 2.6 |
| Black or African American | 1.0 | 1.2 | 4.1 | 7.8 | 15.2 | 8.2 | 9.8 | 10.9 | 6.0 | 4.6 |
| Other minority2 | 8.1 | 3.9 | 9.6 | 9.9 | 10.5 | 4.5 | 4.6 | 4.3 | 2.9 | 2.9 |
| Hispanic white | 2.0 | .9 | 2.6 | 6.2 | 11.6 | 6.6 | 7.3 | 7.9 | 3.6 | 5.1 |
| Non-Hispanic white | 1.3 | .7 | 2.8 | 6.0 | 12.1 | 6.5 | 4.6 | 5.9 | 3.3 | 4.2 |
Note: First-lien mortgages for one- to four-family, owner-occupied, site-built homes. For a description of how borrowers are categorized by race and ethnicity, see table 2, note 1.
1. See table 4, note 1. Return to table
2. See table 2, note 2. Return to table
| Type of loan and race and ethnicity of borrower |
2004 | 2005 | 2006 | 2007 | 2008 | 2009 | 2010 | 2011 | 2012 | 2013 |
|---|---|---|---|---|---|---|---|---|---|---|
| A. Home purchase | ||||||||||
| Conventional and nonconventional 1 | ||||||||||
| All applicants | 7.4 | 18.3 | 17.1 | 6.3 | 1.3 | 1.3 | .6 | .8 | .8 | .7 |
| Asian | 3.8 | 13.0 | 11.4 | 3.1 | .5 | .5 | .3 | .3 | .3 | .3 |
| Black or African American | 19.3 | 40.3 | 38.5 | 16.7 | 1.9 | 1.3 | .6 | .7 | .9 | 1.1 |
| Other minority 2 | 10.5 | 24.7 | 22.7 | 8.0 | 1.5 | 1.4 | .8 | .9 | 1.1 | .9 |
| Hispanic white | 12.3 | 34.5 | 32.8 | 13.0 | 2.1 | 1.4 | 1.0 | 1.3 | 1.6 | 1.6 |
| Non-Hispanic white | 5.8 | 12.1 | 10.9 | 4.3 | 1.3 | 1.4 | .7 | .8 | .8 | .7 |
| Conventional only | ||||||||||
| All applicants | 8.2 | 20.0 | 18.7 | 7.1 | 1.9 | 2.3 | 1.3 | 1.4 | 1.2 | .9 |
| Asian | 3.8 | 13.3 | 11.6 | 3.2 | .5 | .6 | .3 | .4 | .4 | .3 |
| Black or African American | 24.4 | 46.9 | 44.5 | 21.2 | 4.7 | 4.0 | 2.6 | 2.6 | 2.7 | 1.8 |
| Other minority2 | 11.6 | 27.2 | 25.0 | 9.3 | 2.7 | 3.7 | 2.3 | 2.5 | 2.6 | 1.7 |
| Hispanic white | 14.0 | 37.2 | 35.2 | 14.8 | 3.9 | 4.6 | 3.9 | 4.1 | 4.5 | 2.8 |
| Non-Hispanic white | 6.5 | 13.2 | 12.0 | 4.9 | 1.9 | 2.6 | 1.3 | 1.5 | 1.2 | .8 |
| Nonconventional only1 | ||||||||||
| All applicants | .9 | .3 | .2 | .3 | .4 | .4 | .1 | .2 | .3 | .5 |
| Asian | 2.2 | .3 | .1 | .2 | .2 | .2 | .1 | .2 | .2 | .3 |
| Black or African American | 1.0 | .5 | .3 | .6 | .4 | .7 | .2 | .3 | .3 | .8 |
| Other minority2 | 3.9 | .3 | .2 | .2 | .3 | .3 | .1 | .1 | .2 | .3 |
| Hispanic white | 1.6 | .3 | .3 | .2 | .5 | .4 | .1 | .3 | .3 | .8 |
| Non-Hispanic white | .8 | .2 | .2 | .2 | .3 | .3 | .1 | .2 | .3 | .5 |
| B. Refinance | ||||||||||
| Conventional and nonconventional1 | ||||||||||
| All applicants | 11.3 | 20.1 | 21.3 | 12.7 | 4.3 | 1.4 | .6 | .8 | .7 | .7 |
| Asian | 4.1 | 12.2 | 12.1 | 5.4 | .8 | .2 | .1 | .2 | .1 | .1 |
| Black or African American | 24.3 | 38.5 | 39.0 | 26.4 | 10.6 | 3.5 | 2.6 | 3.3 | 2.5 | 1.6 |
| Other minority2 | 13.2 | 22.0 | 22.3 | 14.5 | 7.1 | 2.1 | .9 | 1.1 | 1.1 | .8 |
| Hispanic white | 13.4 | 27.0 | 25.8 | 14.8 | 5.6 | 2.5 | 1.8 | 1.8 | 1.1 | .9 |
| Non-Hispanic white | 9.5 | 15.9 | 16.9 | 10.3 | 4.1 | 1.4 | .6 | .8 | .7 | .7 |
| Conventional only | ||||||||||
| All applicants | 11.8 | 20.7 | 21.9 | 13.3 | 5.1 | 1.5 | .5 | .6 | .4 | .4 |
| Asian | 4.1 | 12.3 | 12.1 | 5.4 | .9 | .2 | .1 | .1 | .0 | .0 |
| Black or African American | 27.3 | 40.8 | 40.7 | 29.4 | 17.1 | 6.3 | 2.0 | 1.8 | 1.0 | 1.0 |
| Other minority2 | 13.6 | 22.6 | 22.7 | 14.9 | 8.3 | 2.8 | .9 | .9 | .7 | .7 |
| Hispanic white | 14.1 | 27.7 | 26.2 | 15.4 | 6.9 | 3.5 | 1.4 | 1.3 | .8 | .7 |
| Non-Hispanic white | 9.9 | 16.3 | 17.3 | 10.9 | 4.8 | 1.6 | .5 | .6 | .4 | .5 |
| Nonconventional only1 | ||||||||||
| All applicants | 1.0 | .6 | .7 | .5 | .4 | .5 | 1.2 | 2.5 | 2.3 | 1.8 |
| Asian | 2.9 | 1.8 | 1.3 | 1.4 | .5 | .3 | .5 | 1.5 | 1.4 | 1.1 |
| Black or African American | .6 | .8 | 1.2 | .6 | .5 | 1.1 | 3.5 | 5.9 | 4.9 | 2.6 |
| Other minority2 | 6.3 | 3.4 | 7.8 | 6.3 | 1.9 | .4 | 1.1 | 2.0 | 2.2 | 1.3 |
| Hispanic white | 1.4 | .4 | .3 | .6 | .7 | .8 | 2.8 | 3.5 | 1.9 | 1.3 |
| Non-Hispanic white | .8 | .4 | .4 | .3 | .4 | .5 | 1.0 | 2.4 | 2.5 | 2.1 |
Note: First-lien mortgages for one- to four-family, owner-occupied, site-built homes. For a description of how borrowers are categorized by race and ethnicity, see table 2, note 1. See text for details on how adjusted incidences are calculated.
1. See table 4, note 1. Return to table
2. See table 2, note 2. Return to table
| Purpose and type of loan | Total number | Number | Loans with APOR spread above the threshold 1 | ||||||
|---|---|---|---|---|---|---|---|---|---|
| Percent | Distribution, by percentage points of APOR spread | ||||||||
| 1.5-1.99 | 2-2.49 | 2.5-2.99 | 3-3.99 | 4-4.99 | 5 or more | ||||
| Site-built homes | |||||||||
| Home purchase | |||||||||
| Conventional | 1,622,487 | 47,481 | 2.9 | 49.8 | 20.8 | 11.6 | 10.6 | 3.8 | 3.3 |
| FHA 2 | 622,826 | 135,429 | 21.7 | 75.6 | 20.6 | 2.9 | .8 | .05 | .02 |
| VA/RHS/FSA 3 | 370,117 | 1,741 | .5 | 76.6 | 19.0 | 1.7 | 1.3 | 1.0 | .4 |
| Refinance | |||||||||
| Conventional | 3,627,767 | 55,700 | 1.5 | 53.0 | 19.4 | 9.9 | 10.8 | 4.2 | 2.7 |
| FHA2 | 435,666 | 27,064 | 6.2 | 41.6 | 10.6 | 10.7 | 33.2 | 3.7 | .3 |
| VA/RHS/FSA3 | 277,397 | 1,101 | .4 | 94.1 | 3.6 | .5 | 1.0 | .4 | .4 |
| Manufactured homes | |||||||||
| Home purchase | |||||||||
| Conventional | 50,855 | 34,934 | 68.7 | 5.1 | 5.6 | 5.5 | 14.0 | 14.0 | 55.8 |
| FHA2 | 11,003 | 4,308 | 39.2 | 52.8 | 24.6 | 6.9 | 6.1 | 9.3 | .3 |
| VA/RHS/FSA3 | 3,052 | 30 | 1.0 | 76.7 | 13.3 | 6.7 | 0 | 3.3 | 0 |
| Refinance | |||||||||
| Conventional | 32,322 | 8,309 | 25.7 | 22.2 | 14.0 | 12.0 | 20.8 | 12.8 | 18.2 |
| FHA2 | 9,117 | 832 | 9.1 | 54.0 | 10.3 | 4.9 | 25.0 | 5.5 | .2 |
| VA/RHS/FSA3 | 2,567 | 17 | .7 | 94.1 | 0 | 5.9 | 0 | 0 | 0 |
Note: First-lien mortgages for one- to four-family owner-occupied homes.
1. Average prime offer rate (APOR) spread is the difference between the annual percentage rate on the loan and the APOR for loans of a similar type published weekly by the Federal Financial Institutions Examination Council. The threshold for first-lien loans is a spread of 1.5 percentage points. Return to table
2. Loans insured by the Federal Housing Administration. Return to table
3. Loans backed by guarantees from the U.S. Department of Veterans Affairs, the Rural Housing Service, or the Farm Service Agency. Return to table
Analyzing the Incidence of Higher-Priced Lending Using Credit Bureau Data
Next, we present the results from an analysis using an enhanced HMDA data set in which first-lien home-purchase and refinance mortgages for owner-occupied site-built properties reported in the HMDA data have been matched to borrowers' consumer credit record information.33 As shown in tables 6.A and 6.B, the HMDA data exhibit persistent differences in the incidence of higher-priced lending across racial and ethnic lines. At the height of the housing boom in 2006, when higher-priced lending was far more prevalent than it is today, over 53 percent of conventional home-purchase loans to black borrowers and over 46 percent of such loans to Hispanic white borrowers were higher priced, compared with less than 18 percent for white borrowers (as shown in table 6.A).
It is unclear whether, or to what extent, these differences are due to discrimination, borrower risk characteristics, or other factors. Because the information on borrower and loan characteristics in the HMDA data is limited, one cannot explain the observed disparities with the HMDA data alone. The matched data allow us to account for borrowers' credit risk scores, which are an important determinant of the interest rate lenders set on a loan. As discussed in more detail in the next subsections, the matched data reveal significant differences in risk scores across racial and ethnic groups. Moreover, these differences help explain much (but not all) of the difference in the incidence of higher-priced lending across groups.
Unfortunately, the matched data set does not include all of the characteristics of the borrower and loan that banks consider when pricing a loan, and these unobserved characteristics could be driving the remaining difference in higher-priced lending.34 Therefore, although differences in higher-priced lending by race and ethnicity remain after controlling for risk scores, one cannot conclude that they are evidence of discrimination.
Description of the Matched HMDA-Credit Record Data
The credit records available for matching come from the Federal Reserve Bank of New York Consumer Credit Panel/Equifax data (CCP).35 The CCP is a 5 percent, nationally representative sample of all individuals with a credit record and a valid Social Security number. The CCP is a quarterly panel, tracking the same individuals over time and providing detailed information on the evolution of individuals' debt holdings and payment history.36 The CCP also provides a credit risk score--the Equifax Risk Score--which is updated each quarter.37 In this analysis, we use risk scores one quarter prior to the quarter of mortgage origination.
Neither the HMDA data nor the credit record data include personal identifying information, but borrowers in the two data sets can be matched based on the mortgage loan information common to both data sets.38 For this article, we present results from the matched 2006 HMDA loan records, reflecting lending activity at the height of the most recent housing boom and when higher-priced lending was prevalent. Because of tightened credit and the rarity of higher-priced lending in recent years regardless of race or ethnicity (as shown, in particular, in table 6.B), there simply are no sizable pricing differences observed in the HMDA data, as there were during the housing boom, to explain. Moreover, the subsequent housing market crash has drawn increased scrutiny to lender behavior during this period.
Because the credit record data are a 5 percent sample of the full population, only a small fraction of HMDA loan records will be represented in the CCP. That said, because the HMDA data consist of several million loan records, the resulting matched data set is still quite large. For reasons discussed in the 2013 Bulletin article on the HMDA data, we attempted to match only those mortgages for owner-occupied properties in metropolitan statistical areas.39 Of such loans, we matched about 300,000 in 2006. A comparison of the characteristics of the matched loans with the characteristics of the full HMDA data set indicates that the matched loans provide a good representation of all HMDA records targeted for matching.
Credit Scores and the Racial and Ethnic Disparity in Higher-Priced Lending
Credit risk scores are a summary metric of the relative credit risk posed by current and prospective borrowers. Generic risk scores (sometimes referred to as bureau or credit history scores) are derived using credit records to predict the likelihood of default based on individuals' past experiences. Lower scores indicate a greater credit risk. Lenders consider such scores when underwriting loans, and borrowers with poor credit, all else being equal, are likely to be charged higher prices. To the extent that credit scores differ significantly across groups, that could help explain differences in mortgage pricing.
Black and Hispanic-white borrowers, the two groups with the highest incidences of loans priced above the reporting threshold in 2006, also had the lowest group-average credit scores of 635 and 668, respectively (table 8). While about two-thirds of non-Hispanic white borrowers had scores over 700, only about 26 percent of black borrowers and 38 percent of Hispanic white borrowers had such scores. At the same time, over one-third of black borrowers and about 16 percent of Hispanic white borrowers had credit scores below 600, compared with less than 9 percent of non-Hispanic white borrowers and less than 5 percent of Asian borrowers.
Next, we show the frequencies of higher-priced lending by race and ethnic group, broken into "bins" by risk score (table 9). The third row from the bottom shows the raw difference in the incidence of higher-priced lending for each group.40 The second-to-last row presents the estimated difference in the incidence after controlling only for the variables available in the HMDA data.41 As noted earlier, controlling for HMDA variables such as income does little to reduce the disparities.
The final row contains estimates of the differences after controlling for borrowers' risk scores. Accounting for risk scores significantly reduces the discrepancies in higher-priced lending, which can also be seen in the top part of the table. Within any given score category, differences in the incidence of higher-priced lending are smaller than the overall difference. For example, within the highest score group (751 or more), the difference in the incidence of higher-priced lending between black and non-Hispanic-white borrowers is about 10 percentage points rather than 35 percentage points.
Still, the remaining discrepancies are not immaterial. It is important to recognize that the matched data do not contain all of the information lenders might take into account when making the loan pricing decision, such as the LTV ratio, employment history, other assets, and the level of income and asset documentation. Lacking LTV data may be particularly problematic, as such data are a key measure of default risk as well as of the loss the lender would incur in the event of default--a higher LTV ratio means less collateral for a given loan amount.
Risk factors like LTV ratios are likely correlated with both minority status and credit score. Table 9 could be overstating the true effect of race, ethnicity, and credit score on higher-priced lending if these variables are acting as proxies for other risk factors we do not observe. A more technical treatment attempting to further explain the racial and ethnic disparities in higher-priced lending using additional information from the credit record data--including measures of back-end payment-to-income ratios and variables that might be correlated with having a high LTV ratio, such as first-time homebuyer status--is available in appendix B. These additional controls do little to reduce the differences, however.
| Measure of credit risk | Asian | Black or African American |
Other minority 1 | White | Memo: Total observations | |
|---|---|---|---|---|---|---|
| Hispanic | Non-Hispanic | |||||
| Equifax Risk Score range | ||||||
| 500 or less | .2 | 2.9 | 1.0 | .9 | .5 | 811 |
| 501-550 | .7 | 9.3 | 1.8 | 3.6 | 1.8 | 2,716 |
| 551-600 | 3.3 | 22.4 | 11.1 | 11.9 | 6.0 | 8,225 |
| 601-650 | 9.0 | 22.2 | 17.1 | 21.1 | 10.8 | 13,613 |
| 651-700 | 18.8 | 17.3 | 20.6 | 24.6 | 16.8 | 19,480 |
| 701-750 | 28.6 | 14.6 | 26.2 | 22.2 | 24.5 | 27,122 |
| 751 or more | 39.3 | 11.4 | 22.3 | 15.7 | 39.7 | 43,590 |
| All | 100 | 100 | 100 | 100 | 100 | 115,557 |
| Memo: Average risk score | 718 | 635 | 680 | 668 | 702 | ... |
Note: Conventional first-lien home-purchase mortgages for owner-occupied, one- to four-family, site-built homes. Distributions may not sum to 100 because of rounding. For a description of how borrowers are categorized by race and ethnicity, see table 2, note 1.
1. See table 2, note 2. Return to table
... Not applicable.
Source: FFIEC HMDA data matched to FRBNY Consumer Credit Panel/Equifax data.
| Measure of credit risk and of difference in higher-priced lending |
Asian | Black or African American |
Other minority 1 | White | All | |
|---|---|---|---|---|---|---|
| Hispanic | Non-Hispanic | |||||
| Equifax Risk Score range | ||||||
| 500 or less | 84.6 | 88.2 | 73.3 | 81.0 | 73.1 | 79.2 |
| 501-550 | 53.7 | 83.8 | 75.9 | 78.3 | 75.5 | 78.6 |
| 551-600 | 53.4 | 74.9 | 58.0 | 74.7 | 63.2 | 68.3 |
| 601-650 | 39.0 | 54.8 | 39.3 | 59.9 | 36.6 | 44.0 |
| 651-700 | 14.1 | 29.0 | 19.1 | 38.0 | 14.3 | 19.4 |
| 701-750 | 5.0 | 17.0 | 12.8 | 20.9 | 5.6 | 7.9 |
| 751 or more | 2.3 | 12.7 | 8.8 | 16.3 | 2.5 | 3.4 |
| All | 10.8 | 48.3 | 25.1 | 41.8 | 14.3 | 20.3 |
| Difference in incidence of higher-priced lending relative to non-Hispanic white | ||||||
| Raw difference | -3.5 | 34.1 | 10.8 | 27.5 | 0 | ... |
| Adjusted for HMDA controls | -1.7 | 31.6 | 12.4 | 24.3 | 0 | ... |
| Adjusted for HMDA controls and Equifax Risk Score | -1.3 | 14.1 | 4.7 | 15.9 | 0 | ... |
Note: Conventional first-lien home-purchase mortgages for owner-occupied, one- to four-family, site-built homes. Distributions may not sum to 100 because of rounding. For a description of how borrowers are categorized by race and ethnicity, see table 2, note 1.
1. See table 2, note 2. Return to table
... Not applicable.
Source: FFIEC HMDA data matched to FRBNY Consumer Credit Panel/Equifax data.
Differences in Delinquency across Groups
As suggested earlier, lenders use information other than risk scores to assess a borrower's risk of default. To the extent that these other measures of risk differ by race and ethnicity, the residual incidence of higher-priced lending by group could be a function of each group's residual riskiness (that is, risk unexplained by credit risk scores). The credit record data allow us to construct an array of loan performance measures. One widely used metric of performance, which we investigate here, is the share of mortgage borrowers whose payments fell behind 60 days or more at any point within two years of taking out their loans in 2006.
We present the likelihood of 60-day delinquency within two years of origination, by credit score bins and by race and ethnicity (table 10). Black and Hispanic-white borrowers were more likely to become delinquent than non-Hispanic whites, conditional on their risk scores and other variables available from the HMDA data, including metropolitan statistical area. A possible explanation for the remaining differences in higher-priced lending, then, is that risk factors (such as LTV ratio, employment history, other available assets, and so on) differ across groups even after controlling for score. The remaining disparities in loan pricing found in table 9 could be a reflection of the distribution of these other factors.
Other explanations fit the data as well, however. Some lenders could be unfairly charging minorities more than similar non-Hispanic white borrowers, and, faced with the burden of higher monthly payments, minorities would then be more likely to default. Essentially, the price difference could be contributing to the delinquency difference.
Note that even if the differences in delinquency explain the differences in pricing, such data cannot rule out the possibility of "statistical discrimination." Risk factors that lenders do not observe could be distributed disproportionately across groups or by neighborhood demographics. Some lenders might use race and ethnicity as risk proxies and charge minorities higher prices as a result. This kind of (illegal) discrimination can be difficult to differentiate from (legal) pricing on the observed risk characteristics if the information lenders use in setting rates is not precisely known.
Finally, readers should keep in mind that these realized delinquency rates come from the period from 2006 through 2008, when default rates were much higher than historical averages. Therefore, they are not necessarily an accurate representation of the delinquencies lenders anticipated when the loans were originated.
| Measure of credit risk and of difference in delinquency |
Asian | Black or African American |
Other minority 1 | White | All | |
|---|---|---|---|---|---|---|
| Hispanic | Non-Hispanic | |||||
| Equifax Risk Score range | ||||||
| 500 or less | 53.9 | 61.0 | 33.3 | 44.4 | 35.7 | 45.6 |
| 501-550 | 33.3 | 51.5 | 58.6 | 47.9 | 38.9 | 44.1 |
| 551-600 | 25.5 | 39.2 | 34.7 | 38.6 | 29.9 | 33.7 |
| 601-650 | 17.8 | 26.5 | 25.6 | 32.3 | 16.1 | 20.6 |
| 651-700 | 8.8 | 12.3 | 16.0 | 21.6 | 6.7 | 9.6 |
| 701-750 | 3.3 | 5.6 | 9.7 | 13.5 | 2.6 | 4.0 |
| 751 or more | 1.3 | 2.5 | 3.7 | 6.0 | .6 | .9 |
| All | 5.9 | 24.8 | 16.3 | 23.0 | 6.4 | 9.9 |
| Difference in incidence of 60-day delinquency relative to non-Hispanic white | ||||||
| Raw difference | -.6 | 18.3 | 9.9 | 16.5 | 0 | ... |
| Adjusted for HMDA controls | -.6 | 18.0 | 7.5 | 14.0 | 0 | ... |
| Adjusted for HMDA controls and Equifax Risk Score | -.4 | 8.1 | 4.1 | 9.2 | 0 | ... |
Note: Conventional first-lien home-purchase mortgages for owner-occupied, one- to four-family, site-built homes. Distributions may not sum to 100 because of rounding. For a description of how borrowers are categorized by race and ethnicity, see table 2, note 1.
1. See table 2, note 2. Return to table
... Not applicable.
Source: FFIEC HMDA data matched to FRBNY Consumer Credit Panel/Equifax data.
Lending Institutions
In 2013, there were 7,190 reporting institutions: 4,212 banks and thrifts (hereafter, banks), 127 subsidiaries of banks or bank holding companies, 2,019 credit unions, and 832 independent mortgage companies (table 11).42 Banks accounted for over one-half of all reported mortgage originations, and independent mortgage companies accounted for about one-third. One of the biggest changes in the institutional landscape since the height of the housing boom in 2006 is the decline in originations by mortgage company subsidiaries of banks. In 2006, subsidiaries accounted for over 21 percent of originations; in 2013, they accounted for less than 6 percent.
Many reporting institutions are small. Over one-third of institutions (3,173 out of 7,190) reported fewer than 100 mortgage originations in 2013, accounting for only about 128,000 originations, or 1.5 percent of all originations. Over 16 percent of institutions originated fewer than 25 loans, accounting for about one-fifth of 1 percent of all originations.
Table 11 also reports various characteristics of first-lien home-purchase and refinance lending for one- to four-family, owner-occupied, site-built properties by each type of lending institution. The table documents some degree of variation in lending patterns in 2013 by lender type. For example, bank originations were significantly more skewed toward refinancings compared with originations by independent mortgage companies. In addition, for both home-purchase and refinance lending, a larger share of bank originations was conventional compared with originations by independent mortgage companies. The vast majority of loans by credit unions were conventional.
There were also significant differences in the propensity to originate and then sell loans.43 Banks reported selling about three-fourths of their home-purchase originations and 80 percent of their refinance originations, whereas independent mortgage companies sold nearly all of the loans they originated. Credit unions were the least likely to sell the loans they originated.
Finally, there are also differences across institution types in the composition of their borrowers. For example, nearly 22 percent of home-purchase borrowers at independent mortgage companies were minorities, compared with just 13 percent of the borrowers at credit unions.
The next table lists the top 25 reporting institutions according to their total number of originations, along with most of the lending characteristics listed in table 11 (table 12). Wells Fargo reported the most originations, with over 800,000. The next-highest total was for JPMorgan Chase, followed by Quicken Loans and Bank of America. Overall, the top 25 lenders accounted for about 41 percent of all loan originations in 2013. They also purchased nearly 2 million loans during 2013 (these loans could have been originated in 2013 or in earlier years).
Note that the institutions listed in table 12 may be part of a larger organization with multiple HMDA reporting entities or have subsidiary institutions that originate or purchase mortgages and file separate HMDA reports. Using information about parent institutions available in the HMDA Reporter Panel and HMDA Transmittal Sheets, some organizations have more originations or purchases than the "lead" institution listed in table 12.44 Most notably, Wells Fargo & Company, collectively, had about 841,000 originations, including the 819,000 by Wells Fargo Bank; Citigroup purchased 419,000 loans, including the 104,000 purchased by Citibank; Fifth Third Bancorp originated 114,000 loans, including the nearly 82,000 originated by Fifth Third Mortgage Company; and SunTrust Banks originated almost 99,000 loans, including the 85,000 by SunTrust Mortgage.
The top institutions differ significantly in their lending patterns. For example, nearly 94 percent of Citibank's home-purchase loans were conventional, compared with much lower percentages for many other large lenders. Regarding loan sales, Bank of America sold only 55 percent of its home-purchase originations, whereas the average across the top 25 institutions was over 85 percent. Finally, the composition of borrowers varies across the top 25 institutions. For some institutions, one-third or more of home-purchase borrowers were LMI, while at other institutions 20 percent or less of borrowers were in that category.45 It is difficult to know precisely why such variation exists. These differences could reflect different business strategies, different customer demands in the markets and geographic regions being served, or some combination of these two broad factors.
| Institutions and type of activity | Type of institution | ||||
|---|---|---|---|---|---|
| Bank | Bank subsidiary | Credit union | Independent mortgage company | All | |
| Number of institutions | 4,212 | 127 | 2,019 | 832 | 7,190 |
| Applications (thousands) | 7,188 | 780 | 1,159 | 4,860 | 13,987 |
| Originations (thousands) | 4,628 | 490 | 714 | 2,876 | 8,707 |
| Purchases (thousands) | 1,964 | 397 | 20 | 413 | 2,794 |
| Number of institutions with fewer than 100 loans | 1,994 | 28 | 1,072 | 79 | 3,173 |
| Originations (thousands) | 81.6 | .8 | 42.0 | 3.0 | 127.5 |
| Number of institutions with fewer than 25 loans | 709 | 16 | 401 | 31 | 1,157 |
| Originations (thousands) | 8.5 | .2 | 5.0 | .4 | 14.0 |
| Home-purchase loans (thousands) 1 | 1,122 | 198 | 157 | 1,138 | 2,615 |
| Conventional | 72.2 | 58.5 | 86.3 | 49.3 | 62.0 |
| Higher-priced share of conventional loans | 3.6 | 1.2 | 4.4 | 1.9 | 2.9 |
| LMI borrower 2 | 26.0 | 30.6 | 27.7 | 30.5 | 28.4 |
| LMI neighborhood 3 | 11.6 | 11.9 | 12.6 | 14.0 | 12.7 |
| Non-Hispanic white 4 | 72.8 | 72.4 | 72.1 | 67.0 | 70.2 |
| Minority borrower4 | 16.3 | 16.5 | 12.8 | 21.7 | 18.5 |
| Within CRA assessment area 5 | 68.7 | 39.1 | ... | ... | ... |
| Sold 6 | 75.0 | 98.2 | 52.9 | 97.6 | 85.2 |
| Refinance loans (thousands)1 | 2,388 | 227 | 361 | 1,364 | 4,341 |
| Conventional | 88.0 | 78.7 | 95.0 | 73.5 | 83.6 |
| Higher-priced share of conventional loans | 1.5 | .6 | 2.5 | 1.3 | 1.5 |
| LMI borrower2 | 22.2 | 19.1 | 23.0 | 19.1 | 21.1 |
| LMI neighborhood3 | 11.9 | 10.8 | 12.3 | 12.6 | 12.1 |
| Non-Hispanic white4 | 71.7 | 71.0 | 72.8 | 67.5 | 70.5 |
| Minority borrower4 | 14.6 | 13.9 | 11.9 | 16.3 | 14.9 |
| Within CRA assessment area5 | 69.2 | 45.1 | ... | ... | ... |
| Sold6 | 79.6 | 98.3 | 44.7 | 98.1 | 83.4 |
1. First-lien mortgages for one-to-four family, owner-occupied, site-built homes. Return to table
2. See table 2, note 3. Return to table
3. See table 2, note 4. Return to table
4. See table 2, note 1. "Minority borrower" refers to nonwhite (excluding joint or missing) or Hispanic-white applicants. Return to table
5. Loans originated by banking institutions within their Community Reinvestment Act (CRA) assessment areas, which are defined for this analysis as the counties where the bank has at least one branch office. For subsidiaries, assessment areas are defined as the counties with at least one branch of any bank within the same banking organization. Return to table
6. Excludes originations made in the last quarter of the year because the incidence of loan sales tends to decline for loans originated toward the end of the year, as lenders report a loan as sold only if the sale occurs within the same year as origination. Return to table
... Not applicable.
| Respondent | Total origina- tions (thousands) |
Total purchases (thousands) |
Home-purchase loans 1 | |||||||
|---|---|---|---|---|---|---|---|---|---|---|
| Number (thous- ands) |
Conven- tional |
Higher priced 2 |
LMI borrow- er 3 |
LMI neighbor- hood 4 |
Non- Hispanic white 5 |
Minority borrower5 |
Sold 6 | |||
| Wells Fargo Bank, NA | 819 | 842 | 188 | 71.4 | .1 | 21.3 | 11.1 | 69.6 | 20.2 | 83.2 |
| JPMorgan Chase Bank, NA | 426 | 426 | 59 | 72.5 | .5 | 25.4 | 12.3 | 63.7 | 24.8 | 79.1 |
| Quicken Loans, Inc. | 376 | 0 | 30 | 56.0 | 2.7 | 25.2 | 12.2 | 61.7 | 12.9 | 100.0 |
| Bank of America, NA | 359 | 117 | 40 | 77.4 | .1 | 21.5 | 11.8 | 59.5 | 25.1 | 55.0 |
| Citibank, NA | 232 | 104 | 19 | 93.7 | .0 | 13.7 | 12.3 | 46.8 | 25.6 | 63.6 |
| U.S. Bank, NA | 178 | 166 | 32 | 75.1 | .6 | 28.4 | 11.1 | 75.5 | 11.1 | 79.4 |
| PNC Bank, NA | 118 | 1 | 20 | 66.0 | .0 | 33.9 | 13.3 | 63.8 | 14.7 | 90.5 |
| Flagstar Bank, FSB | 114 | 42 | 38 | 57.9 | 1.3 | 26.1 | 11.7 | 66.6 | 26.0 | 99.6 |
| Nationstar Mortgage | 98 | 26 | 9 | 53.9 | .1 | 25.3 | 14.4 | 57.1 | 33.1 | 98.5 |
| SunTrust Mortgage, Inc. | 85 | 42 | 18 | 84.2 | .0 | 19.4 | 8.8 | 66.1 | 16.8 | 98.7 |
| Branch Banking and Trust Co. | 84 | 95 | 25 | 68.5 | 2.8 | 30.0 | 13.1 | 71.0 | 11.0 | 68.8 |
| Fifth Third Mortgage Co. | 82 | 25 | 21 | 65.1 | 1.2 | 32.1 | 12.1 | 71.5 | 13.5 | 93.1 |
| USAA Federal Savings Bank | 77 | 0 | 37 | 36.5 | .0 | 13.1 | 8.7 | 64.7 | 12.7 | 99.3 |
| Freedom Mortgage Group | 63 | 14 | 8 | 46.2 | .1 | 28.8 | 12.6 | 69.8 | 20.2 | 100.0 |
| Navy Federal Credit Union | 57 | 0 | 19 | 45.2 | 11.5 | 20.9 | 11.7 | 58.4 | 17.8 | 55.9 |
| PrimeLending | 56 | 0 | 36 | 52.6 | 2.1 | 30.8 | 12.5 | 68.7 | 16.9 | 99.9 |
| Regions Bank | 55 | 0 | 17 | 56.7 | 4.7 | 33.5 | 12.8 | 74.1 | 21.3 | 74.1 |
| Guaranteed Rate, Inc. | 50 | 0 | 23 | 74.2 | .9 | 23.1 | 12.5 | 71.6 | 13.9 | 100.0 |
| Stearns Lending, Inc. | 46 | 6 | 18 | 58.0 | .7 | 35.2 | 16.3 | 63.5 | 24.6 | 100.0 |
| Shore Mortgage | 46 | 0 | 18 | 65.5 | 2.4 | 32.5 | 14.2 | 64.5 | 29.2 | 100.0 |
| EverBank | 41 | 5 | 8 | 77.4 | .6 | 21.8 | 12.6 | 64.4 | 20.4 | 90.4 |
| loanDepot.com | 36 | 2 | 3 | 50.6 | 1.0 | 18.3 | 14.0 | 55.0 | 32.4 | 100.0 |
| PHH Mortgage Co. | 35 | 49 | 6 | 52.9 | .8 | 26.6 | 10.1 | 61.3 | 11.3 | 99.9 |
| The Huntington National Bank | 34 | 1 | 9 | 74.7 | 1.3 | 29.6 | 10.0 | 88.5 | 7.0 | 75.4 |
| Guild Mortgage Co. | 32 | 4 | 20 | 37.8 | 3.8 | 38.3 | 19.4 | 62.0 | 23.8 | 99.9 |
| Top 25 institutions | 3,602 | 1,967 | 723 | 65.4 | 1.0 | 24.8 | 12.0 | 66.6 | 19.5 | 85.6 |
| All institutions | 8,707 | 2,794 | 2,615 | 62.0 | 2.9 | 28.4 | 12.7 | 70.2 | 18.5 | 85.2 |
1. See table 11, note 1. Return to table
2. Share of conventional loans that are higher priced. Return to table
3. See table 2, note 3. Return to table
4. See table 2, note 4. Return to table
5. See table 2, note 1. "Minority borrower" refers to nonwhite (excluding joint or missing) or Hispanic-white applicants. Return to table
6. See table 11, note 6. Return to table
(continued on next page)
| Respondent | Refinance loans1 | |||||||
|---|---|---|---|---|---|---|---|---|
| Number (thous- ands) |
Conven- tional |
Higher priced2 |
LMI borrow- er3 |
LMI neighbor- hood4 |
Non- Hispanic white5 |
Minority borrower5 |
Sold6 | |
| Wells Fargo Bank, NA | 467 | 78.1 | .5 | 16.6 | 12.6 | 70.3 | 18.1 | 91.6 |
| JPMorgan Chase Bank, NA | 287 | 85.9 | .7 | 27.1 | 13.5 | 68.8 | 18.1 | 94.2 |
| Quicken Loans, Inc. | 300 | 76.7 | 1.9 | 21.8 | 13.1 | 65.5 | 12.9 | 99.9 |
| Bank of America, NA | 249 | 88.5 | .2 | 27.8 | 14.5 | 62.7 | 21.5 | 80.1 |
| Citibank, NA | 175 | 97.5 | .1 | 28.1 | 13.6 | 64.3 | 14.2 | 96.0 |
| U.S. Bank, NA | 111 | 92.7 | 3.0 | 25.7 | 12.3 | 65.1 | 9.4 | 57.5 |
| PNC Bank, NA | 71 | 86.5 | .0 | 27.5 | 13.1 | 69.3 | 11.4 | 61.4 |
| Flagstar Bank, FSB | 61 | 79.4 | .5 | 15.6 | 10.7 | 66.1 | 24.0 | 99.9 |
| Nationstar Mortgage | 67 | 93.1 | 3.3 | 34.5 | 18.6 | 66.2 | 23.6 | 99.5 |
| SunTrust Mortgage, Inc. | 52 | 91.7 | .0 | 22.6 | 11.3 | 69.6 | 14.2 | 99.6 |
| Branch Banking and Trust Co. | 37 | 90.5 | .3 | 22.7 | 12.8 | 75.9 | 9.5 | 55.3 |
| Fifth Third Mortgage Co. | 51 | 60.5 | .9 | 17.6 | 12.7 | 66.9 | 11.3 | 98.3 |
| USAA Federal Savings Bank | 31 | 59.5 | .1 | 8.5 | 8.2 | 59.7 | 11.2 | 98.2 |
| Freedom Mortgage Group | 49 | 18.8 | .1 | 4.7 | 14.9 | 59.4 | 16.9 | 100.0 |
| Navy Federal Credit Union | 24 | 44.6 | .4 | 12.6 | 10.2 | 58.3 | 20.3 | 61.6 |
| PrimeLending | 13 | 85.0 | .8 | 19.8 | 10.1 | 75.1 | 12.1 | 99.9 |
| Regions Bank | 26 | 91.8 | 1.2 | 24.7 | 12.6 | 83.5 | 12.7 | 45.1 |
| Guaranteed Rate, Inc. | 20 | 91.7 | .2 | 13.0 | 8.8 | 76.1 | 10.0 | 100.0 |
| Stearns Lending, Inc. | 22 | 86.0 | .1 | 21.9 | 12.8 | 64.8 | 20.2 | 100.0 |
| Shore Mortgage | 22 | 89.2 | 1.1 | 20.2 | 10.3 | 73.2 | 19.1 | 100.0 |
| EverBank | 24 | 92.0 | .9 | 28.3 | 14.5 | 67.5 | 18.9 | 96.1 |
| loanDepot.com | 29 | 74.8 | .9 | 19.1 | 13.2 | 72.7 | 15.2 | 100.0 |
| PHH Mortgage Co. | 21 | 94.0 | 3.0 | 33.4 | 13.9 | 71.7 | 11.7 | 99.9 |
| The Huntington National Bank | 20 | 88.0 | 6.6 | 24.8 | 9.7 | 89.0 | 5.9 | 52.8 |
| Guild Mortgage Co. | 6 | 70.7 | 1.0 | 19.7 | 15.0 | 65.4 | 16.9 | 99.9 |
| Top 25 institutions | 2,237 | 82.1 | .9 | 22.5 | 13.1 | 67.5 | 16.3 | 89.2 |
| All institutions | 4,341 | 83.6 | 1.5 | 21.1 | 12.1 | 70.5 | 14.9 | 83.4 |
Appendix A: Requirements of Regulation C
Jump to:
The Federal Reserve Board's Regulation C requires lenders to report the following information on home-purchase and home-improvement loans and on refinancings:
For each application or loan
- application date and the date an action was taken on the application
- action taken on the application
- approved and originated
- approved but not accepted by the applicant
- denied (with the reasons for denial--voluntary for some lenders)
- withdrawn by the applicant
- file closed for incompleteness
- preapproval program status (for home-purchase loans only)
- preapproval request denied by financial institution
- preapproval request approved but not accepted by individual
- loan amount
- loan type
- conventional
- insured by the Federal Housing Administration
- guaranteed by the Department of Veterans Affairs
- backed by the Farm Service Agency or Rural Housing Service
- lien status
- first lien
- junior lien
- unsecured
- loan purpose
- home purchase
- refinance
- home improvement
type of purchaser (if the lender subsequently sold the loan during the year)
- Fannie Mae
- Ginnie Mae
- Freddie Mac
- Farmer Mac
- private securitization
- commercial bank, savings bank, or savings association
- life insurance company, credit union, mortgage bank, or finance company
- affiliate institution
- other type of purchaser
For each applicant or co-applicant
- race
- ethnicity
- sex
- income relied on in credit decision
For each property
- location, by state, county, metropolitan statistical area, and census tract
- type of structure
- one- to four-family dwelling
- manufactured home
- multifamily property (dwelling with ï¬ve or more units)
- occupancy status (owner occupied, non-owner occupied, or not applicable)
For loans subject to price reporting
- spread above comparable Treasury security for applications taken prior to October 1, 2010
- spread above average prime offer rate for applications taken on or after October 1, 2010
For loans subject to the Home Ownership and Equity Protection Act
- indicator of whether loan is subject to the Home Ownership and Equity Protection Act
Appendix B: Explaining Differences in Higher-Priced Lending with Additional Data
Lenders have much more information on the borrower and property to be purchased than is represented by the borrower's credit risk score. Using the Federal Reserve Bank of New York Consumer Credit Panel/Equifax data (CCP), we can construct variables that might help capture some of the types of information that lenders are likely to weigh in assessing risk and setting interest rates. At the borrower level, these variables include the following:
- Payment-to-income (PTI) ratio: The merged data set allowed us to observe other debts owed in addition to the mortgage matched in the enhanced database. PTI measures the yearly debt service payments on other loans the borrower has outstanding, as a fraction of the borrower's reported annual income (the income reported under the Home Mortgage Disclosure Act of 1975 (HMDA)). High ratios increase the likelihood the borrower will have difficulty affording all of the payments and thus default. The payments data are based on what lenders and servicers report to Equifax, which typically reflects the payment-due amount on monthly account statements. For mortgages, this amount may include payments for property taxes and insurance, if collected by the servicer (for nonmortgage debt, we use the scheduled payment amounts in the quarter prior to mortgage origination).46
- First-time borrower: This variable is an indicator for the mortgage being the first recorded mortgage in the borrower's credit history, suggesting the borrower is a first-time homebuyer. First-time homebuyers, because they tend to be younger and have had less time to build savings, are more likely to have a higher loan-to-value (LTV) ratio. However, first-time borrowers may also be less experienced financially and perhaps less likely to shop for a mortgage. In this case, first-time borrowers could pay more, independent of their LTV.
- "Piggyback" loan: The matched data allow us to observe all other mortgages the borrower has in addition to the matched mortgage. We identify piggyback loans as mortgages that were opened in the same month as the first-lien mortgage and were smaller in size. As noted in the main text, many borrowers during the housing boom used junior-lien loans to help finance more than 80 percent of the purchase price of the house. This variable may therefore also help indicate a high LTV ratio.
Note that the PTI ratios we calculated are likely to understate the PTI ratios used in underwriting for two main reasons. First, for joint mortgages, because we matched the credit record information of only one (randomly selected) borrower, the consumer debts and payments we calculated exclude individually held debts of other, unmatched co-borrowers. Second, nondebt obligations, such as child-support or alimony payments, may be included by underwriters in PTI calculations, but such obligations are not available in credit record data and thus could not be included in our calculations.
We regressed a binary indicator for a higher-priced loan against indicators for the race and ethnicity of the borrower, credit score "bins," the HMDA controls, and the additional variables just discussed. The estimates are very similar to the final row in table 9, with black and Hispanic-white borrowers about 13 percent and 16 percent more likely, respectively, to have a higher-priced loan (table B.1, first column of estimates). The additional CCP variables did little to explain the racial and ethnic disparities.
The second column includes the additional control variables as well as census-tract fixed effects. A comparison of borrowers within the same census tract indicates that black and Hispanic-white borrowers are over 12 percent and over 10 percent, respectively, more likely than non-Hispanic white borrowers to get a higher-priced loan. The differences between the first and second columns stemming from the inclusion of census-tract fixed effects could reflect the geographic distribution of borrower risk factors or differences in the local supply of credit (due either to market forces or to a "redlining" type of discrimination). Regardless, a significant portion of the between-group differences in higher-priced lending remains to be explained.
The third column includes the borrower-level controls and a lender-level fixed effect. The coefficients on race and ethnicity now indicate the average difference in pricing between groups borrowing from the same lender. Controlling for lender identity reduces the black and Hispanic-white coefficients, now estimated at 6.0 percent and 6.9 percent, respectively. The reduction in the coefficients indicates that minority borrowers tend to get loans from institutions that often make higher-priced loans (regardless of the race or ethnicity of the given customer).
There could be multiple reasons that minorities tend to obtain loans from a particular set of lenders. One might be that, because of differing financial circumstances, minority borrowers are more likely to prefer certain types of loans offered by higher-priced lenders. Less sanguine explanations are also possible. For example, if there is discrimination in the acceptance decision by lower-cost lenders, minorities might then be more likely to turn to higher-priced lenders. Why different groups tend to use different types of lenders is an important question for further research.
| Independent variable | Outcome: indicator of higher-priced loan | ||
|---|---|---|---|
| Minority status 1 | |||
| Asian | -0.003 | 0.005 | -0.003 |
| (0.006) | (0.007) | (0.005) | |
| Black or African American | 0.129** | 0.120** | 0.060** |
| (0.005) | (0.007) | (0.004) | |
| Other minority 2 | 0.043** | 0.039* * | 0.024* |
| (0.012) | (0.016) | (0.010) | |
| Hispanic white | 0.164** | 0.106** | 0.069** ** |
| (0.004) | (0.007) | (0.004) | |
| Additional controls | |||
| Borrower characteristics | Yes | Yes | Yes |
| Tract fixed effects | No | Yes | No |
| Lender fixed effects | No | No | Yes |
Note: Table shows ordinary least squares regression results using conventional first-lien home-purchase mortgages for owner-occupied, one- to four-family, site-built homes. For a description of how borrowers are categorized by race and ethnicity, see table 2, note 1. Standard errors in parentheses.
1. See table 2, note 1. Return to table
2. See table 2, note 2. Return to table
*Significant at the 5 percent level. Return to table
**Significant at the 1 percent level. Return to table
Source: FFIEC HMDA data matched to FRBNY Consumer Credit Panel/Equifax data.
Errata
The authors revised this article on September 3, 2015, to correct the following:
In table 6.B, all data in the column labeled "2009" have been revised. Specifically, the following corrections have been made:
- Home purchase, Conventional and nonconventional, All applicants, has been revised from 2.4 percent to 1.3 percent.
- Home purchase, Conventional and nonconventional, Asian, has been revised from 1.2 percent to 0.5 percent.
- Home purchase, Conventional and nonconventional, Black or African American, has been revised from 3.5 percent to 1.3 percent.
- Home purchase, Conventional and nonconventional, Other minority, has been revised from 3.0 percent to 1.4 percent.
- Home purchase, Conventional and nonconventional, Hispanic white, has been revised from 4.0 percent to 1.4 percent.
- Home purchase, Conventional and nonconventional, Non-Hispanic white, has been revised from 2.3 percent to 1.4 percent.
- Home purchase, Conventional only, All applicants, has been revised from 3.1 percent to 2.3 percent.
- Home purchase, Conventional only, Asian, has been revised from 1.0 percent to 0.6 percent.
- Home purchase, Conventional only, Black or African American, has been revised from 5.8 percent to 4.0 percent.
- Home purchase, Conventional only, Other minority, has been revised from 4.9 percent to 3.7 percent.
- Home purchase, Conventional only, Hispanic white, has been revised from 6.9 percent to 4.6 percent.
- Home purchase, Conventional only, Non-Hispanic white, has been revised from 3.2 percent to 2.6 percent.
- Home purchase, Nonconventional only, All applicants, has been revised from 1.8 percent to 0.4 percent.
- Home purchase, Nonconventional only, Asian, has been revised from 1.6 percent to 0.2 percent.
- Home purchase, Nonconventional only, Black or African American, has been revised from 3.0 percent to 0.7 percent.
- Home purchase, Nonconventional only, Other minority, has been revised from 2.1 percent to 0.3 percent.
- Home purchase, Nonconventional only, Hispanic white, has been revised from 3.1 percent to 0.4 percent.
- Home purchase, Nonconventional only, Non-Hispanic white, has been revised from 1.5 percent to 0.3 percent.
- Refinance, Conventional and nonconventional, All applicants, has been revised from 2.0 percent to 1.4 percent.
- Refinance, Conventional and nonconventional, Asian, has been revised from 0.4 percent to 0.2 percent.
- Refinance, Conventional and nonconventional, Black or African American, has been revised from 5.3 percent to 3.5 percent.
- Refinance, Conventional and nonconventional, Other minority, has been revised from 3.0 percent to 2.1 percent.
- Refinance, Conventional and nonconventional, Hispanic white, has been revised from 3.8 percent to 2.5 percent.
- Refinance, Conventional and nonconventional, Non-Hispanic white, has been revised from 2.0 percent to 1.4 percent.
- Refinance, Conventional only, All applicants, has been revised from 1.9 percent to 1.5 percent.
- Refinance, Conventional only, Asian, has been revised from 0.3 percent to 0.2 percent.
- Refinance, Conventional only, Black or African American, has been revised from 7.5 percent to 6.3 percent.
- Refinance, Conventional only, Other minority, has been revised from 3.4 percent to 2.8 percent.
- Refinance, Conventional only, Hispanic white, has been revised from 4.5 percent to 3.5 percent.
- Refinance, Conventional only, Non-Hispanic white, has been revised from 1.9 percent to 1.6 percent.
- Refinance, Nonconventional only, All applicants, has been revised from 2.6 percent to 0.5 percent.
- Refinance, Nonconventional only, Asian, has been revised from 1.6 percent to 0.3 percent.
- Refinance, Nonconventional only, Black or African American, has been revised from 3.5 percent to 1.1 percent.
- Refinance, Nonconventional only, Other minority, has been revised from 1.9 percent to 0.4 percent.
- Refinance, Nonconventional only, Hispanic white, has been revised from 2.7 percent to 0.8 percent.
- Refinance, Nonconventional only, Non-Hispanic white, has been revised from 2.4 percent to 0.5 percent.
Under the heading "Lending Institutions," the first and second paragraphs have been revised. Also, a new note 42 has been inserted at the bottom of the page. Specifically, the following corrections have been made:
- In the first paragraph, the first sentence has been revised from "In 2013, there were . . . 4,216 banks and thrifts (hereafter, banks), . . . 2,015 credit unions" to "In 2013, there were . . . 4,212 banks and thrifts (hereafter, banks), . . . 2,019 credit unions." Also, a new note number ("42") has been added at the end of the first sentence.
- In the second paragraph, the second sentence has been revised from "Over one-third of institutions (2,615 out of 7,190) reported fewer than 100 mortgage originations in 2013, accounting for only about 111,000 originations, or 1.3 percent of all originations" to "Over one-third of institutions (3,173 out of 7,190) reported fewer than 100 mortgage originations in 2013, accounting for only about 128,000 originations, or 1.5 percent of all originations." Also, the third sentence has been revised from "Over 10 percent of institutions originated fewer than 25 loans, accounting for about one-tenth of 1 percent of all originations" to "Over 16 percent of institutions originated fewer than 25 loans, accounting for about one-fifth of 1 percent of all originations."
- At the bottom of the page, a new note 42 has been added: "Reporting institutions are assigned to a category in the following manner: All lenders that report to the Department of Housing and Urban Development are categorized as independent mortgage companies. All lenders reporting to the National Credit Union Administration are credit unions. In addition, four large credit unions that reported to the Consumer Financial Protection Bureau were identified by their charter type (not available in the public HMDA data). All other lenders are banks or bank subsidiaries. Data users can distinguish between depositories and nondepository subsidiaries using variables available in the HMDA Reporter Panel." Note that, as a result of this insertion, old notes 42, 43, 44, and 45 have been renumbered to become notes 43, 44, 45, and 46, respectively.
In table 11, most data in the columns labeled "Bank" and "Credit union" and some data in the columns labeled "Bank subsidiary," "Independent mortgage company," and "All" have been revised. Specifically, the following corrections have been made in each column:
-
"Bank" column
- Number of institutions has been revised from 4,216 to 4,212.
- Applications (thousands) have been revised from 7,354 to 7,188.
- Originations (thousands) have been revised from 4,731 to 4,628.
- Purchases (thousands) have been revised from 1,967 to 1,964.
- Number of institutions with fewer than 100 loans has been revised from 1,654 to 1,994.
- Number of institutions with fewer than 100 loans, Originations (thousands), have been revised from 72.0 to 81.6.
- Number of institutions with fewer than 25 loans has been revised from 523 to 709.
- Number of institutions with fewer than 25 loans, Originations (thousands), have been revised from 6.4 to 8.5.
- Home-purchase loans (thousands) have been revised from 1,152 to 1,122.
- Home-purchase loans (thousands), Conventional, has been revised from 72.0 percent to 72.2 percent.
- Home-purchase loans (thousands), Higher-priced share of conventional loans, has been revised from 3.7 percent to 3.6 percent.
- Home-purchase loans (thousands), Non-Hispanic white, has been revised from 72.5 percent to 72.8 percent.
- Home-purchase loans (thousands), Within CRA assessment area, has been revised from 67.0 percent to 68.7 percent.
- Home-purchase loans (thousands), Sold, has been revised from 74.1 percent to 75.0 percent.
- Refinance loans (thousands) have been revised from 2,438 to 2,388.
- Refinance loans (thousands), Conventional, has been revised from 87.7 percent to 88.0 percent.
- Refinance loans (thousands), Higher-priced share of conventional loans, has been revised from 1.6 percent to 1.5 percent.
- Refinance loans (thousands), LMI borrower, has been revised from 22.1 percent to 22.2 percent.
- Refinance loans (thousands), Non-Hispanic white, has been revised from 71.5 percent to 71.7 percent.
- Refinance loans (thousands), Within CRA assessment area, has been revised from 67.8 percent to 69.2 percent.
- Refinance loans (thousands), Sold, has been revised from 79.0 percent to 79.6 percent.
-
"Bank subsidiary" column
- Number of institutions with fewer than 100 loans has been revised from 26 to 28.
- Number of institutions with fewer than 100 loans, Originations (thousands), have been revised from 0.9 to 0.8.
- Number of institutions with fewer than 25 loans has been revised from 10 to 16.
- Number of institutions with fewer than 25 loans, Originations (thousands), have been revised from 0.1 to 0.2.
-
"Credit union" column
- Number of institutions has been revised from 2,015 to 2,019.
- Applications (thousands) have been revised from 993 to 1,159.
- Originations (thousands) have been revised from 611 to 714.
- Purchases (thousands) have been revised from 18 to 20.
- Number of institutions with fewer than 100 loans has been revised from 874 to 1,072.
- Number of institutions with fewer than 100 loans, Originations (thousands), have been revised from 36.1 to 42.0.
- Number of institutions with fewer than 25 loans has been revised from 296 to 401.
- Number of institutions with fewer than 25 loans, Originations (thousands), have been revised from 3.6 to 5.0.
- Home-purchase loans (thousands) have been revised from 127 to 157.
- Home-purchase loans (thousands), Conventional, has been revised from 91.3 percent to 86.3 percent.
- Home-purchase loans (thousands), Higher-priced share of conventional loans, has been revised from 3.9 percent to 4.4 percent.
- Home-purchase loans (thousands), LMI borrower, has been revised from 28.8 percent to 27.7 percent.
- Home-purchase loans (thousands), LMI neighborhood, has been revised from 12.5 percent to 12.6 percent.
- Home-purchase loans (thousands), Non-Hispanic white, has been revised from 74.2 percent to 72.1 percent.
- Home-purchase loans (thousands), Minority borrower, has been revised from 11.8 percent to 12.8 percent.
- Home-purchase loans (thousands), Sold, has been revised from 55.4 percent to 52.9 percent.
- Refinance loans (thousands) have been revised from 311 to 361.
- Refinance loans (thousands), Conventional, has been revised from 98.8 percent to 95.0 percent.
- Refinance loans (thousands), LMI borrower, has been revised from 24.2 percent to 23.0 percent.
- Refinance loans (thousands), LMI neighborhood, has been revised from 12.4 percent to 12.3 percent.
- Refinance loans (thousands), Non-Hispanic white, has been revised from 74.6 percent to 72.8 percent.
- Refinance loans (thousands), Minority borrower, has been revised from 10.9 percent to 11.9 percent.
- Refinance loans (thousands), Sold, has been revised from 44.1 percent to 44.7 percent.
-
"Independent mortgage company" column
- Number of institutions with fewer than 100 loans has been revised from 61 to 79.
- Number of institutions with fewer than 100 loans, Originations (thousands), have been revised from 2.4 to 3.0.
- Number of institutions with fewer than 25 loans has been revised from 20 to 31.
- Number of institutions with fewer than 25 loans, Originations (thousands), have been revised from 0.2 to 0.4.
-
"All" column
- Number of institutions with fewer than 100 loans has been revised from 2,615 to 3,173.
- Number of institutions with fewer than 100 loans, Originations (thousands), have been revised from 111.4 to 127.5.
- Number of institutions with fewer than 25 loans has been revised from 849 to 1,157.
- Number of institutions with fewer than 25 loans, Originations (thousands), have been revised from 10.3 to 14.0.
Under the heading "Lending Institutions," in the fifth paragraph, the second sentence has been revised from ". . . compared with just 12 percent of the borrowers at credit unions" to ". . . compared with just 13 percent of the borrowers at credit unions."
1. In the 2013 HMDA data, property locations incorporate the census-tract geographic boundaries created for the 2010 decennial census. The 2013 HMDA data do not reflect recent updates to the list of metropolitan statistical areas (MSAs) published by the Office of Management and Budget. HMDA reporters will use the updated list of MSAs in preparing their 2014 HMDA data. For further information, see Federal Financial Institutions Examination Council (2013), "OMB Announcement--Revised Delineations of MSAs," press release, February 28, www.ffiec.gov/hmda/OMB_MSA.htm. Return to text
2. A brief history of HMDA is available at Federal Financial Institutions Examination Council, "History of HMDA," webpage, www.ffiec.gov/hmda/history2.htm. Return to text
3. On July 21, 2011, rulemaking responsibility for HMDA was transferred from the Federal Reserve Board to the newly established Consumer Financial Protection Bureau. The Federal Financial Institutions Examination Council (FFIEC; www.ffiec.gov) continues to be responsible for collecting the HMDA data from reporting institutions and facilitating public access to the information. In September of each year, the FFIEC releases to the public summary disclosure tables pertaining to lending activity from the previous calendar year for each reporting lender as well as aggregations of home-lending activity for each metropolitan statistical area and for the nation as a whole. The FFIEC also makes available to the public a data file containing virtually all of the reported information for each lending institution as well as a file that includes key demographic and housing-related data for each census tract drawn from census sources. Return to text
4. For more information on economic conditions during 2013, see Board of Governors of the Federal Reserve System (2014), Monetary Policy Report (Washington: Board of Governors, February 11), www.federalreserve.gov/monetarypolicy/mpr_default.htm. Return to text
5. For additional details on the ability-to-repay and qualified mortgage rules, see Consumer Financial Protection Bureau, "Ability to Repay and Qualified Mortgage Standards under the Truth in Lending Act (Regulation Z)," webpage, www.consumerfinance.gov/regulations/ability-to-repay-and-qualified-mortgage-standards-under-the-truth-in-lending-act-regulation-z. Return to text
6. Some lenders file amended HMDA reports, which are not reflected in the initial public data release. A final HMDA data set containing these changes is created two years following the initial data release. The data used to prepare this article are drawn from the initial public release for 2013 and from the final HMDA data set for years prior to that. Consequently, numbers in this article for the years 2012 and earlier may differ somewhat from numbers calculated from the initial public release files. Return to text
7. For more information on the data set, see Neil Bhutta and Glenn B. Canner (2013), "Mortgage Market Conditions and Borrower Outcomes: Evidence from the 2012 HMDA Data and Matched HMDA-Credit Record Data," Federal Reserve Bulletin, vol. 99 (November), pp. 1-58, www.federalreserve.gov/pubs/bulletin/2013/default.htm. Return to text
8. The HMDA data prior to 2004 did not provide lien status for loans, and thus the number of loans prior to 2004 includes both first- and junior-lien loans. That said, including junior-lien home-purchase loans in 2013 does not change the conclusion that home-purchase lending in 2013 was below that in 1993. It should also be noted that, because HMDA coverage has expanded over time, in part because of significantly more counties being included in metropolitan statistical areas now than in the early 1990s, the lower loan volume in 2013 relative to 1993 is understated. Return to text
9. Manufactured-home lending differs from lending on site-built homes, in part because most of the homes are sold without land and are treated as chattel-secured lending, which typically carries higher interest rates and shorter terms to maturity than those on loans to purchase site-built homes (for pricing information on manufactured-home loans, see table 7). This article focuses almost entirely on site-built mortgage originations, which constitute the vast majority of originations (as shown in table 1). That said, it is important to keep in mind that, because manufactured homes typically are less expensive than site-built homes, they provide a low-cost housing option for households with more moderate incomes. Return to text
10. Junior liens could also be used to keep the first lien within the GSEs' conforming loan-size limit while the combined LTV ratio is at or below 80 percent. Return to text
11. For a more detailed discussion of the post-crisis rise in government-backed lending, see Robert B. Avery,
Neil Bhutta, Kenneth P. Brevoort, and Glenn B. Canner (2010), "The 2009 HMDA Data: The Mortgage Market in a Time of Low Interest Rates and Economic Distress," Federal Reserve Bulletin, vol. 96 (December),
pp. A39-A77, www.federalreserve.gov/pubs/bulletin/2010/default.htm. Return to text
12. Under the regulations that govern HMDA reporting, many standalone junior-lien loans are not reported because either the lender does not know the purpose of the loan or the reasons cited for the loan are not ones that trigger a reporting requirement. Unless a junior lien is used for home purchase or explicitly for home improvements, or to refinance an existing lien, it is not reported under HMDA. Further, home equity lines of credit, many of which are junior liens and could also be used to help purchase a home, do not have to be reported in the HMDA data regardless of the purpose of the loan. Return to text
13. For time-series data on PMI issuance through 2012, see Bhutta and Canner (2013), "Mortgage Market Conditions and Borrower Outcomes," in note 7. Return to text
14. Changes to the FHA's upfront and annual MIPs over time have been documented in Urban Institute, Housing Finance Policy Center (2014), Housing Finance at a Glance: A Monthly Chartbook (Washington: Urban Institute, March), www.urban.org/publications/413061.html  . A typical FHA home-purchase loan has an LTV of over 95 percent and a loan term in excess of 15 years. The upfront premium, on net, was unchanged between 2010 and 2013; it was briefly increased from 1.75 percent to 2.25 percent and lowered back to 1.00 percent in 2010, and then it was raised back to 1.75 percent in 2012. Return to text
15. Reporters can, but are not required to, report preapproval requests that they approve but are not acted on by the potential borrower. Return to text
16. For example, the number of home-purchase loans to Asians in 2013 was about 149,000, derived by multiplying 2.615 million loans by 5.7 and dividing by 100. Return to text
17. LMI borrowers have incomes of less than 80 percent of estimated contemporaneous area median family income (AMFI), middle-income borrowers have incomes of at least 80 percent and less than 120 percent of AMFI, and high-income borrowers have incomes of at least 120 percent of AMFI. These definitions are identical to those adopted in the rules implementing the Community Reinvestment Act. Return to text
18. Definitions for LMI, middle-income, and high-income neighborhoods are identical to those for LMI, middle-income, and high-income borrowers but are based on the ratio of census-tract median family income to area median family income measured from the 2006-10 American Community Survey data for 2012 and 2013 and from the 2000 census for 2004-11. Return to text
19. For more information on the transition to the new census-tract data, see Robert B. Avery, Neil Bhutta,
Kenneth P. Brevoort, and Glenn B. Canner (2012), "The Mortgage Market in 2011: Highlights from the Data Reported under the Home Mortgage Disclosure Act," Federal Reserve Bulletin,vol. 98 (December), pp. 1-46, www.federalreserve.gov/pubs/bulletin/2012/default.htm. Return to text
20. Findings of the Federal Reserve Board's Survey of Consumer Finances for 2010 indicate that liquid asset levels and financial wealth holdings for minorities and lower-income groups are substantially smaller than they are for non-Hispanic whites or higher-income populations. See Board of Governors of the Federal Reserve System, "2010 Survey of Consumer Finances," webpage, www.federalreserve.gov/econresdata/scf/scf_2010.htm. Return to text
21. See, for example, Glenn B. Canner, Stuart A. Gabriel, and J. Michael Woolley (1991), "Race, Default Risk and Mortgage Lending: A Study of the FHA and Conventional Loan Markets," Southern Economic Journal, vol. 58 (July), pp. 249-62. Return to text
22. The nonconventional share of refinance loans is lower than expected for the groups categorized by borrower income because, in most nonconventional refinance loans, income is not reported. Thus, when income is reported on a refinance loan, the loan is likely to be conventional. Return to text
23. Denial rates are calculated as the number of denied loan applications divided by the total number of applications, excluding withdrawn applications and application files closed for incompleteness. Return to text
24. The Interagency Fair Lending Examination Procedures are available at www.ffiec.gov/PDF/fairlend.pdf. Return to text
25. For more information about the rule changes related to higher-priced lending and the ways in which they affect the incidence of reported higher-priced lending over time, see Avery and others, "The 2009 HMDA Data," in note 11. Return to text
26. See Freddie Mac, "Mortgage Rates Survey," webpage, www.freddiemac.com/pmms
; and Federal Financial Institutions Examination Council, "FFIEC Rate Spread Calculator," webpage, www.ffiec.gov/ratespread/newcalc.aspx.Return to text
27. Lenders report the date on which they took action on an application, although this information is not released in the public HMDA data files. For originations, the "action date" is the closing date or date of origination for the loan. This date is used to compile data at the monthly level. Return to text
28. As shown in table 7, almost no VA or FSA/RHS loans were higher priced in 2013. Return to text
29. While lengthening the term over which the MIP must be paid does not affect the monthly cost a borrower faces initially, it does change the potential lifetime cost of the loan and thus the APR. The ultimate cost of the loan will depend on how long the borrower holds the loan. If borrowers end up holding these loans even after the LTV drops below 78 percent, the loans will prove to be more expensive than in the absence of the policy change. Return to text
30. See U.S. Department of Housing and Urban Development (2012), "FHA Announces Price Cuts to Encourage Streamline Refinancing," press release, March 6, http://portal.hud.gov/hudportal/HUD?src=/press/press_releases_media_advisories/2012/HUDNo.12-045. Return to text
31. When the demand for a fixed-income security such as a Treasury bond increases, the price of the bond rises and its yield falls. When investors' demand for Treasury securities rises more than their demand for mortgage securities, the interest rate on Treasury securities falls relative to the interest rate on mortgages, thus increasing the spread between the two. Return to text
32. For a more detailed discussion of this adjustment technique, see Avery and others, "The 2009 HMDA Data," in note 11. Return to text
33. For further information about credit records, see Robert B. Avery, Paul S. Calem, Glenn B. Canner, and Raphael W. Bostic (2003), "An Overview of Consumer Data and Credit Reporting," Federal Reserve Bulletin, vol. 89 (February), pp. 47-73, www.federalreserve.gov/pubs/bulletin/2003/0203lead.pdf. Return to text
34. Other researchers have found a similar black-white difference in the selection into the subprime lending market after controlling for a richer set of borrower characteristics, including the LTV ratio and the full documentation status of the application. See, for example, Marsha J. Courchane (2007), "The Pricing of Home Mortgage Loans to Minority Borrowers: How Much of the APR Differential Can We Explain?" Journal of Real Estate Research, vol. 29 (October-December), pp. 399-439; and Marvin M. Smith and Christy Chung Hevener (2014), "Subprime Lending over Time: The Role of Race," Journal of Economics and Finance, vol. 38 (April),
pp. 321-44. Return to text
35. For further details, see Donghoon Lee and Wilbert van der Klaauw (2010), "An Introduction to the FRBNY Consumer Credit Panel," Federal Reserve Bank of New York Staff Reports 479 (New York: Federal Reserve Bank of New York, November), www.newyorkfed.org/research/staff_reports/sr479.html
. Return to text
36. The sampling approach is designed to generate the same entry and exit behavior as is present in the population, with young individuals and immigrants entering the sample and deceased individuals and emigrants leaving the sample each quarter at the same rate as in the U.S. population, such that each quarterly snapshot continues to be nationally representative. Return to text
37. The credit score included in the CCP is generated from the Equifax Risk Score 3.0 model. This credit score is generated from a general-purpose risk model that predicts the likelihood an individual will become 90 days or more delinquent on any account within 24 months after the score is calculated. The Equifax Risk Score 3.0 ranges from 280 to 850, with a higher score corresponding to lower relative risk (for more information, see www.equifax.com
). Although a given lender may have used a different score in underwriting a loan, it is likely that the scores used here are highly correlated with the scores used in underwriting. Return to text
38. We direct readers interested in the details of the matching process to Bhutta and Canner, "Mortgage Market Conditions and Borrower Outcomes," in note 7 (see especially appendix B, "Matching HMDA Records with Credit Bureau Records"). Return to text
39. The reasons are discussed in Bhutta and Canner, "Mortgage Market Conditions and Borrower Outcomes," in note 7. Return to text
40. These differences are similar, but not identical, to those shown in table 6.A. The differences are attributable to the matched data set not being perfectly representative of the HMDA data. Return to text
41. We run standard multivariate linear regressions in order to control for other factors that might be correlated with race and the likelihood of getting a higher-priced loan. The HMDA controls include indicator variables for various borrower groups defined by income, loan amount, presence of a co-applicant, month of origination, and local metropolitan statistical area. This procedure is similar to that used in Robert B. Avery, Kenneth P. Brevoort, and Glenn B. Canner (2007), "The 2006 HMDA Data," Federal Reserve Bulletin, vol. 93 (December), pp. A73-A109, www.federalreserve.gov/pubs/bulletin/2007/07index.htm. Return to text
42. Reporting institutions are assigned to a category in the following manner: All lenders that report to the Department of Housing and Urban Development are categorized as independent mortgage companies. All lenders reporting to the National Credit Union Administration are credit unions. In addition, four large credit unions that reported to the Consumer Financial Protection Bureau were identified by their charter type (not available in the public HMDA data). All other lenders are banks or bank subsidiaries. Data users can distinguish between depositories and nondepository subsidiaries using variables available in the HMDA Reporter Panel. Return to text
43. Under HMDA, lenders report whether a loan they originated was also sold within the calendar year and some information regarding the institution to which it was sold (for example, Fannie Mae, Freddie Mac, Ginnie Mae, a bank, a life insurance company, and so on; see appendix A for a full list). Because lenders report a loan as sold only if the sale occurs within the same year as origination, the incidence of loan sales tends to decline for loans originated toward the end of the year. For that reason, in tables 11 and 12, we report the incidence of loan sales only for loans originated within the first three quarters of the year. Return to text
44. The Reporter Panel and Transmittal Sheets provide information for each HMDA reporting institution
and are available on the Federal Financial Institutions Examination Council's website at www.ffiec.gov/hmda/hmdaflat.htm. Return to text
45. Note that for lenders with a significant nonconventional share of refinance loans (for example, Freedom Mortgage Group), borrower income may not be reported for most loans, thus pushing down the LMI share of borrowers. Return to text
46. Note that the PTI ratios we calculated are likely to understate the PTI ratios used in underwriting for two main reasons. First, for joint mortgages, because we matched the credit record information of only one (randomly selected) borrower, the consumer debts and payments we calculated exclude individually held debts of other, unmatched co-borrowers. Second, nondebt obligations, such as child-support or alimony payments, may be included by underwriters in PTI calculations, but such obligations are not available in credit record data and thus could not be included in our calculations. Return to text