

 DDP
DDP Print
PrintIndustrial Production and Capacity Utilization - G.17
Current Release (250 KB PDF) (ASCII)
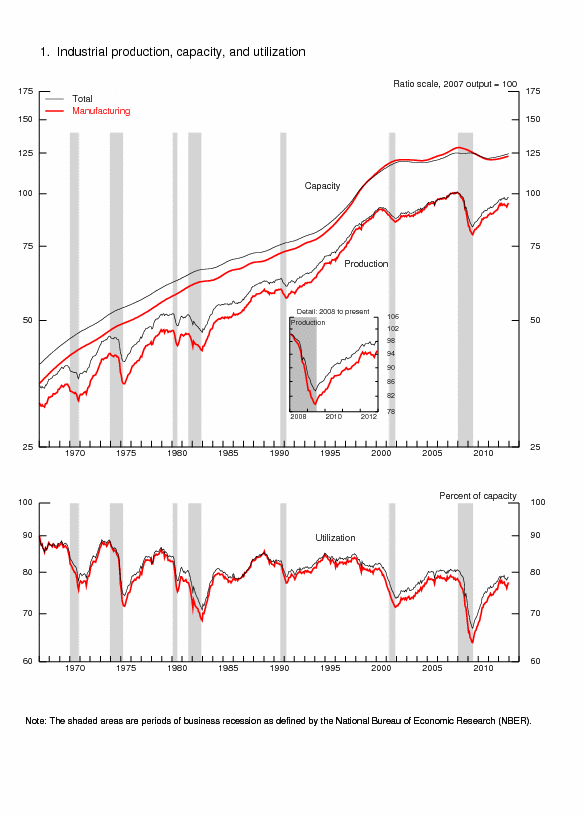
Industrial production increased 0.3 percent in December after having risen 1.0 percent in November when production rebounded in the industries that had been negatively affected by Hurricane Sandy in late October. For the fourth quarter as a whole, total industrial production moved up at an annual rate of 1.0 percent. Manufacturing output advanced 0.8 percent in December following a gain of 1.3 percent in November; production edged up at an annual rate of 0.2 percent in the fourth quarter. The output at mines rose 0.6 percent in December, and the output of utilities fell 4.8 percent as unseasonably warm weather held down the demand for heating. At 98.1 percent of its 2007 average, total industrial production in December was 2.2 percent above its year-earlier level. Capacity utilization for total industry moved up 0.1 percentage point to 78.8 percent, a rate 1.5 percentage points below its long-run (1972--2011) average.
Industrial Production and Capacity Utilization: Summary
| Industrial production | 2007=100 | Percent change | |||||||||||
|---|---|---|---|---|---|---|---|---|---|---|---|---|---|
| 2012 | 2012 | Dec. '11 to Dec. '12 |
|||||||||||
| July[r] | Aug.[r] | Sept.[r] | Oct.[r] | Nov.[r] | Dec.[p] | July[r] | Aug.[r] | Sept.[r] | Oct.[r] | Nov.[r] | Dec.[p] | ||
| Total index | 97.9 | 97.0 | 97.2 | 96.8 | 97.8 | 98.1 | .7 | -1.0 | .2 | -.3 | 1.0 | .3 | 2.2 |
| Previous estimates | 97.9 | 97.0 | 97.1 | 96.5 | 97.5 | .7 | -1.0 | .2 | -.7 | 1.1 | |||
| Major market groups | |||||||||||||
| Final Products | 97.4 | 96.5 | 96.8 | 95.9 | 96.9 | 97.2 | .4 | -.9 | .3 | -.9 | 1.1 | .3 | 2.7 |
| Consumer goods | 93.8 | 92.9 | 93.3 | 92.6 | 93.4 | 93.4 | .4 | -1.0 | .4 | -.7 | .9 | -.1 | .9 |
| Business equipment | 105.0 | 104.2 | 104.0 | 102.6 | 104.6 | 106.0 | .2 | -.8 | -.2 | -1.3 | 2.0 | 1.3 | 8.7 |
| Nonindustrial supplies | 87.2 | 86.7 | 86.7 | 86.2 | 87.1 | 87.3 | .0 | -.6 | .0 | -.5 | 1.1 | .2 | 1.3 |
| Construction | 79.0 | 78.9 | 79.3 | 79.1 | 80.9 | 81.6 | -.8 | -.2 | .5 | -.2 | 2.2 | 1.0 | 2.3 |
| Materials | 102.2 | 101.0 | 101.2 | 101.4 | 102.4 | 102.7 | 1.1 | -1.1 | .2 | .2 | 1.0 | .3 | 2.2 |
| Major industry groups | |||||||||||||
| Manufacturing (see note below) | 94.6 | 93.8 | 93.9 | 93.1 | 94.3 | 95.1 | .3 | -.9 | .1 | -.9 | 1.3 | .8 | 2.4 |
| Previous estimates | 94.6 | 93.8 | 93.8 | 92.9 | 94.0 | .3 | -.8 | .1 | -1.0 | 1.1 | |||
| Mining | 113.0 | 112.1 | 113.8 | 115.2 | 115.5 | 116.3 | 1.3 | -.8 | 1.5 | 1.3 | .3 | .6 | 3.3 |
| Utilities | 102.8 | 100.6 | 99.7 | 101.0 | 101.2 | 96.4 | 2.9 | -2.2 | -.8 | 1.2 | .2 | -4.8 | -.3 |
| Capacity utilization | Percent of capacity | Capacity growth |
|||||||||||
|---|---|---|---|---|---|---|---|---|---|---|---|---|---|
| Average 1972- 2011 |
1988- 89 high |
1990- 91 low |
1994- 95 high |
2009 low |
2011 Dec. |
||||||||
| 2012 | Dec. '11 to Dec. '12 |
||||||||||||
| July[r] | Aug.[r] | Sept.[r] | Oct.[r] | Nov.[r] | Dec.[p] | ||||||||
| Total industry | 80.3 | 85.2 | 78.8 | 85.0 | 66.8 | 78.3 | 79.2 | 78.3 | 78.4 | 78.0 | 78.7 | 78.8 | 1.6 |
| Previous estimates | 79.2 | 78.3 | 78.3 | 77.7 | 78.4 | ||||||||
| Manufacturing (see note below) | 78.8 | 85.6 | 77.3 | 84.6 | 63.8 | 76.8 | 77.5 | 76.8 | 76.7 | 76.0 | 76.9 | 77.4 | 1.5 |
| Previous estimates | 77.5 | 76.8 | 76.7 | 75.9 | 76.6 | ||||||||
| Mining | 87.3 | 86.3 | 83.9 | 88.6 | 78.5 | 91.0 | 90.2 | 89.3 | 90.5 | 91.4 | 91.5 | 91.9 | 2.3 |
| Utilities | 86.3 | 92.9 | 84.3 | 93.3 | 79.1 | 73.7 | 77.4 | 75.6 | 74.8 | 75.6 | 75.6 | 71.8 | 2.4 |
| Stage-of-process groups | |||||||||||||
| Crude | 86.3 | 87.7 | 84.4 | 89.7 | 76.4 | 88.6 | 87.9 | 87.3 | 88.2 | 88.7 | 88.8 | 89.1 | 1.7 |
| Primary and semifinished | 81.1 | 86.5 | 78.0 | 87.9 | 64.2 | 75.1 | 76.5 | 75.6 | 75.2 | 75.2 | 76.0 | 75.6 | .1 |
| Finished | 77.2 | 83.4 | 77.3 | 80.6 | 66.8 | 77.5 | 78.3 | 77.4 | 77.5 | 76.4 | 77.1 | 77.7 | 3.6 |
Market Groups
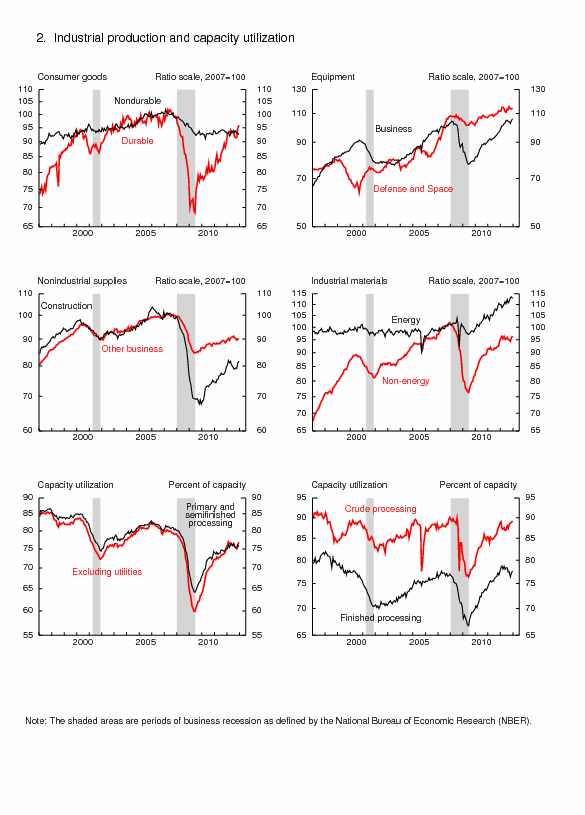
The production of consumer goods edged down 0.1 percent in December and declined at an annual rate of 0.9 percent in the fourth quarter. The output of durable consumer goods increased 1.2 percent in December, as gains in automotive products and in home electronics more than offset declines in the indexes for appliances, furniture, and carpeting and for miscellaneous durable goods. The output of nondurable consumer goods decreased 0.5 percent in December. The decline was concentrated in the production of consumer energy products, which fell 4.4 percent. Among non-energy nondurables, output increased in all major categories, with gains of more than 1 percent in the indexes for clothing, for chemical products, and for paper products.
The output of business equipment moved up 1.3 percent in December following a rise of 2.0 percent in November, but it was little changed for the fourth quarter as a whole. All major categories of business equipment advanced in December. For the fourth quarter, the production of transit equipment moved up at an annual rate of 6.5 percent. The indexes both for information processing equipment and for industrial and other equipment decreased at an annual rate of 2.3 percent in the fourth quarter.
The index for defense and space equipment increased 0.4 percent in December, but it declined at an annual rate of 0.5 percent in the fourth quarter. Output in December was 2.2 percent above its year-earlier level.
Among nonindustrial supplies, the index for construction supplies gained 1.0 percent in December after having moved up more than 2 percent in November. For the fourth quarter, the output of construction supplies advanced at an annual rate of nearly 8 percent. The production of business supplies edged down 0.2 percent in December and declined at an annual rate of 3.2 percent in the fourth quarter.
The output of materials to be processed further in the industrial sector rose 0.3 percent in December and advanced at an annual rate of 2.9 percent in the fourth quarter. The index for durable materials increased 0.9 percent in December. All major components of durable materials---consumer parts, equipment parts, and other durable materials---posted gains. The production of nondurable materials increased 0.6 percent. Among nondurable materials, a sizable gain in the index for chemical materials more than offset declines in textile materials and in paper materials. The output of energy materials declined 0.5 percent in December but advanced at an annual rate of 6.2 percent in the fourth quarter.
Industry Groups
Manufacturing production rose 0.8 percent in December after having gained 1.3 percent in November. The output of manufacturers edged up at an annual rate of 0.2 percent in the fourth quarter, and factory output was little changed, on net, since the first quarter of 2012. Within manufacturing, increases were widespread in December across both durable and nondurable goods industries. The factory operating rate rose to 77.4 percent, a rate 1.4 percentage points below its long-run average.
The production of durable goods advanced 1.0 percent in December and increased at an annual rate of 1.8 percent in the fourth quarter. Output rose in December for most major categories of durables, with gains of more than 1 percent in the indexes for nonmetallic mineral products, for primary metals, for computer and electronic products, for motor vehicles and parts, and for miscellaneous manufacturing. The output of fabricated metal products was unchanged in December, and the indexes both for wood products and for electrical equipment, appliances, and components decreased after having posted strong gains in November. Capacity utilization for durable goods manufacturing in December was 77.8 percent, a rate 0.7 percentage point above its long-run average.
The output of nondurables rose 0.6 percent in December, but it moved down at an annual rate of 0.6 percent in the fourth quarter. For December, the indexes for most major categories of nondurables increased, although the indexes for textile and product mills and for paper declined. Advances of more than 1 percent were recorded for apparel and leather, for printing and related support activities, and for chemicals. Capacity utilization for nondurable manufacturing was 78.3 percent, a rate 2.6 percentage points below its long-run average.
Production in the non-NAICS manufacturing industries (logging and publishing) rose 1.7 percent in December but was down 7.5 percent relative to its year-earlier level.
In December, mining output advanced 0.6 percent; production in the fourth quarter as a whole rose at an annual rate of 10.1 percent, with particularly large gains in oil and gas extraction. Capacity utilization at mines in December moved up 0.4 percentage point to 91.9 percent, a rate 4.6 percentage points above its long-run average. The output of utilities declined 4.8 percent in December, with decreases in the electric and the natural gas categories that resulted from the unseasonably warm weather. The operating rate for utilities fell 3.8 percentage points to 71.8 percent, a rate 14.5 percentage points below its long-run average.
Capacity utilization rates in December for industries grouped by stage of process were as follows: At the crude stage, utilization increased 0.3 percentage point to 89.1 percent, a rate 2.8 percentage points above its long-run average; at the primary and semifinished stages, utilization declined 0.4 percentage point to 75.6 percent, a rate 5.5 percentage points below its long-run average; and at the finished stage, utilization moved up 0.6 percentage point to 77.7 percent, a rate 0.5 percentage point above its long-run average.
