

 DDP
DDP Print
PrintIndustrial Production and Capacity Utilization - G.17
Current Release (250 KB PDF) (ASCII)
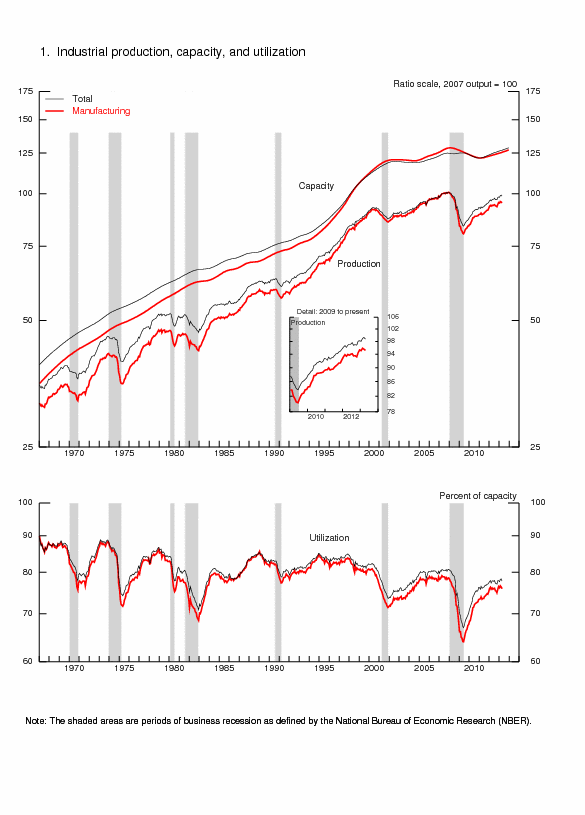
Industrial production decreased 0.5 percent in April after having increased 0.3 percent in March and 0.9 percent in February. Manufacturing output moved down 0.4 percent in April after a decline of 0.3 percent in March. The index for utilities decreased 3.7 percent in April, as heating demand fell back to a more typical seasonal level after having been elevated in March because of unusually cold weather. The output of mines increased 0.9 percent in April. At 98.7 percent of its 2007 average, total industrial production was 1.9 percent above its year-earlier level. The rate of capacity utilization for total industry decreased 0.5 percentage point to 77.8 percent, a rate 0.1 percentage point above its level of a year earlier but 2.4 percentage points below its long-run (1972--2012) average.
Industrial Production and Capacity Utilization: Summary
| Industrial production | 2007=100 | Percent change | |||||||||||
|---|---|---|---|---|---|---|---|---|---|---|---|---|---|
| 2012 | 2013 | 2012 | 2013 | Apr. '12 to Apr. '13 |
|||||||||
| Nov.[r] | Dec.[r] | Jan.[r] | Feb.[r] | Mar.[r] | Apr.[p] | Nov.[r] | Dec.[r] | Jan.[r] | Feb.[r] | Mar.[r] | Apr.[p] | ||
| Total index | 98.1 | 98.2 | 98.1 | 99.0 | 99.3 | 98.7 | 1.3 | .1 | -.1 | .9 | .3 | -.5 | 1.9 |
| Previous estimates | 98.0 | 98.1 | 98.0 | 99.1 | 99.5 | 1.2 | .1 | -.1 | 1.1 | .4 | |||
| Major market groups | |||||||||||||
| Final Products | 96.0 | 96.0 | 95.6 | 96.5 | 97.2 | 96.6 | 1.6 | .0 | -.4 | 1.0 | .7 | -.6 | 2.3 |
| Consumer goods | 93.2 | 93.2 | 93.2 | 93.9 | 94.8 | 94.2 | 1.5 | -.1 | .0 | .8 | .9 | -.6 | 2.4 |
| Business equipment | 101.3 | 101.7 | 100.3 | 102.1 | 102.2 | 101.7 | 2.4 | .4 | -1.4 | 1.8 | .1 | -.5 | 3.4 |
| Nonindustrial supplies | 87.1 | 87.1 | 87.6 | 88.4 | 88.5 | 87.7 | 1.3 | .0 | .6 | .9 | .1 | -.9 | .9 |
| Construction | 79.6 | 80.1 | 80.9 | 82.7 | 81.5 | 80.9 | 2.3 | .7 | 1.0 | 2.2 | -1.5 | -.8 | 1.8 |
| Materials | 103.9 | 104.1 | 104.0 | 104.9 | 105.0 | 104.6 | 1.1 | .2 | -.1 | .8 | .1 | -.4 | 2.0 |
| Major industry groups | |||||||||||||
| Manufacturing (see note below) | 94.5 | 95.3 | 95.1 | 95.8 | 95.6 | 95.2 | 1.4 | .9 | -.2 | .7 | -.3 | -.4 | 1.3 |
| Previous estimates | 94.5 | 95.3 | 95.0 | 95.9 | 95.7 | 1.4 | .8 | -.3 | .9 | -.1 | |||
| Mining | 116.5 | 116.0 | 114.6 | 116.6 | 115.9 | 116.9 | 1.2 | -.4 | -1.3 | 1.8 | -.6 | .9 | 4.2 |
| Utilities | 101.0 | 95.6 | 97.9 | 98.9 | 105.2 | 101.3 | .8 | -5.4 | 2.5 | 1.0 | 6.4 | -3.7 | 3.4 |
| Capacity utilization | Percent of capacity | Capacity growth |
|||||||||||
|---|---|---|---|---|---|---|---|---|---|---|---|---|---|
| Average 1972- 2012 |
1988- 89 high |
1990- 91 low |
1994- 95 high |
2009 low |
2012 Apr. |
||||||||
| 2012 | 2013 | Apr. '12 to Apr. '13 |
|||||||||||
| Nov.[r] | Dec.[r] | Jan.[r] | Feb.[r] | Mar.[r] | Apr.[p] | ||||||||
| Total industry | 80.2 | 85.2 | 78.8 | 85.0 | 66.9 | 77.7 | 77.9 | 77.8 | 77.6 | 78.2 | 78.3 | 77.8 | 1.9 |
| Previous estimates | 77.8 | 77.7 | 77.6 | 78.3 | 78.5 | ||||||||
| Manufacturing (see note below) | 78.7 | 85.6 | 77.3 | 84.6 | 64.0 | 76.1 | 75.8 | 76.4 | 76.1 | 76.6 | 76.3 | 75.9 | 1.6 |
| Previous estimates | 75.8 | 76.3 | 76.0 | 76.6 | 76.4 | ||||||||
| Mining | 87.3 | 86.3 | 83.9 | 88.6 | 78.3 | 87.9 | 89.0 | 88.4 | 87.0 | 88.3 | 87.5 | 88.0 | 4.1 |
| Utilities | 86.2 | 92.9 | 84.3 | 93.3 | 78.6 | 77.8 | 79.4 | 75.1 | 76.9 | 77.5 | 82.4 | 79.4 | 1.4 |
| Stage-of-process groups | |||||||||||||
| Crude | 86.3 | 87.7 | 84.4 | 89.7 | 76.4 | 86.1 | 87.4 | 87.3 | 86.0 | 86.9 | 86.3 | 86.4 | 2.9 |
| Primary and semifinished | 81.0 | 86.5 | 78.0 | 87.9 | 64.4 | 75.6 | 75.9 | 75.3 | 75.9 | 76.5 | 77.2 | 76.2 | .4 |
| Finished | 77.1 | 83.4 | 77.3 | 80.6 | 66.8 | 76.7 | 76.0 | 76.6 | 75.8 | 76.3 | 76.1 | 75.8 | 3.3 |
Market Groups
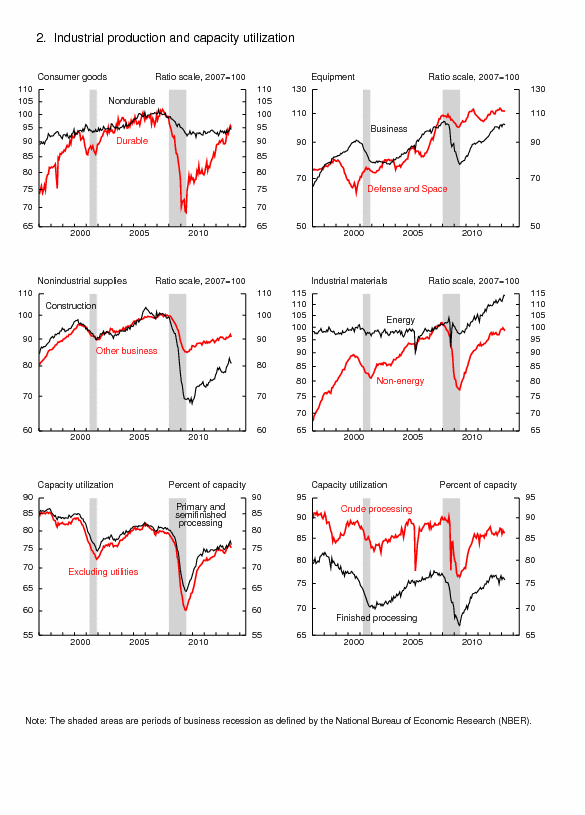
After having increased substantially in February and March, the production of consumer goods decreased 0.6 percent in April. The production of durable consumer goods moved down 0.8 percent; among the major components of this category, home electronics posted a small gain, but decreases were recorded by automotive products; appliances, furniture, and carpeting; and miscellaneous durables. The index for nondurable consumer goods declined 0.5 percent as a result of a drop of 3.1 percent for consumer energy products. The index for non-energy nondurables rose 0.4 percent, as increases for foods and tobacco and for chemical products outweighed decreases for clothing and for paper products. Over the past 12 months, the production of consumer goods rose 2.4 percent; the index for consumer durables advanced by more than 5 percent during that period, while the index for non-energy nondurables increased only negligibly.
The output of business equipment moved down 0.5 percent in April and was 3.4 percent above its year-earlier level. The decline reflected similarly sized losses for all of the major business equipment categories. The index for information processing equipment declined for a fourth consecutive month after having posted a sizable increase in the fourth quarter of 2012.
The production of defense and space equipment decreased 0.3 percent in April following an increase of 0.2 percent in March. In April, the index stood 0.5 percent above its year-earlier level.
Among nonindustrial supplies, the index for construction supplies moved down 0.8 percent in April after having fallen 1.5 percent in March; these declines followed four months of solid gains. The output of business supplies fell 1.0 percent in April after having increased in each of the first three months of the year.
The output of materials to be processed further in the industrial sector decreased 0.4 percent in April as a result of broadly based losses among the major components of this category. The production of durable materials decreased 0.4 percent. Within durable materials, the output of equipment parts edged up, but reductions were recorded by consumer parts and by other durable materials. The index for nondurable materials moved down 0.7 percent; textile materials, paper materials, and chemical materials all posted losses. The output of energy materials edged down 0.2 percent after two months of sizable gains.
Industry Groups
After having declined 0.3 percent in March, manufacturing output decreased 0.4 percent in April; the index was 1.3 percent above its level of a year earlier. The factory operating rate moved down 0.4 percentage point to 75.9 percent, a rate 2.8 percentage points below its long-run average.
The production of durable goods moved down 0.6 percent in April. Output decreased for all major categories of durable goods except computer and electronic products. The largest drop was in the output of nonmetallic mineral products, which fell 1.7 percent. The production of motor vehicles and parts decreased 1.3 percent, and the indexes for the other major categories recorded smaller losses. Capacity utilization for durable manufacturing fell 0.7 percentage point to 75.7 percent, a rate 1.3 percentage points below its long-run average.
The production of nondurable goods decreased 0.1 percent in April after having fallen 0.3 percent in March. Among the major components of nondurables, the indexes for apparel and leather and for petroleum and coal products each dropped about 1 1/2 percent in April. Losses of between 1/2 percent and 1 percent were posted by textile and product mills, by paper, and by printing and support. The indexes for food, beverage, and tobacco products; chemicals; and plastics and rubber products each rose, but by less than 1/2 percent. Capacity utilization for nondurable manufacturing was little changed at 77.5 percent, a rate 3.2 percentage points below its long-run average.
Production for non-NAICS manufacturing industries (publishing and logging) fell 0.8 percent in April for a fifth consecutive monthly decline; output last month was 8.5 percent below its year-earlier level.
Mining output increased 0.9 percent in April after having decreased 0.6 percent in March. In April, capacity utilization moved up 0.5 percentage point to 88.0 percent, a rate 0.7 percentage point above its long-run average. After increasing in each of the first three months of the year, the output of utilities declined 3.7 percent in April. The operating rate for utilities fell 3.0 percentage points to 79.4 percent and was 6.8 percentage points below its long-run average.
Capacity utilization rates in April for industries grouped by stage of process were as follows: At the crude stage, utilization increased 0.1 percentage point to 86.4 percent, a rate 0.1 percentage point above its long-run average; at the primary and semifinished stages, utilization dropped 1.0 percentage point to 76.2 percent, a rate 4.8 percentage points below its long-run average; and at the finished stage, utilization fell 0.3 percentage point to 75.8 percent, a rate 1.3 percentage points lower than its long-run average.
