FEDS Notes
October 11, 2018
How Can We Measure the Value of a Home? Comparing Model-Based Estimates with Owner-Occupant Estimates
Summary
Housing is difficult to value because homes have a wide variety of characteristics and they trade infrequently. A common method of valuing homes is to ask owner-occupants what they think their home is worth. However, owners can be biased and may not understand the true market value of their property, especially in market downturns. In Gallin, Molloy, Nielsen, Smith and Sommer (2018), we propose a method to calculate the aggregate value of residential housing using Automated Valuation Model (AVM) estimates, which are derived from models that use data on home sales and the characteristics of homes. Because AVMs are disciplined by market transactions, they are not subject to the same sorts of bias as owner valuations. On the other hand, model-based estimates can be incorrect if the characteristics of the home are not well measured or sales of comparable homes are infrequent.
In this note, we assess whether AVM estimates or owner valuations are better at approximating the market value of a home. Using the sales prices of homes when they do transact as a measure of market value, we compare AVM estimates and owner valuations to sales prices, linked at the property level. Specifically, we use owner valuations from the 2014 American Community Survey (ACS), an AVM from an external vendor that was estimated in mid-2014, and sales prices from tax assessor data.
We find that, in general, the performance of AVM estimates and owner estimates is fairly similar. Using either valuation approach, the median difference between the valuation and the market value is fairly small. Although owner valuations and AVM estimates are quite close to market values at the median, both frequently deviate from market value by a fair amount. Only about half of AVM estimates and 40 percent of owners are within 10 percent of the sales price. These similarities notwithstanding, there is a slight positive bias in the owner valuations--around 2 percent for the typical homeowner--that is not evident in the AVM estimates.
It is important to keep in mind that housing markets in most of the US were generally expanding during the period covered by this analysis. Other research has found that owner valuations performed much worse during the housing market contraction from 2007 to 2009 than during times of expansion (Chan, Dastrup and Ellen (2016), Davis and Quintin (2017) Gallin et al. (2018)). Since we do not have access to an AVM from a period of housing contraction, we do not know whether our results would hold throughout the housing cycle.
Analysis
An ideal strategy to evaluate the AVM and owner estimates would be draw a random sample of valuations and compare them to sales prices immediately following the date when the valuation occurred. The more time that elapses between the valuation date and the sale date, the more likely that the true market value of the home has changed during the intervening period. With this in mind, we begin by comparing owner and AVM valuations in 2014 to sales prices for properties that sold soon after the valuation occurred.1 Specifically, we compare owner valuations to sales prices of homes that that sold 2 to 4 months after the ACS interview date. We do not use sales one month after the interview date because these homes could easily have already been under contract during the interview, in which case the owner would likely report the contract price. For the AVM comparison, we use similar timing and compare the AVM estimates, which were calculated between June 18 and July 1, 2014 to sales in August through October 2014. We trim the AVM estimates, owner-occupant valuations, and sales prices by dropping values below $10,000 and above $4 million. We also trim the data by dropping observations for which the ratio of AVM to sales price or owner valuation to sales price is below the first percentile or above the 99th percentile.
Figure 1 shows the distribution of the ratios of owner valuation to sales price and AVM to sales price, with all values above the 95th percentile replaced with the 95th percentile and all values below the 5th percentile replaced with the 5th percentile. Table 1 reports some descriptive statistics of these distributions (prior to altering the tails).2 Both distributions are centered around one, indicating that the bias in the median estimate is fairly small. The average bias is positive in both cases, owing to a long right-hand tail where the valuations are much higher than the sales price. Many of the observations in this tail have a fairly low sales price. Therefore, the price-weighted average ratio, which would be more relevant if one were interested in measuring aggregate value, is close to 1 for both ratios. While the midpoints of the two distributions are quite similar, the ratio of AVM to sales price is more disperse than the ratio of owner valuation to sales price. For example, 65 percent of the owner estimates are within 10 percent of the sales price, while only 51 percent of AVM estimates are within this range. Thus, while it seems that both owner reports and AVMs generate an unbiased estimate of sales price, a randomly-chosen owner valuation from this sample is a little more likely to be close to the sales price than a randomly-chosen AVM estimate. It is worth noting, however, that these distributions are still both fairly wide, with one third of owner valuations and one half of AVM valuations being more than 10 percent away from the sales price.
Figure 1: Distributions of (Owner Valuation/Sales Price) and (AVM/Sales Price) for Homes Sold 2 to 4 Months Later
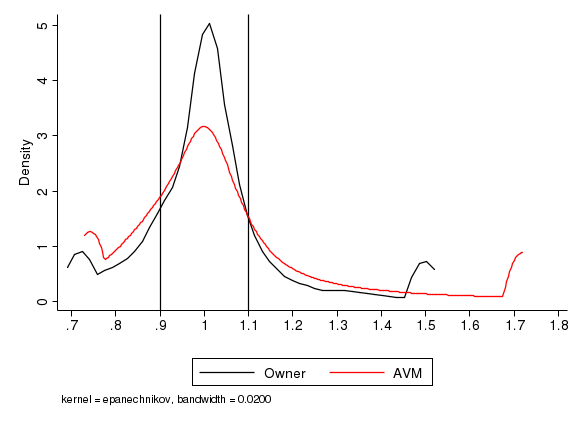
Source: Authors' calculations based on the 2014 ACS, AVM data, and tax assessor data.
Table 1: Descriptive Statistics for Figures 1 and 2
| Homes Sold 2 to 4 Months Later | Homes Sold in 2016 | |||
|---|---|---|---|---|
| Owner Val / Sales Price | AVM / Sales Price | Owner Val / Adj. Sales Price | AVM / Adj. Sales Price | |
| Average | 1.037 | 1.072 | 1.058 | 1.060 |
| Average of 48th to 52nd percentile | 1.001 | 0.998 | 1.020 | 0.998 |
| Fraction between 0.9 and 1.1 | 0.648 | 0.510 | 0.452 | 0.455 |
| Fraction less than .75 or more than 1.25 | 0.129 | 0.197 | 0.221 | 0.207 |
| Price-weighted average | 0.997 | 0.994 | 1.027 | 1.008 |
| Number of observations | 5,100 | 738,000 | 26,000 | 2,343,000 |
Source: Authors' calculations based on the 2014 ACS, the Zillow House Value Index (ZHVI), AVM data, and tax assessor data.
One issue with comparing owner reports to sales prices only a few months later is that, even if the homes are not already under contract, the owner is probably paying close attention to housing market conditions and may even have their home on the market. Therefore, the owner valuations shown in Figure 1 are probably not representative of the randomly-chosen owner.
To address this issue, we compare the owner valuations and AVM estimates to sales prices from transactions that occurred in 2016, which could be any time between 13 and 35 months following the valuation date. Our hope is that these sales are far enough in the future that most owners are not actively planning to put their home on the market. A drawback of this approach is that prices were generally increasing between 2014 and 2016, so we would expect the sales prices to be higher than the valuations. Following the literature, we attempt to address this issue by adjusting the sales price by the change in a local house price index from the valuation date to the sale date (Chan, Dastrup and Ellen 2016, Goodman and Ittner 1992). Specifically, we multiply the sales price in 2016 by the ratio of the county-level Zillow House Value Index (ZHVI) in the month the valuation occurred to the county-level ZHVI in the month of sale. This adjustment should account for price changes between 2014 and 2016, albeit imperfectly.
Figure 2 and Table 1 show that the ratios of valuations to this adjusted sale price are both centered more closely around zero, with the owner valuations still being a bit above the AVM valuations. For observations between the 48th and 52nd percentiles of their respective distributions (i.e. near the median), the average ratio of AVM to adjusted sales price is 1.00, while the average ratio of owner valuation to adjusted sales price is 1.02. These results suggest a slight degree of overvaluation by owner-occupants. Other research has also found that owners tend to over-estimate the value of their property (Benitez-Silva, Eren Heiland, Jimenez-Martin 2015, Chan, Dastrup and Ellen 2016. Depasquale and Somerville 1995, Goodman and Ittner 1992, Kiel and Zabel 1999). The dispersion of these two ratios is fairly similar, with only about 45 percent of valuations being within 10 percent of the adjusted sales price, and about 20 percent of valuations being more than 25 percent greater than or less than the sales price.
Figure 2: Distributions of (Owner Valuation/Adjusted Sales Price) and (AVM/Adjusted Sales Price) for Homes Sold in 2016
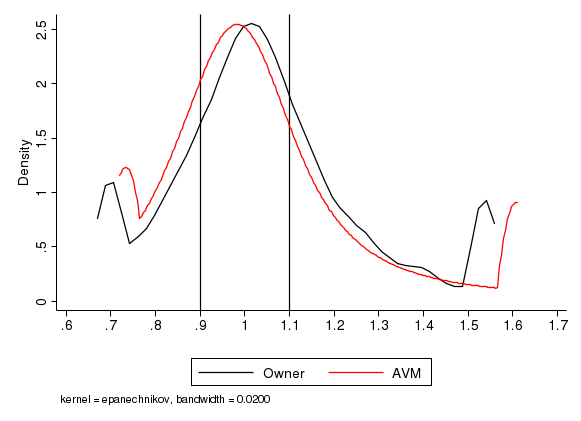
Source: Authors' calculations based on the 2014 ACS, the Zillow House Value Index (ZHVI), AVM data, and tax assessor data.
One still might be concerned that owners who sold their home in 2016 may be paying more attention to housing market conditions than other owners. As long as one is comparing owner valuations to a sales price, the sample must be limited to owners who sold their home. Because the results above indicate that the typical AVM estimate is an unbiased estimate of the sales price, we can broaden the sample to all homes (regardless of if or when a subsequent transaction occurred), by comparing the owner valuation to an AVM estimate.
The black line in Figure 3 shows the distribution of the ratio of owner valuation to AVM estimate and the red line shows the distribution of this ratio for homes sold in 2016. As expected, the distribution based on homes sold in 2016 is narrower than the entire distribution, indicating that people who sold their home in 2016 were paying more attention to the market than the typical homeowner and so were less likely to be off by a large amount in their valuations. In both samples, the average of the 48th to 52nd percentile of the entire distribution is 1.02, suggesting that the degree of bias among owners who did not subsequently sell is not that different from that of owners who did (see Table 2).
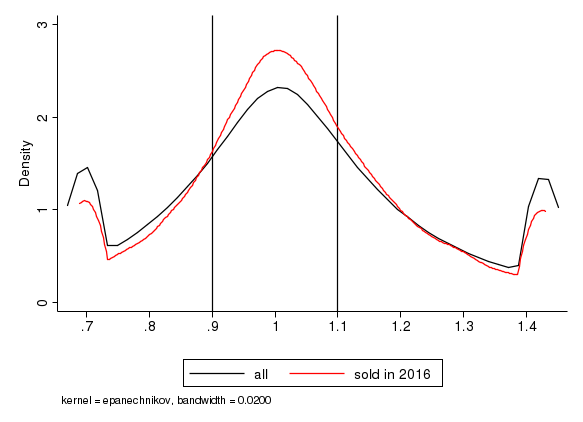
Source: Authors' calculations based on the 2014 ACS, AVM data, and tax assessor data.
Table 2: Descriptive Statistics for Figure 3
| Owner Valuation / AVM | ||
|---|---|---|
| All | Sold in 2016 | |
| Average | 1.040 | 1.037 |
| Average of 48th to 52nd percentile | 1.016 | 1.017 |
| Fraction between 0.9 and 1.1 | 0.414 | 0.472 |
| Fraction less than .75 or more than 1.25 | 0.256 | 0.203 |
| Price-weighted average | 1.021 | 1.020 |
| Number of observations | 876,000 | 25,500 |
Source: Authors' calculations based on the 2014 ACS, AVM data, and tax assessor data.
Of course, it is difficult to know whether the difference between owner valuations and AVM estimates is because owners do not value their home accurately or because they have more information about their property than the AVM. We can shed some light on this question by examining the characteristics of people who are more likely to give a valuation close to the AVM. If the differences between the owner valuations and AVM are driven by owners' inattention to the market, we would expect owners with more information about the market to have a valuation closer to the AVM. To this end, we regress an indicator for the owner valuation being within 10 percent of the AVM on owner characteristics and indicators for the month of interview.3
Table 3 reports the coefficient estimates. Owners who moved into the home recently and owners who sold their home in the first several years after the interview are more likely to report a valuation close to the AVM valuation, consistent with the interpretation that these owners have more information about the local market. Older owners are less likely to be close to the AVM estimate. Since older people tend to move less frequently, they may have less incentive to pay attention to market conditions. Owners with at least an associate's degree and owners with a higher income are more likely to be closer to the AVM estimate, perhaps because they are more financially literate than less educated, lower income owners. These results are all consistent with the interpretation that at least some of the difference between owner valuations and the AVM derives from owners' inattention to market conditions. However, the R-squared of this regression is quite low, so much of the difference between these two valuations remains unexplained.
Table 3: Correlates of Owner Valuation Being Within 10 Percent of AVM
| Regression Coefficient | |
|---|---|
| Moved in after 2011 | 0.100 (0.002) |
| Property Sold in 2014 | 0.148 (0.003) |
| Property Sold in 2015 | 0.068 (0.003) |
| Property Sold in 2016 | 0.052 (0.003) |
| Homeowner age between 40 and 60 | -0.048 (0.002) |
| Homeowner age older than 60 | -0.077 (0.002) |
| Homeowner has associates degree or higher | 0.056 (0.001) |
| Household income < $50,000 | -0.053 (0.001) |
| Household income >$130,000 | 0.027 (0.001) |
| Indicators for interview month | Yes |
| Number of observations | 876,000 |
| Adjusted R2 | 0.028 |
Note: The coefficient estimates are from a multiple linear regression of an indicator equal to one if the owner valuation is within 10 percent of the AVM value on the variables shown and interview-month indicators. Standard errors are shown in parentheses.
Source: the 2014 ACS, AVM data, and tax assessor data.
As a related test, we limit the sample to properties that were subsequently sold in 2016 and examine whether people whose valuations are closer to the AVM are more likely to have a valuation close to the (adjusted) 2016 sales price. A simple linear regression suggests that this does indeed appear to be the case--homeowners who reported values within 10% of the AVM value were significantly more likely to also be within 10% of the adjusted 2016 sales price.
Conclusion/Discussion
Putting it all together, the AVM estimates and owner valuations appear to provide similar information about the market value of homes. Using either valuation method, the degree of bias in the typical estimate is fairly small, suggesting that the median estimate or the (price-weighted) average estimate can be used as a good proxy for the market value in a particular geographic area. However, the degree of precision of both valuation methods is low. Only about half of AVM estimates and 40 percent of owner valuations are within 10 percent of the sales price. It is worth emphasizing again that these results were obtained from a time period when house prices were generally rising, and might be different when prices are falling or during market turning points.
The degree of homeowner overestimation that we find here is a little smaller than the values reported in most prior studies. However, most prior studies report averages rather than medians and because the distribution of owner errors is skewed, the average is higher than the median. The average amount of over-estimation in prior studies is generally in the range of 5 to 10 percent (Benitez-Silva, Eren Heiland, Jimenez-Martin 2015, Chan, Dastrup and Ellen 2016, Depasquale and Somerville 1995, Goodman and Ittner 1992, Kiel and Zabel 1999). For comparison, we find that the average error among owners is about 6 percent, which is within the range of prior estimates. The skewness of the distribution of owner valuations relative to market valuations is worth emphasizing because researchers or policymakers who want to know the typical degree of overestimation should look at the median of the distribution, not the average.
Additionally, we find that the price-weighted average error for both owner valuations and AVM estimates is smaller than the unweighted average, as the valuations that are much higher than the sales price tend to have low sales prices. This result has important implications for the measurement of aggregate housing wealth, which puts less weight on lower-value properties. Our analysis shows that it is not appropriate to apply the unweighted average errors reported in prior studies to estimates of aggregate housing wealth.
References
Benitez-Silva, H., S. Eren, F. Heiland and S. Jimenez-Martin. 2008. "How Well do Individuals Predict the Selling Prices of Their Homes?" Journal of Housing Economics 29: 12-25.
Chan, Sewin, Samuel Dastrup, and Ingrid Ellen. "So Homeowners Mark to Market? A Comparison of Self-Reported and Estimated Market Home Values During the Housing Boom and Bust." Real Estate Economics 44: 627-657.
DiPasquale, D. and C.T. Somerville. 1995. "Do House Price Indices Based on Transacting Units Represent the Entire Stock? Evidence from the American Housing Survey." Journal of Housing Economics 4: 195-229.
Davis, M. A. and Quintin, E. 2017. "On the Nature of Self‐Assessed House Prices." Real Estate Economics. 45: 628-649.
Gallin, Josh, Eric Nielsen, Raven Molloy, Paul Smith, and Kamila Sommer. 2018. "Measuring Aggregate Housing Wealth: New Insights from an Automated Valuation Model." Finance and Economics Discussion Series 2018-064. Board of Governors of the Federal Reserve System (US).
Goodman, John L., and John B. Ittner. "The Accuracy of Home Owners' Estimates of House Value." Journal of Housing Economics 2: 339-357.
Kiel, K.A. and J.E. Zabel. 1999. "The Accuracy of Owner-Provided House Values: The 1978-1991 American Housing Survey." Real Estate Economics 27: 263-298.
1. We attempt to exclude sales prices from non-arms-length transactions by excluding document types that are associated with foreclosures or intrafamily transfers. Return to text
2. The ratio of owner valuation to sales price is weighted using the household weights in the ACS. Return to text
3. These indicators are necessary because the interviews take place throughout the year, while the AVMs were all calculated from late June to July 1. Return to text
Molloy, Raven, and Eric Nielsen (2018). "How Can We Measure the Value of a Home? Comparing Model-Based Estimates with Owner-Occupant Estimates," FEDS Notes. Washington: Board of Governors of the Federal Reserve System, October 11, 2018, https://doi.org/10.17016/2380-7172.2266.
Disclaimer: FEDS Notes are articles in which Board staff offer their own views and present analysis on a range of topics in economics and finance. These articles are shorter and less technically oriented than FEDS Working Papers and IFDP papers.