
FEDS Notes
 Print
PrintOctober 31, 2014
Measuring Direct Investment in the Financial Accounts of the United States
Priya Punatar and Youngsuk Yook1
This note explains recent changes in the treatment of direct investment in the Federal Reserve Board's Financial Accounts of the United States (formerly known as the Flow of Funds Accounts). Direct investment, encompassing both U.S. direct investment abroad and foreign direct investment in the U.S., refers to ownership by one country's residents of at least ten percent of a business in another country.2 Prior to the September 2014 publication of the Financial Accounts, direct investment was included in a broad instrument category called "identified miscellaneous financial claims." Beginning with the September 2014 publication, direct investment data are reported separately from miscellaneous financial claims in sector tables, and are detailed in two new instrument tables which provide data on the levels (table L.229 (PDF)) and flows (table F.229 (PDF)).3
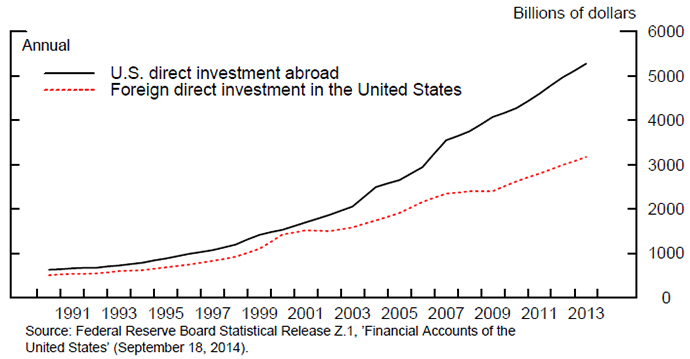
A number of considerations have led to the addition of the direct investment tables to the Financial Accounts. First, direct investment positions have grown considerably over the past decade, as shown in Figure 1, and second, direct investment flows constitute a considerable fraction of cross-border transactions.4 Finally, new details have become available as the Bureau of Economic Analysis (BEA), our main source for the direct investment data, has recently undertaken a major restructuring of its international economic accounts.5 In addition to providing additional detail, the BEA's revised statistics more closely align with international statistical reporting guidelines.6 Many features of the new Financial Accounts tables reflect the BEA's enhanced detail on direct investment.
The new direct investment tables provide breakdowns of direct investment flows and positions into equity and intercompany debt, and details of the claims and liabilities components of intercompany debt. Additionally, an alternative presentation of the direct investment data (called an asset/liability-basis presentation) as well as alternative valuations of direct investment positions (specifically, market-value and historical-cost methods) have been added as memo items and are described in further detail below. The additional information will help some analysts and researchers to conduct more in-depth analyses using data in the Financial Accounts.
Two Approaches to Presenting Direct Investment Data: Directional Basis vs. Asset/Liability Basis
Direct investment data can be presented in two different ways.
- A directional approach presents direct investment in two categories: (1) U.S. direct investment abroad (USDIA) and (2) foreign direct investment in the United States (FDIUS), depending on whether the direct investor is a domestic resident or a foreign resident.
- An asset/liability-basis presentation classifies direct investment into assets and liabilities from the perspective of the United States regardless of the direction of the investment.
The difference between a directional approach and an asset/liability-basis approach essentially lies in the way intercompany debt is recorded. The relation between a parent and its affiliate is complex in that a parent can have both claims against and liabilities to its affiliate. Thus, intercompany debt can be broken down into four components: (1) U.S. affiliates' liabilities, (2) U.S. affiliates' claims, (3) U.S. parents' claims, and (4) U.S. parents' liabilities.7 Figure 2 illustrates the two approaches and their differences. Equity components are not shown in the figure because equity values are the same under the two approaches.
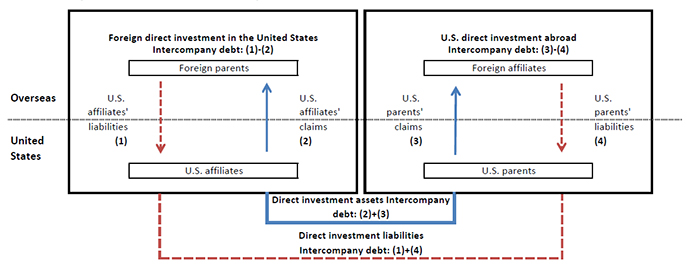
A directional approach is summarized by the two panels in the figure. The left panel shows the intercompany debt of FDIUS, while the right panel shows the intercompany debt of USDIA. An asset/liability approach is illustrated by two sets of arrows, where the upward (blue) and downward (dashed red) arrows represent capital outflows (assets) and inflows (liabilities), respectively, from the perspective of the United States. The horizontal dotted line is the dividing line between the United States and overseas, indicating that U.S. affiliates (foreign parents' U.S. subsidiaries) and U.S. parents are located in the United States, and that foreign parents and foreign affiliates (U.S. parents' foreign subsidiaries) are located overseas.
Under a directional approach, the intercompany debt of FDIUS (left panel) is U.S. affiliates' liabilities (1) net of U.S. affiliates' claims (2), or the difference between the downward (dashed red) and the upward (blue) arrows. Similarly, the intercompany debt of USDIA (right panel) is calculated as U.S. parents' claims (3) net of U.S. parents' liabilities (4). Note that the intercompany debt of FDIUS is calculated from the perspective of foreign investors and that of USDIA from the perspective of U.S. investors.
Under an asset/liability approach, the intercompany debt of direct investment assets from the perspective of the United States is the sum of the two upward (blue) arrows: U.S. affiliates' claims (2) and U.S. parents' claims (3). Likewise, the intercompany debt of direct investment liabilities is the sum of the two downward (dashed red) arrows: U.S. affiliates' liabilities (1) and U.S. parents' liabilities (4).
Table L.229 (PDF) shows the four components of intercompany debt in lines 4, 5, 23, and 24. Under a directional approach, the intercompany debt of FDIUS (line 22) is U.S. affiliates' liabilities (line 23) net of U.S. affiliates' claims (line 24). The intercompany debt of USDIA (line 3) is obtained by subtracting U.S. parents' liabilities (line 5) from U.S. parents' claims (line 4).
An asset/liability-basis approach rearranges the four components of intercompany debt, as shown in lines 28, 29, 33, and 34. Under this approach, the intercompany debt of direct investment assets (line 27) is the sum of U.S. parents' claims (line 28) and U.S. affiliates' claims (line 29). The intercompany debt of direct investment liabilities (line 32) is the sum of U.S. parents' liabilities (line 33) and U.S. affiliates' liabilities (line 34).
The information on an asset/liability-basis presentation has been made available by the BEA following the restructuring of its international economic accounts.8 An asset/liability-basis approach has advantages in that it is consistent with the international accounting guidelines provided by the System of National Accounts, 2008, and other macroeconomic statistics.9 However, valuable information can be lost by aggregating investment made by foreign investors and domestic investors. Foreign and domestic residents often have different sets of regulatory and economic considerations for investment and can respond differently to various policies and shocks.10 A directional approach allows for a separate analysis for foreign and domestic investors, facilitating understanding of the trends and motivation behind the investment made by different types of investors. Thus, the Financial Accounts continue to feature directional-basis statistics, while making the asset/liability-basis statistics available in a "memo" section.
Alternative Valuations of Direct Investment
In addition to the two approaches for presenting direct investment data, there are three valuation methods available for measuring direct investment positions.
- The market-value method estimates the direct investor's share of direct investment equity using indexes of stock market prices.
- The current-cost method revalues parents' shares of their affiliates' investment in tangible assets to current-period prices. For example, the estimates of replacement costs are used to value investment in inventories, and general price indexes are used for land.
- Historical-cost estimates are book values obtained from the balance sheets of direct investment enterprises (or the direct investor).
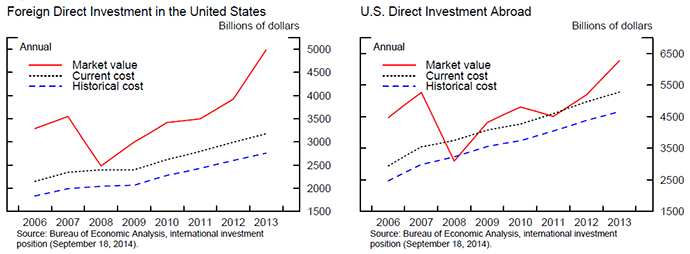
Figure 3 presents the time series of direct investment positions valued using the three methods. The market value of direct investment is the most volatile of the three, having plunged substantially during the financial crisis and recovered to the pre-crisis level only in the past couple of years. Current-cost estimates tend to be higher than historical-cost estimates, reflecting the tendency of the prices of tangible assets to rise over time. However, the gap between these two estimates has remained stable over time in contrast to the gap between market-value estimates and the other two estimates, which has varied considerably.
The Financial Accounts make all three valuations available. Table L.229 (PDF) continues to feature direct investment positions on a current-cost basis while showing the two alternative valuations, market-value and historical-cost estimates, as memo items.11 Note that the differences in direct investment levels across the three valuation methods arise from how the equity component is valued. The current-cost intercompany debt of USDIA (line 3) is the same as the market-value (line 37) and historical-cost (line 40) intercompany debt. Similarly, the current-cost intercompany debt of FDIUS (line 22) is the same as the market-value (line 43) and historical-cost (line 46) intercompany debt.
One caveat to the current-cost basis presentation in table L.229 is that the sector statistics (lines 6-19), which show direct investment positions for all domestic sectors participating in direct investment transactions, are available only on a historical-cost basis.12 To account for this difference in valuation, a current-cost adjustment is made, reflecting the gap between the current-cost aggregate direct investment positions and the sum of the historical-cost positions across all participating sectors. Although the current-cost adjustment is not explicitly shown in table L.229, it can be easily calculated by taking the difference between the current-cost direct investment position (line 1 for USDIA and line 20 for FDIUS) and the corresponding historical-cost position (line 38 for USDIA and line 44 for FDIUS).
The sector statistics allocate all of the current-cost adjustment to the nonfinancial corporate business sector, as this sector accounts for the vast majority of direct investment.13 That is, the nonfinancial corporate business sector's direct investment positions shown in lines 6 and 12 are the sum of the current-cost adjustment and the historical-cost estimates of the nonfinancial corporate business sector positions. The direct investment positions of all other sectors are presented as historical-cost estimates. This treatment is unchanged from previous publications of the Financial Accounts.
On the flows side, the BEA does not publish alternative valuations. Accordingly, table F.229 (PDF) reports only current-cost estimates. However, the BEA publishes the current-cost adjustment, which is reported in lines 5 and 10 of table F.229 for USDIA and in lines 17 and 29 for FDIUS. Analogous to the levels table, the current-cost adjustment is the difference between the current-cost aggregate direct investment positions and the sum of the historical-cost positions across all participating sectors.
References
Borga, Maria, and Kristy L. Howell (2014). "The Comprehensive Restructuring of the International Economic Accounts: Changes in Definitions, Classifications, and Presentations," Survey of Current Business, vol. 94 (March), pp. 1-19, available at http://bea.gov/scb/pdf/2014/03%20March/0314_restructuring_the_international_economic_accounts.pdf.
European Commission, International Monetary Fund, Organization for Economic Co-operation and Development, United Nations, and Word Bank (2009). System of National Accounts, 2008 (New York: EC, IMF, OECD, UN, and WB), available at http://unstats.un.org/unsd/nationalaccount/sna2008.asp  .
.
Forbes, Kristin J., and Francis E. Warnock (2012). "Capital Flow Waves: Surges, Stops, Flight, and Retrenchment," Journal of International Economics, vol. 88 (November), pp. 235-51.
International Monetary Fund (2009). Balance of Payments and International Investment Position Manual, 6th ed. (Washington: IMF), available at www.imf.org/external/pubs/ft/bop/2007/bopman6.htm .
Rothenberg, Alexander D., and Francis E. Warnock (2011). "Sudden Flight and True Sudden Stops," Review of International Economics, vol. 19 (August), pp. 509-24.
1. We are grateful to Marco Cagetti, Josh Gallin, Elizabeth Holmquist, Susan McIntosh, Michael Palumbo, and Paul Smith for their helpful comments and suggestions. Return to text
2. The direct investor is known as a parent, and the parent's foreign business is known as an affiliate. In this note, U.S. parents' foreign business is called a foreign affiliate, and foreign parents' U.S. business is called a U.S. affiliate. Return to text
3. The levels and flows tables, both titled "Identified Miscellaneous Financial Claims--Part I", which previously included direct investment levels and flows, were relabeled as tables L.231 (PDF) and F.231 (PDF) beginning with the September 2014 publication of the Financial Accounts. Return to text
4. For example, as reported in table F.106 (PDF) of the September 2014 publication, U.S. direct investment flows in 2013 ($349.5billion; line 45) constituted just under half of the total U.S. net acquisition of foreign financial assets ($819.7 billion; line 34), and foreign direct investment flows ($236.3 billion; line 33) made up 20 percent of the total foreign net acquisition of U.S. financial assets ($1,170.6 billion; line 13). Return to text
5. For details on the BEA's revision of its international economic accounts, see Borga and Howell (2014). Return to text
6. For an example of such guidelines, see International Monetary Fund (2009). Return to text
7. This breakdown of intercompany debt became available with the BEA's June 2014 release of its international economic accounts. Return to text
8. Beginning in June 2014, the BEA features an asset/liability-basis presentation, but continues to provide directional-basis statistics. Borga and Howell (2014) point out various benefits of an asset/liability-basis approach including bringing direct investment in line with the other functional categories and increasing the use of gross recording in the BEA's international accounts. Return to text
9. The System of National Accounts, 2008, is the latest version of the international statistical standard for national accounting, created by the United Nations Statistical Commission. For additional details, see European Commission, International Monetary Fund, Organization for Economic Co-operation and Development, United Nations, and World Bank (2009). Return to text
10. See, for example, Forbes and Warnock (2012) and Rothenberg and Warnock (2011) for discussion of the different considerations for investment by foreign and domestic investors. Return to text
11. The information on alternative valuations of positions data has been made available by the BEA following the restructuring of its international economic accounts. Return to text
12. The sector statistics report only the total positions for each sector, and additional detail on the debt and equity split is currently unavailable. Return to text
13. As shown in table L.229, at the end of 2013, the nonfinancial corporate business sector accounted for 79.5 percent of total FDIUS positions and 80.4 percent of total USDIA positions, respectively, in terms of historical-cost estimates. Return to text
Please cite as:
Punatar, Priya, and Youngsuk Yook (2014). "Measuring Direct Investment in the Financial Accounts of the United States," FEDS Notes. Washington: Board of Governors of the Federal Reserve System, October 31, 2014. https://doi.org/10.17016/2380-7172.0033
Disclaimer: FEDS Notes are articles in which Board economists offer their own views and present analysis on a range of topics in economics and finance. These articles are shorter and less technically oriented than FEDS Working Papers.
