
FEDS Notes
 Print
PrintJune 2015
The Increase in Wealth Concentration, 1989-2013
Jesse Bricker, Alice Henriques, Jacob Krimmel, and John Sabelhaus
Wealth is highly concentrated in the United States, and top shares have been rising in recent decades, raising both normative and macroeconomic policy concerns. However, the levels and trends observed in household survey data are less dramatic than estimates derived from administrative income tax data. For example, Saez and Zucman (2014) use administrative income tax data and estimate that the top 0.1 percent (by wealth) had a wealth share of 22 percent in 2013, up from 11.5 percent in 1989 (black line, figure 1). The Survey of Consumer Finances (SCF) shows less than half the increase in the top 0.1 percent wealth share, rising from 11 percent in 1992 to 14 percent in 2013 (red dashed line, figure 1).1
| Figure 1. Top 0.1% Wealth Shares |
|---|
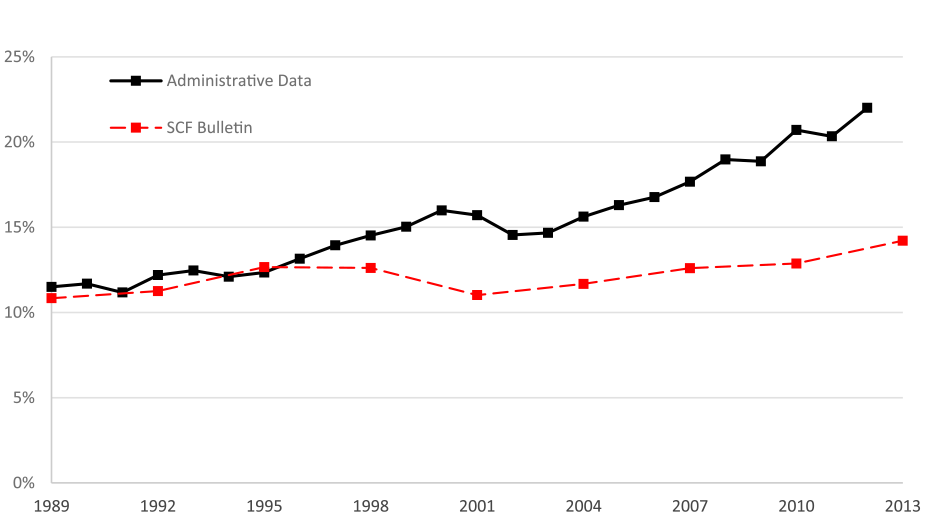 |
Sources: Federal Reserve Board, Survey of Consumer Finances (SCF); and Saez and Zucman (2014). See Appendix B of Bricker, et al (2015) for details on SCF and FA wealth concepts. Wealth thresholds for identifying the top households and tax units are reported in Appendix C of Bricker, et al (2015). Shaded area represents 95% confidence interval based on sampling and imputation variance. Data sources: Federal Reserve Board, Survey of Consumer Finances (SCF); Saez and Zucman (2014).
In this note, we show that the divergence in top shares arises because the SCF uses more appropriate observational units for distributing resources, measures wealth more comprehensively, and avoids imposing a rigid correlation between cross-section income and wealth when grouping top end families. The restrictions and rigidities needed to estimate top wealth shares in the administrative income tax data upwardly bias levels and growth rates of wealth concentration. This note is a companion piece to a more comprehensive working paper on income and wealth measurement and their concentrations (Bricker, Henriques, Krimmel, and Sabelhaus, 2015).
Measurement differences
Traditional household surveys suffer from underrepresentation of wealthy families.2 The SCF, though, heavily oversamples wealthy families using administrative income tax data to overcome the underrepresentation problem. Rigorous targeting and accounting for wealthy family participation assures those families are properly represented in the SCF data. Thus, the divergence in top wealth shares noted above is conceptual, and not attributable to sampling. The SCF captures the full distribution of wealth (Bricker et al, 2015).3 Surveyed families respond to questions about assets, debts, income, employment, demographics, among others.
There is no administrative data system directly associated with measuring the cross-section of wealth at a point in time, but top wealth shares can be measured indirectly using administrative income data.4 These wealth estimates depend on allocating aggregate household sector net worth in the Financial Accounts of the United States (FA) using capital income from the tax data and correlations between income and wealth from other data sources (Saez and Zucman, 2014). For example, if a family in the administrative income tax data has $1 of interest income and the ratio between fixed-income assets in the FA and taxable interest income in the tax data is 100, then that family is assumed to have $100 of wealth behind that $1.
Conceptual differences between the SCF and FA measures become important when comparing estimates from these two methods. Adjusting the SCF to match the FA concepts should affect top shares: subtracting durable goods and adding Defined Benefit (DB) pensions to SCF net worth, for example, have differential effects across the wealth distribution.5
Although aggregate household net worth in the SCF and the FA follow similar growth patterns, estimates of the net worth components, most notably in the valuation of owner-occupied housing, sometimes diverge.6 The trend differences in housing values are a first-order issue for top shares, however, because housing is a substantial part of aggregate household sector net worth, and the distribution of housing is much less skewed than the distribution of financial assets. Thus, the decision about whether to infer top shares by calibrating to SCF or FA aggregates will directly impact estimated top shares.7
Reconciling Top Wealth Share Estimates
The growth rate of wealth concentration measured using the administrative income tax data and the growth rate of wealth concentration measured in the SCF are noticeably different over the past 15 years (figure 1). To illustrate the importance of the two different approaches to measurement (noted above), a reconciliation exercise here adjusts the SCF data concepts to mirror those in the estimates derived from administrative income data. The adjustments applied to resolve differences between the alternative approaches are meant to be informative, but not to suggest that the SCF household-based comprehensive wealth share estimates are deficient.8
In fact, the baseline estimates of top shares derived from administrative data are biased because of the underlying system parameters from which the data are derived. In the U.S. income tax system, observations are tax filing units, not families. The number of tax units (about 160 million in 2012) is some 30 percent higher than the number of families (122 million in the SCF).9 Most of the tax units at the very top are also families, meaning the effect of divergence between the observational units is mainly a factor in the rest of the income and wealth distribution.10 Adjusting the top fractile cutoffs to account for tax returns versus households as the unit of observation changes the top 0.1 percent wealth share substantially, and closes much of the gap between SCF and tax-based estimates.
The next adjustment to the SCF involves moving to a wealth concept equivalent to the FA.11 The third adjustment accounts for the observed divergence in FA versus SCF balance sheet aggregates by type; SCF values for owner-occupied real estate, non-housing assets, and liabilities are re-scaled separately to match their FA counterparts. The net effect is to increase the estimated SCF top share because owner-occupied housing is less concentrated at the top than other forms of wealth like financial assets and non-corporate businesses.12 The final reconciliation adjustment is to add wealth estimates for the Forbes 400, a group which the SCF is prohibited from interviewing.13
Differences in unit of observation, wealth concepts, and wealth aggregates close much of the gap between SCF and administrative tax-based estimates for the top 0.1 percent. The reconciled SCF estimate is plotted with a 95 percent confidence interval to account for sampling and imputation variance (purple line and shaded area, figure 2).14 The tax-based estimates still appear to grow more rapidly, especially in the past decade.
| Figure 2. Top 0.1% Wealth Shares, Including Reconciliation |
|---|
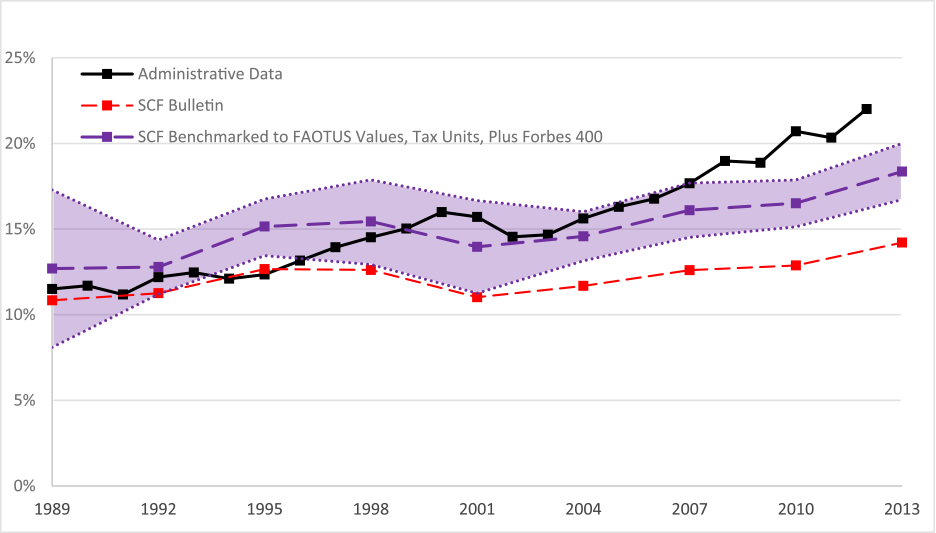 |
Sources: Federal Reserve Board, Survey of Consumer Finances (SCF); and Saez and Zucman (2014). See Appendix B of Bricker, et al (2015) for details on SCF and FA wealth concepts. Wealth thresholds for identifying the top households and tax units are reported in Appendix C of Bricker, et al (2015). Shaded area represents 95% confidence interval based on sampling and imputation variance. Data sources: Federal Reserve Board, Survey of Consumer Finances (SCF); Saez and Zucman (2014).
Reconciling the divergence in top wealth share growth in the past decade
Nearly all of the growth in wealth concentration over the past decade in the estimates derived from administrative income tax data is due to fixed income assets, a group that includes time and saving deposit accounts, CDs, and bonds (figure 3). About two-thirds of the fixed income assets in the FA are time and saving deposit accounts, meaning that a large fraction of the asset growth of the top 0.1 percent since the early 2000s is due to these time and saving deposit accounts.
| Figure 3. Wealth Composition of the Top 0.1% in the Administrative Data |
|---|
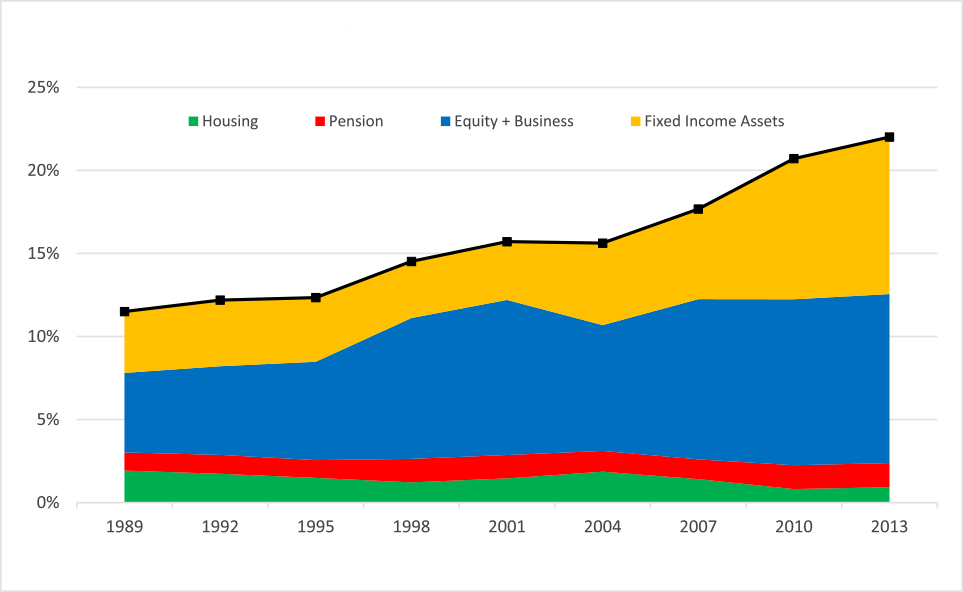 |
Data Sources: Saez and Zucman (2014).
However, this apparent growth of fixed-income assets is associated with an inexplicable trend in the estimated rate of return on fixed-income assets, as inferred using the ratio of taxable interest income (in the administrative income tax data) to fixed income assets (in the FA). Actual market-based returns on interest-bearing assets are considerably higher (Bricker et al., 2015), suggesting that the fixed income assets in the FA are not being appropriately linked to the underlying interest observed in the administrative income tax data.
Recall that a restriction of estimating wealth with income data is that all families with interest-bearing assets get a common rate of return in the administrative data estimates (the black line of figure 2). Top wealth shares, though, can vary if this restriction is loosened. The dashed black line in figure 4 shows the capitalized wealth share of the top 0.1 percent if the top wealth families get a higher-than-average rate of return.15 Here, interest income of the top 1 percent is capitalized at the 10-year Treasury rate (that is, a 2 percent return in recent years) and the interest income of the bottom 99 percent is capitalized, as in figure 1 and 2, by the ratio of Financial Accounts fixed-income assets to SOI interest income (that is, 1 one percent return in recent years).16 For comparison, the solid black line from figures 1 and 2 is also displayed.
Notably, the dashed black line generally falls within the confidence interval of the SCF top 0.1 wealth share. Further, the growth rate since the year 2000 in the dashed black line is muted relative to the black line and is generally consistent with the SCF trend.17
Conclusion
Overall, the level and growth of the top 0.1 wealth share in the capitalized administrative data is nearly identical to that observed in the SCF when conceptual differences between the two are alleviated, and a heterogeneous asset rate of return is allowed on fixed income assets only. Both the reconciled SCF and the less-restrictive estimates from administrative tax data in figure 4 imply that the growth in wealth concentration at the top is slower than the constrained administrative estimates.
| Figure 4. Top 0.1% Wealth Shares, Allowing A Heterogeneous Return |
|---|
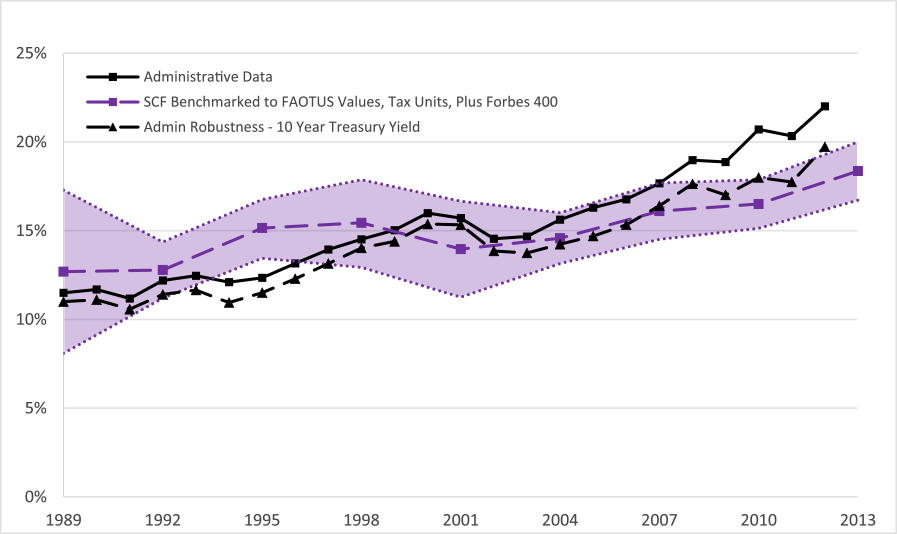 |
Sources: Federal Reserve Board, Survey of Consumer Finances (SCF) and Saez and Zucman (2014). See Appendix B of Bricker, et al (2015) for details on SCF and FA wealth concepts. Wealth thresholds for identifying the top 1% of households and tax units are reported in Appendix C. Shaded area represents 95% confidence interval based on sampling and imputation variance. Data sources: Federal Reserve Board, Survey of Consumer Finances (SCF); Saez and Zucman (2014), Appendix Tables B1 and B40 .
References
Bricker, Jesse, Alice Henriques, Jacob Krimmel, and John Sabelhaus. 2015. "Measuring Income and Wealth at the Top Using Administrative and Survey Data" Federal Reserve Board, Finance and Economics Discussion Series, 2015-30. (April)
Bricker, Jesse, Lisa J. Dettling, Alice Henriques, Joanne W. Hsu, Kevin B. Moore, John Sabelhaus, Jeffrey Thompson, and Richard A .Windle. 2014. "Changes in U.S. Family Finances from 2010 to 2013: Evidence from the Survey of Consumer Finances," Federal Reserve Bulletin, 100(4): 1-40. (September)
Brown, Meta, Andrew Haughwout, Donghoon Lee, and Wilbert van der Klaauw. 2011 (revised 2013). "Do We Know What We Owe? A Comparison of Borrower- and Lender-Reported Consumer Debt," Federal Reserve Bank of New York Staff Reports, 523: 1-54.
Henriques, Alice M. (2013). "Are Homeowners in Denial about their House Values? Comparing Owner Perceptions with Transaction-Based Indexes," Federal Reserve Board, Finance and Economics Discussion Series, 2013-79.
Henriques, Alice M., and Joanne W. Hsu. 2014. "Analysis of Wealth using Micro and Macro Data: A Comparison of the Survey of Consumer Finances and Flow of Funds Accounts," in Jorgenson, Dale W., J. S. Landefeld and Paul Schreyer eds., Measuring Economic Sustainability and Progress, Studies in Income and Wealth, Volume 72. Cambridge, MA: National Bureau of Economic Research.
Kopczuk, Wojciech, and Emmanuel Saez. 2004. "Top Wealth Shares in the United States, 1916-2000" Evidence from Estate Tax Returns," National Tax Journal, 52:445-487.
Sabelhaus, John, David Johnson, Stephen Ash, Thesia Garner, John Greenlees, Steve Henderson, and David Swanson. 2015. "Is the Consumer Expenditure Survey Representative by Income?" Forthcoming in Improving the Measurement of Consumer Expenditures, Christopher D. Carroll, Thomas Crossley, and John Sabelhaus (Eds.), Studies in Income and Wealth, Volume 74. Cambridge, MA: National Bureau of Economic Research.
Saez, Emmanuel, and Gabriel Zucman. 2014. "Wealth Inequality in the United States since 1913: Evidence from Capitalized Income Tax Data," National Bureau of Economic Research Working Paper 20625. (October)
Statistics of Income. 2012. Individual Income Tax Returns. Washington, DC: Internal Revenue Service.
Vermeulen, Phillip. 2014. "How Fat is the Top Tail of the Wealth Distribution?" Directorate General Research, Monetary Policy Research Division, European Central Bank. (September)
Wolfers, Justin. 2015. "The Gains from the Economic Recovery are Still Limited to the Top One Percent" http://www.nytimes.com/2015/01/28/upshot/gains-from-economic-recovery-still-limited-to-top-one-percent.html.
1 A slow rise in top wealth shares is also consistent with estimates derived from administrative estate tax data (Kopczuk and Saez, 2004). Return to text
2. See Sabelhaus, et al (2015) for direct estimates of the relationship between income and unit non-response. Return to text
3. See, especially, Section II of Bricker et al. (2015). The SCF captures the full wealth distribution, save the Forbes 400, which we are explicitly prohibited from sampling. We add an estimate of the Forbes wealth later in this note. Return to text
4. The only wealth tax that exists in the U.S. is an estate tax applied at death to very few families. Return to text
5. Appendix B of Bricker et al. (2015) provides a detailed discussion of how the reconciled wealth concepts are created from the published FA and underlying SCF measures. See also Henriques and Hsu (2014). Return to text
6. See Figure 10 of Bricker et al. (2015). The differences in SCF and FA housing stock valuations are driven by the very different methodological approaches. In the aggregate FA data, the housing stock is valued using a perpetual inventory that involves new investment, depreciation, and a national house prices index. In the SCF, house values are owner-reported. Hsu and Henriques (2014) discuss how house values in the SCF compare favorable to other micro-based estimates, such as the American Housing Survey, and Henriques (2013) provides evidence that SCF respondent house valuations generally track local area house price indexes quite well. Return to text
7. Aggregate household sector liabilities in the SCF have remained fairly steady at around 90 percent of FA liabilities. Non-housing assets (since 2000) have moved in a fairly tight range above the comparable FA measure, despite large swings in the values of assets such as stocks, privately-held businesses, and commercial real estate. See Brown, et al. (2011) for a discussion of how SCF debt by category tracks relative to Equifax aggregates. Return to text
8. We adjust the SCF data to match the administrative data, and not vice versa, because the administrative data do not lend themselves to many of these adjustments. For example, we cannot make families from tax units. Return to text
9. The actual unit of observation in the SCF is the "Primary Economic Unit," or PEU, which is somewhere between the Census "family" and "household" concepts. See the appendix to Bricker et al. (2014) for a precise definition. The number of families in the SCF is benchmarked to that found in the Current Population Survey. The number of tax units includes an estimate of non-filers. Return to text
10. As discussed in the working paper, even when additional tax units (such as dependent children) do exist in high end families, subtracting those dependent filer incomes from total family income will not substantially alter the primary tax unit resources. Thus, for all intents and purposes, high end families are the same as high end tax units. Return to text
11. Mentioned above, we subtract vehicles, miscellaneous financial and nonfinancial assets, cash value of whole life insurance, and miscellaneous debt from the standard SCF balance sheet, then add back in DB pension wealth using an approach suggested by Saez and Zucman (2014). The process is described in Appendix B of Bricker et al. (2015). Return to text
12. Also, as shown by the widening of the gap between the orange and blue lines in Figure 11 of Bricker et al. (2015), the fact that house values in SCF have risen relative to FA suggests that the impact of benchmarking imparts a positive bias on administrative top shares estimates and has grown over time. Return to text
13. In fact, families with net worth above the Forbes 400 cutoff can make it into the sample, because of evolving wealth or types of wealth (private holdings) that Forbes may not know about (Vermeulen, 2014). See Vermeulen (2014) for a discussion of using Forbes data in conjunction with survey data to re-estimate top wealth shares. Return to text
14. The black line from Saez and Zucman (2014) presumably should be plotted with the same confidence interval because the administrative data used there are themselves a sample of tax records (Statistics of Income, 2012). Return to text
15. The rate of return on assets varies across the wealth distribution in the SCF. In the 2013 SCF, the average rate of return on fixed-income assets (found by the ratio of SCF interest income to SCF fixed-income assets) across all households is about 1 percent, but the average rate of return for the top 1 percent of families is almost 6 percent. The exercise described here and in figure 4 assumes only a 2 percent rate of return for the top 1 percent in recent years. Returns greater than 2 percent are easily attained for families holding portfolios of AAA corporate bonds or municipal bonds (where returns averaged nearly 5 percent even in 2010). Return to text
16. The dashed black line in this exercise is found in Appendix Table B40 in Saez and Zucman (2014). In the black line in figures 1, 2 and 4, both the top 1 percent and bottom 99 percent are assumed to have the same rate of return on fixed-income assets (the ratio of Financial Accounts fixed-income assets to SOI interest income). Return to text
17. This is especially true if the capitalized wealth value found for 2012 is an outlier in the trend. Many wealthy families timed their capital income to be realized in tax year 2012 -- before tax rates went up in 2013 -- suggesting that the 2012 value may be an outlier (Wolfers, 2015). Return to text
Please cite as:
Bricker, Jesse, Alice Henriques, Jacob Krimmel, and John Sabelhaus (2015). "The Increase in Wealth Concentration, 1989-2013," FEDS Notes. Washington: Board of Governors of the Federal Reserve System, June 05, 2015. https://doi.org/10.17016/2380-7172.1535
Disclaimer: FEDS Notes are articles in which Board economists offer their own views and present analysis on a range of topics in economics and finance. These articles are shorter and less technically oriented than FEDS Working Papers.
