
FEDS Notes
 Print
PrintMay 14, 2015
Residual Seasonality in GDP
Charles E. Gilbert, Norman J. Morin, Andrew D. Paciorek, and Claudia R. Sahm
Real GDP growth stalled in the first quarter of this year, according to the advance estimate from the Bureau of Economic Analysis (BEA). With a second year in a row of unusually weak first-quarter growth, some analysts have argued that there may be residual seasonality in the GDP data, that is, a predictable seasonal pattern remains in the published data.1 This argument implies that there is predictable weakness in first-quarter GDP growth that will be followed by predictable strength in the subsequent three quarters of the year. However, residual seasonality is only one of many explanations--such as statistical noise, unusually harsh weather, and other idiosyncratic factors--that might lead one to discount some of the weak first-quarter GDP growth. Indeed, our analysis here does not find convincing evidence of material residual seasonality in GDP in recent years.
Figure 1 shows quarterly GDP growth relative to the growth in GDP for the year as a whole in each year since 2010 (measured from fourth quarter to fourth quarter). As noted in the inset box, from 2010 to 2014, first-quarter GDP growth was, on average, 1.7 percentage points lower than Q4/Q4 growth. This large deviation is driven primarily by 2011 and 2014, and excluding those two years yields a much more modest deviation. This year, for comparison, the BEA's advance estimate of first quarter growth is 0.2 percent, 2.2 percentage points below Q4/Q4 growth in 2014.2
| Figure 1: Real GDP, Quarterly Change Relative to Q4/Q4 Change |
|---|
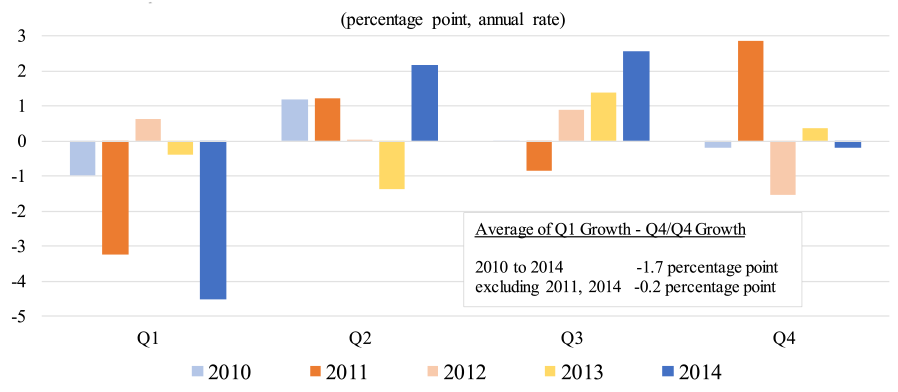 |
Note: The GDP estimates are current (seasonally adjusted) estimates from the Bureau of Economic Analysis (BEA).
There are a variety of ways to assess whether below-average growth in the first quarter predicts meaningfully lower first-quarter (and higher rest-of-year) growth going forward. One approach is a bootstrap analysis, which can tell us how likely the recent quarterly patterns would be, under the assumption that there is no such predictable seasonality in the data. In this analysis, we randomly resample (with replacement) real GDP growth across all quarters from 2010 to 2014. In our simulations, average growth in any calendar quarter differs from overall average growth by at least 1.7 percentage points--the actual outcome in Figure 1--about 7 percent of the time.3 This simple test suggests that there is something a bit unusual about the recent first quarter weakness, but the evidence is fairly weak: The bootstrap does not reject the null hypothesis of no seasonality at the commonly applied significance level of 5 percent.
We can also test for residual seasonality in GDP a second way, by applying the X-12-ARIMA algorithm. When we apply the tests of seasonality that are part of the X-12 seasonal adjustment process to the series already adjusted by the BEA, the pattern of below-average growth in the first quarter is not sufficiently strong to indicate statistically significant seasonality. More specifically, when we run X-12-ARIMA on real GDP growth, we do not find identifiable residual seasonality (using three standard statistical tests) for the 2010 to 2014 period, as shown in Table 1.4 The level of nominal GDP also passes these tests for residual seasonality (not shown).5 The lack of statistical evidence may reflect the noisiness in the series and the short time period, but expanding the time horizon back to 2005, in the far right column, also fails to reveal statistically significant residual seasonality in real GDP growth.
| Table 1: Number of Tests Showing Significant Residual Seasonality in Real GDP and Major Sub-Aggregates |
|---|
| 2010-14 | 2005-14 | |
|---|---|---|
| GDP | 0 | 0 |
| Real GDP Growth Contributions: | ||
| Exports | 1 | 2 |
| Imports | 1 | 0 |
| Federal Government | 1 | 2 |
| State and Local Government | 3 | 2 |
| Nonresidential Structures | 0 | 3 |
| Residential Investment | 0 | 1 |
| Private Domestic Final Purchases | 0 | 0 |
Note: The three standard X-12 ARIMA tests for residual seasonality are applied to the current BEA estimates. Other major sub-aggregates including Personal Consumption Expenditures, Equipment Investment, Intellectual Property Products, and Change in Inventories did not show any signs of residual seasonality by the three tests.
If we look instead at major components of GDP, however, there is some evidence of residual seasonality.6 The seasonally adjusted contributions to GDP growth of exports, federal and state and local government expenditures, and nonresidential structures all show statistically significant seasonality by at least two of three tests using data from 2005 to 2014.7 And Figure 2 shows that, in fact, several of these components have had below-average contributions to GDP in the first quarter since 2010.
| Figure 2: Contributions to Real GDP Growth, by Quarter, percentage points at an annual rate, 2010 to 2014 |
|---|
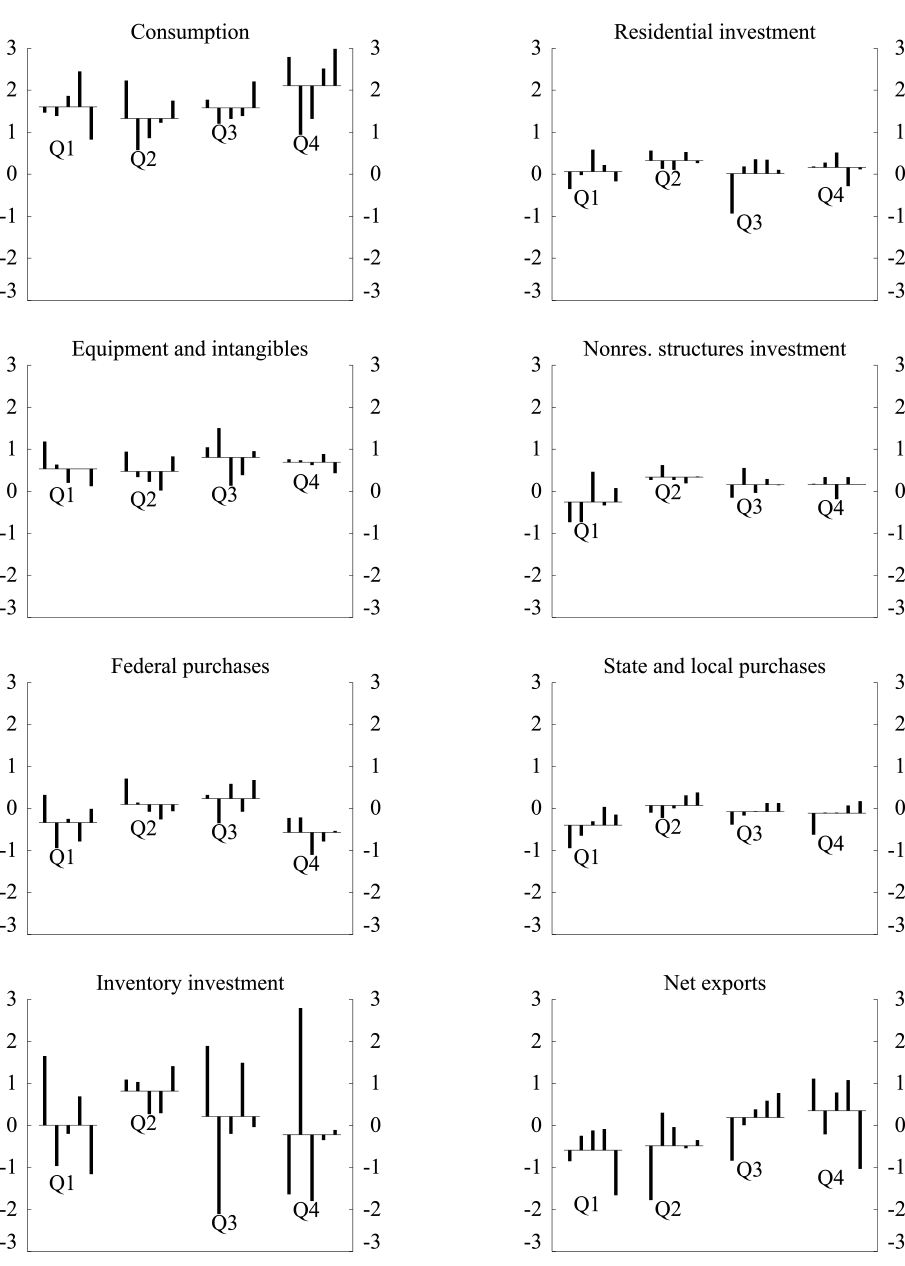 |
Note: Seasonally adjusted, as published by the BEA.
The horizontal lines are the average contributions to real GDP growth for a given quarter since 2010.
Other than investment in nonresidential structures, these spending categories are outside of private domestic final purchases (PDFP)--a less volatile subcomponent of GDP that is typically a better predictor than GDP itself of GDP growth for the next quarter.8 The bottom row of Table 1 shows that PDFP also does not show statistically significant signs of residual seasonality. Figure 3 shows the quarterly contribution of PDFP to GDP growth relative to Q4/Q4 PDFP contributions. Comparing the inset box in Figure 3 to the inset box in Figure 1 indicates that the deviation in first-quarter PDFP for 2010 to 2014 is noticeably smaller than for GDP, at only 0.6 percentage point, and there is no relative weakness in first-quarter PDFP when 2011 and 2014 are excluded.
Next we compare these recent patterns in PDFP to the first quarter this year: In the advance release, the BEA estimated that PDPF contributed only 0.9 percentage point to real GDP growth in the first quarter, 1.9 percentage points below its Q4/Q4 contribution in 2014. That is, much of the relative weakness in first-quarter GDP growth (as of the advance release) is accounted for by PDFP--a result that is inconsistent with apportioning much of the blame for first-quarter weakness to residual seasonality, given where we see evidence of it in the data.
| Figure 3: Real PDFP, Quarterly Contrib. Relative to Q4/Q4 Contrib. |
|---|
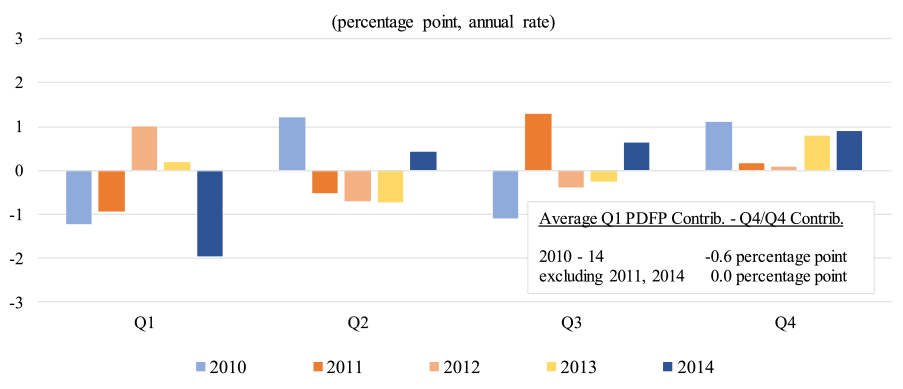 |
Note: The GDP estimates are current (seasonally adjusted) estimates from the Bureau of Economic Analysis (BEA).
In summary, real GDP growth has been weaker on average in the first quarter of recent years than growth in the other three quarters--and the first quarter this year may be on track to repeat that pattern. Nevertheless, we find no firm evidence that this pattern primarily reflects residual seasonality. Instead, the first-quarter weakness appears to be driven by a couple of outlier years and by soft readings in a varying subset of underlying components.
1. See, for instance, the NY Times opinion piece by Justin Wolfers, "Why You Can't Put Faith in Reports of First-Quarter Economic Slumps," http://www.nytimes.com/2015/04/24/upshot/why-you-cant-put-faith-in-reports-of-first-quarter-economic-slumps.html. As discussed in the BEA's FAQ "How Does the BEA Account for Seasonality in GDP?", while much of the source data that the BEA uses to construct its estimates of GDP are seasonally adjusted, residual seasonality could arise in the quarterly figures for a variety of reasons, including independent adjustment of nominal values and price deflators and aggregation of seasonally adjusted monthly data to the quarterly frequency. Return to text
2. The relative weakness of the first quarter in recent years is more apparent in the current vintage of GDP estimates, which has gone through several revisions, than in the initial estimate published by the BEA. For example, in 2011:Q1, the first three estimates of GDP growth were all just under 2 percent. Only in subsequent estimates was GDP growth in that quarter revised down sharply to its current estimate of -1.5 percent. Return to text
3. The bootstrapped probability that the first quarter, in particular, would have growth at least 1.7 percentage points above or below average is only about 2 percent. However, before looking at the data, there is no reason to single out the first quarter, in particular, as the outlier, so we think our test in the text that some quarter would deviate by that much makes more sense. But the more general point to be made here is that the specific statistical test chosen can affect the inferences drawn, particularly when the evidence is mixed. Return to text
4. X-12-ARIMA is seasonal adjustment software developed by the United States Census Bureau. See the Census's "FAQ on Seasonal Adjustment" for a general overview of seasonal adjustment. The three standard tests (in X-12 ARIMA's table D8 A) for seasonality are: an F-test for stable seasonality (basically a Chi-square test under the null hypothesis that the average deviations from trend for the series for each quarter are equal); the Kruskal-Wallis non-parametric test (which tests whether the average rank of the observations for each quarter are different); and an F-test for moving seasonality. Note these statistical tests do not focus specifically on the first quarter but look for a regular pattern relating to the calendar. Also, the tests are designed to provide a check for seasonality in series that have not already been seasonally adjusted, and are just indicative of residual seasonality issues for series that have already been adjusted. Return to text
5. One reason to examine nominal levels is that much of the source data used by the BEA are nominal. Another reason is that the prices used to calculate real GDP and its components appear to exhibit residual seasonality. Ekaterina Peneva finds that core PCE price inflation tends to be higher in the first half of the year than in the second half of the year, which would tend to lower real PCE during that time: http://www.federalreserve.gov/econresdata/notes/feds-notes/2014/residual-seasonality-in-core-consumer-price-inflation-20141014.html Return to text
6. A more thorough review of residual seasonality might also examine more finely disaggregated pieces, although it would require caution in interpreting the statistical significance of extreme outcomes while running a large number of tests. Return to text
7. Of course, the results may be sensitive to the time period. Using data from 1985 to 2014, real GDP growth does show statistically significant seasonality by one of the three tests, but only the contribution to GDP growth of federal government expenditures shows statistically significant seasonality by at least two of three tests. Return to text
8. PDFP includes personal consumption expenditures and private investment in structures, equipment, and intellectual property products. It excludes government spending, net exports, and inventory investment. Return to text
Please cite as:
Gilbert, Charles, Norman Morin, Andrew D. Paciorek, and Claudia R. Sahm (2015). "Residual Seasonality in GDP," FEDS Notes. Washington: Board of Governors of the Federal Reserve System, May 14, 2015. https://doi.org/10.17016/2380-7172.1538
Disclaimer: FEDS Notes are articles in which Board economists offer their own views and present analysis on a range of topics in economics and finance. These articles are shorter and less technically oriented than FEDS Working Papers.
