
FEDS Notes
 Print
PrintOctober 7, 2015
Will Household Expectations Follow Professional Forecasters'?
Ekaterina Peneva, Daeus Jorento, Emily Massaro
In January 2012 the FOMC announced an explicit 2 percent objective for inflation as measured by the price index for Personal Consumption Expenditures (PCE). A recent analysis of the effect of the FOMC's announcement by Detmeister et al. (2015) concluded that the announcement "had some effect on professional forecasters' long-run inflation expectations, but not on household expectations." However, even if the FOMC's announcement has not yet had an influence on household expectations, it still could affect them indirectly in the future. Some existing academic research, for example Mankiw and Reis (2002), argues that agents do not update their information sets frequently. Carroll (2003) suggests that when households do update their information sets, they update their expectations using those of "more-informed" agents, such as professional forecasters. The learning from professional forecasters is not necessarily because professional forecasters are better at predicting inflation (though they may be), but rather because households' views derive mainly from news reports, which reflect the views of the professional forecasters.
Unfortunately, we find that some of the results from the existing research on how households form their inflation expectations are very fragile: Specifically, the results--that households' expectations are updated toward the views of the professional forecasters--hold only for particular expectations definitions and are generally much weaker if only the last 15-20 years are considered.
Following Carroll (2003), we start with examining Granger causality between households' and professional forecasters' expectations for inflation over the next year.1 For households we use information on expected price changes from the Michigan Survey of Consumers (MSC) and for professional forecasters we use the expectations of Consumer Price Index (CPI) inflation from the Survey of Professional Forecasters (SPF). Using these data we can closely replicate Carroll (2003) results on Granger causality over the sample period 1981 to 2000.2 In particular over this time period, as Carroll found and as shown in equations 1 and 2 in Table 1, professional forecasters' inflation expectations Granger-caused the households' expectations, but the households' expectations did not Granger-cause professional forecasters' expectations. This implies a one-way information flow from more-informed professional forecasters to less-informed households.
These results, however, are quite fragile. If, instead, the median expectation is used--Curtin (1996) suggests the median is preferable to the mean when examining Michigan inflation expectations due to varying effect of extreme responses--then there is no evidence of Granger causality--neither from households to professional forecasters, nor from professional forecasters to households over the 1981 to 2000 time period (equations 3 and 4).3 Similarly, if we use a more recent time period, from the beginning of 1995 to the end of 2014, we cannot find the Granger causality from professional forecasters to households for either the mean measures (equations 5 and 6) or for the median (not shown).
| Table 1: Granger causality between year-ahead inflation expectations of households (HH) and professional forecasters (PF) |
|---|
|
Equation number |
Sample |
Dependent variable |
Independent variables | R2 | ||
|---|---|---|---|---|---|---|
| Constant | Sum of coefficients on | |||||
| PF (8 lags) | HH (8 lags) | |||||
| 1 | 1981:Q3-2000:Q2 | PF mean |
0.59 (0.12) |
1.15 (0.00) |
-0.28 (0.18) |
0.87 |
| 2 | 1981:Q3-2000:Q2 | HH mean |
1.39 (0.01) |
0.61 (0.00) |
0.12 (0.67) |
0.70 |
| 3 | 1981:Q3-2000:Q2 | PF median1 |
0.47 (0.14) |
1.05 (0.00) |
-0.22 (0.21) |
0.90 |
| 4 | 1981:Q3-2000:Q2 | HH median1 |
0.65 (0.06) |
0.12 (0.20) |
0.66 (0.00) |
0.63 |
| 5 | 1995:Q1-2014:Q4 | PF mean |
0.37 (0.03) |
0.91 (0.00) |
-0.05 (0.22) |
0.87 |
| 6 | 1995:Q1-2014:Q4 | HH mean |
1.63 (0.00) |
-0.15 (0.30) |
0.66 (0.00) |
0.47 |
Note: P-values for the constants and the coefficients are in brackets.
1. We use the median of both HH and PF in this equation. Return to table
With the Granger causality tests results in hand, Carroll (2003) constructs a baseline model for inflation expectations, where households slowly update their macroeconomic views using those of the professional forecasters. In this simple model, household inflation expectations are a weighted average of the current expectations of professional forecasters and the expectations that household held in the previous period. We replicate this exercise, however, we also include a constant to account for the historical mean difference between the expectations of household and professional forecasters, which could be due, among other reasons, to somewhat different questions asked in the two surveys.4 Over the two decades ending in 2000 (equations 1 and 2 in Table 2), the information flow from professional forecasters to households was strong with the coefficient on professional forecasters' mean expectations almost twice as high as the coefficient on households own lags, and these simple regressions explain over 80 percent of the variation in household inflation expectations.5 However, in the most recent two decades these results fall apart: The weights the regressions place on professional forecasters in determining household expectations fall by two-thirds and are no longer statistically significant. The weight placed on households own lags doubles, and the regressions can now explain less than half of the variance in household inflation expectations. The results hold both for the mean and the median of the household expectations--equations 3 and 4 in Table 2.6 The results for the most recent 20-year period are consistent with Pfajfar and Santoro (2013) finding based on micro data that the households who update their expectations do not revise them toward the expectations of professional forecasters.
| Table 2: Testing a model for the behavior of households' year-ahead inflation expectations |
|---|
| Equation number |
Sample | Dependent variable |
Independent variables | R2 | ||
|---|---|---|---|---|---|---|
| Constant | Current PF | 1 lag of Dependent variable |
||||
| 1 | 1981:Q3-2000:Q2 | HH mean | 0.99 (0.00) |
0.57 (0.00) |
0.26 (0.00) |
0.86 |
| 2 | 1981:Q3-2000:Q2 | HH median1 | 0.78 (0.00) |
0.33 (0.00) |
0.37 (0.00) |
0.81 |
| 3 | 1995:Q1-2014:Q4 | HH mean | 0.99 (0.00) |
0.19 (0.31) |
0.61 (0.00) |
0.40 |
| 4 | 1995:Q1-2014:Q4 | HH median1 | 0.93 (0.00) |
0.11 (0.41) |
0.60 (0.00) |
0.36 |
Note: P-values for the constants and the coefficients are in brackets. All standard errors are corrected for heteroskedasticity and serial correlation using Newey-West procedure.
1. We use the median of both HH and PF in this equation. Return to table
We now shift from examining household expectations of inflation over the next year to expectations of inflation over a longer-term horizon, which, arguably, should be more influenced by monetary policy and the FOMC's announcement of a long-run inflation objective than should expectations of inflation over the next year. We use the professional forecasters' expectations for CPI inflation over the next 10 years from the SPF and household expectations for inflation over the next 5 to 10 years from the MSC.7 In the last 20 years, as table 3 shows, there is no evidence that households' inflation expectations Granger-cause professional forecasters' expectations, but there is evidence that professional forecasters' expectations Granger-cause households' inflation expectations if the means of those expectations are used: The sum of the coefficients on lagged household expectations is small and insignificant in the regression explaining professional forecasters' expectations (equation 1), but the sum of the coefficients on lagged professional forecasters' expectations is large and significant in the regression explaining households' expectations (equation 2). However, if median, rather than mean, expectations are used, the evidence for Granger causality from professional forecasters to households is much weaker--the coefficient on lagged PF expectations is considerably smaller and barely statistically significant (equation 4).
| Table 3: Granger Causality between long-term inflation expectations of households (HH) and professional forecasters (PF) |
|---|
|
Equation number |
Sample |
Dependent variable |
Independent variables | R2 | ||
|---|---|---|---|---|---|---|
| Constant | Sum of coefficients on | |||||
| PF (8 lags) | HH (8 lags) | |||||
| 1 | 1995:Q1-2014:Q4 | PF mean |
0.22 (0.05) |
1.01 (0.00) |
-0.08 (0.43) |
0.89 |
| 2 | 1995:Q1-2014:Q4 | HH mean |
0.54 (0.03) |
0.65 (0.05) |
0.35 (0.14) |
0.66 |
| 3 | 1995:Q1-2014:Q4 | PF median1 |
0.30 (0.21) |
0.86 (0.00) |
0.01 (0.93) |
0.91 |
| 4 | 1995:Q1-2014:Q4 | HH median1 |
0.83 (0.01) |
0.14 (0.10) |
0.59 (0.00) |
0.53 |
Note: P-values for the constants and the coefficients are in brackets. Durbin-Watson statistic did not indicate serial correlation in the residuals and the standard errors are not corrected for serial correlation.
1. We use the median of both HH and PF in this equation. Return to table
We also test Carroll's baseline learning model from table 2, replacing year-ahead inflation expectations with long-term inflation expectations (see table 4). Using the past 20 years of data we can say that there is some evidence that households are paying attention and using professional forecasters' expectations to update their own expectations of longer-term inflation:
In equations 1 and 2, the coefficients on professional forecasters' expectations are positive and significant, though considerably smaller for the median than the mean. However, the size and the significance of the coefficients on professional forecasters' expectations is entirely due to the first five years of the sample period: 1995-1999. If we limit the sample to the last 15 calendar years, the coefficients on professional forecasters' expectations becomes very small and statistically insignificant.
| Table 4: Testing a model for the behavior of households' long-term inflation expectations |
|---|
| Equation number |
Sample | Dependent variable |
Independent variables | R2 | ||
|---|---|---|---|---|---|---|
| Constant | Current PF | 1 lag of Dependent variable |
||||
| 1 | 1995:Q1-2014:Q4 | HH mean | 0.51 (0.02) |
0.43 (0.00) |
0.53 (0.00) |
0.68 |
| 2 | 1995:Q1-2014:Q4 | HH median1 | 0.98 (0.00) |
0.16 (0.00) |
0.52 (0.00) |
0.55 |
| 3 | 2000:Q1-2014:Q4 | HH mean | 1.71 (0.00) |
0.05 (0.75) |
0.45 (0.00) |
0.17 |
| 4 | 2000:Q1-2014:Q4 | HH median1 | 1.18 (0.00) |
0.05 (0.65) |
0.54 (0.00) |
0.28 |
Note: P-values for the constants and the coefficients are in brackets. All standard errors are corrected for heteroskedasticity and serial correlation using Newey-West procedure.
1. We use the median of both HH and PF in this equation. Return to table
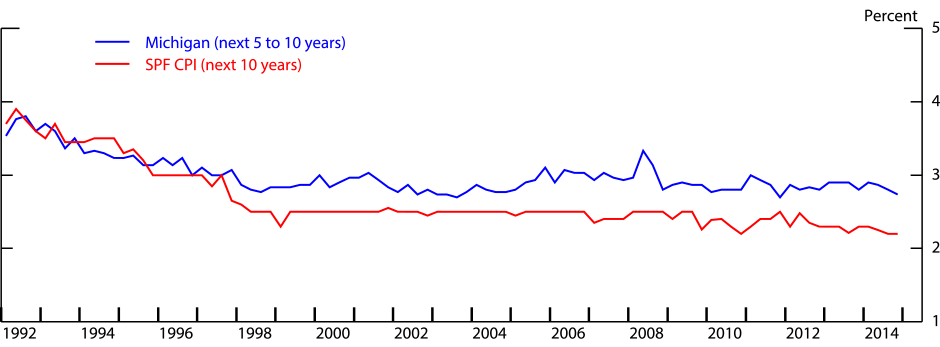
The results found here, namely, that there is less evidence of households inflation expectations being updated with professional forecasters' expectations over the recent past than in the 1980 to 2000 period, is perhaps not surprising, given that from the early 1980s through the late 1990s actual inflation and both households' and professional forecasters' year-ahead inflation expectations fell dramatically. It is quite possible that during this dynamic period households were paying close attention to what was being said about inflation in the news. Inflation expectations of both professional forecasters and household, on the other hand, have been much less variable over the past 15 years (Chart 1 shows the MSC long-run inflation expectations and the SPF expectations for long-run CPI inflation, starting in the year they are both available). As Detmeister et al. (2015) noted, the announcement of the inflation objective seemed to have an effect, albeit a small one, on the professional forecasters' expectations but not on the households' expectations. It is quite possible, that in an environment of low and stable inflation, it is not worthwhile for households to update their inflation expectations or to pay much attention to more-informed agents. If so--and if household expectations do play some role in wage and price setting--then the SPF's convergence to a 2 percent rate of longer-term expected PCE inflation might not be particularly relevant for determining how actual inflation will behave in coming years.
References
Carroll, Christopher, "Macroeconomic Expectations of Households and professional Forecasters," Quarterly Journal of Economics, 118 (2003), 269-298.
Curtin, Richard, "Procedure to Estimate Price Expectations," Manuscript, University of Michigan Survey Research Center, (1996).
Detmeister, Alan, Daeus Jorento, Emily Massaro, and Ekaterina Peneva, "Did the Fed's Announcement of an Inflation Objective Influence Expectations?" FEDS Notes, Board of Governors of the Federal Reserve System (U.S.), (2015).
Doepke, Joerg, Jonas Dovern, Ulrich Fritsche, and Jiri Slacalek, "The Dynamics of European Inflation Expectations." The B.E. Journal of Macroeconomics, Vol. 8: Iss. 1 (Topics), (2008).
Mankiw, N. Gregory, and Ricardo Reis, "Sticky Information versus Sticky Prices: A Proposal to Replace the New Keynesian Phillips Curve." Quarterly Journal of Economics, 117 (2002), 1295-1328.
Pfajfar, Damjan and Emiliano Santoro, "News on Inflation and the Epidemiology of Inflation Expectations." Journal of Money, Credit and Banking, 45 (2013), 1045-1067.
1. Granger causality tests are tests of predictive content, in other words whether the independent variables have predictive content for the dependent variable. Return to text
2. Our results--using current data--are very close but do not perfectly replicate Carroll's because historical data for the mean of household inflation expectations was revised in 2006. Return to text
3. As Carroll (2003), for this analysis we use the estimated means and medians as reported by the MSC rather than the means and medians from the raw micro data. Return to text
4. Carroll (2003) advocates against using a constant in a learning model as a non-zero constant implies that households' predictions are permanently biased away from the professional forecasters' expectations or, alternatively, a non-zero constant implies that households are updating their expectations through alternative channels. Given that the wedge between households' and professional forecasters' expectations have persisted in the years following Carroll's study, despite the relatively low and stable inflation, we allow for a constant in all models we consider. Return to text
5. The results for the mean and for the 1981-2000 period are essentially the same as in Carroll (2003). Even if the median rather than the mean is used (see equation 2), the coefficient on the PF expectations is relatively high and statistically significant, implying information flow from professional forecasters to households. This is in contrast to the finding in Table 1 (equation 4) that median PF expectations do not Granger-cause the median HH expectations. The difference arises because in the models presented in Table 2 current rather than past PF expectations are used to explain current HH expectations and because lags 2 through 8 of the dependent variable are dropped: Either one of those changes can lead to a statistically significant coefficient on PF expectations.
For Europe, Doepke et al. (2008) find that Carroll's sticky information model, in which households update their expectations using those of professional forecasters, captures well the dynamics of households' inflation expectations in the four European countries they study albeit the frequency of updating being lower than in the U.S. Return to text
6. As in Carroll (2003), we also allow for the possibility that households update their expectations using recent realized inflation. However, including the most recent published annual headline CPI inflation in the equations in Table 2 does not alter the results in any meaningful way for either the 1981-2000 period or for the 1995-2014 period. Recent inflation does not enter with a significant coefficient, except in equation 2, where it enters with a relatively small coefficient. Return to text
7. The FOMC's inflation objective is in terms of inflation as measured by the PCE price index. However, since the SPF expectations for PCE inflation over the next ten years starts only in 2007, we use the longer series SPF expectations for CPI inflation, which is available on a quarterly basis since 1992. Return to text
Please cite as:
Peneva, Ekaterina, Daeus Jorento, Emily Massaro (2015). "Will Household Expectations Follow Professional Forecasters'?" FEDS Notes. Washington: Board of Governors of the Federal Reserve System, October 07, 2015. https://doi.org/10.17016/2380-7172.1622
Disclaimer: FEDS Notes are articles in which Board economists offer their own views and present analysis on a range of topics in economics and finance. These articles are shorter and less technically oriented than FEDS Working Papers.
