
FEDS Notes
 Print
PrintMay 26, 2016
Corporate Bond Issuers' Swap Exposure to Rising Interest Rates
Richard Ogden, Francisco Palomino, Nitish Sinha, and Youngsuk Yook 1
United States corporate bond issuance has been elevated in recent years relative to historical standards (figure 1), reflecting in part accommodative financing conditions at historically low rates. This development may increase the debt rollover risk of U.S. corporations in an environment of rising interest rates.2 In particular, the rollover risk can be high if issuance has been concentrated in short-term or floating-rate bonds. The average maturity of corporate bonds has increased consistently since the Great Recession, and floating-rate bonds have remained a small fraction of the total corporate bonds outstanding, as shown in figure 2. This evidence, however, can be misleading if firms actively use interest-rate swaps to convert fixed-rate obligations to floating-rate ones. In this note, we analyze the exposure to interest-rate swaps of U.S. nonfinancial firms that recently issued corporate bonds. In summary, we find that:
- Only 13 percent of our sample of bond issuers have swaps contracts.
- Speculative grade firms with swaps have weaker balance sheets than their peers without swaps, making them more vulnerable to a deterioration in external financing conditions.
- However, only 10 percent of speculative grade firms use swaps, and their swap exposure is fairly small relative to their total debt.
- The results should be taken with caution since the analysis excludes possible swap exposure of firms obtaining external financing only through loans.
| Figure 1: Gross Issuance of Nonfinancial Corporate Bonds |
|---|
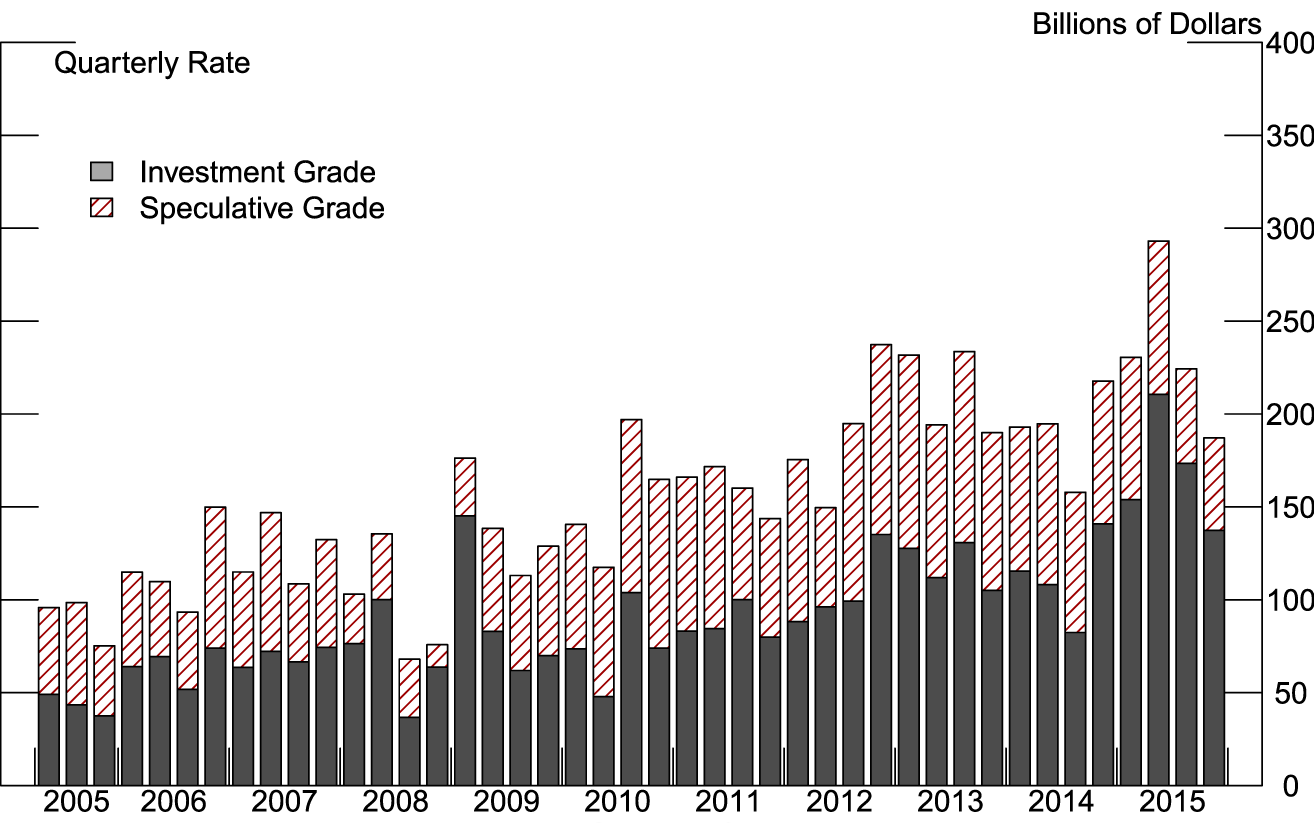 |
Note: Bonds are categorized by Moody's, Standard & Poor's and Fitch.
Source: Mergent, Fixed Income Securities Database (FISD).
| Figure 2: Fraction of Non-financial Corporate Floating Rate Notes |
|---|
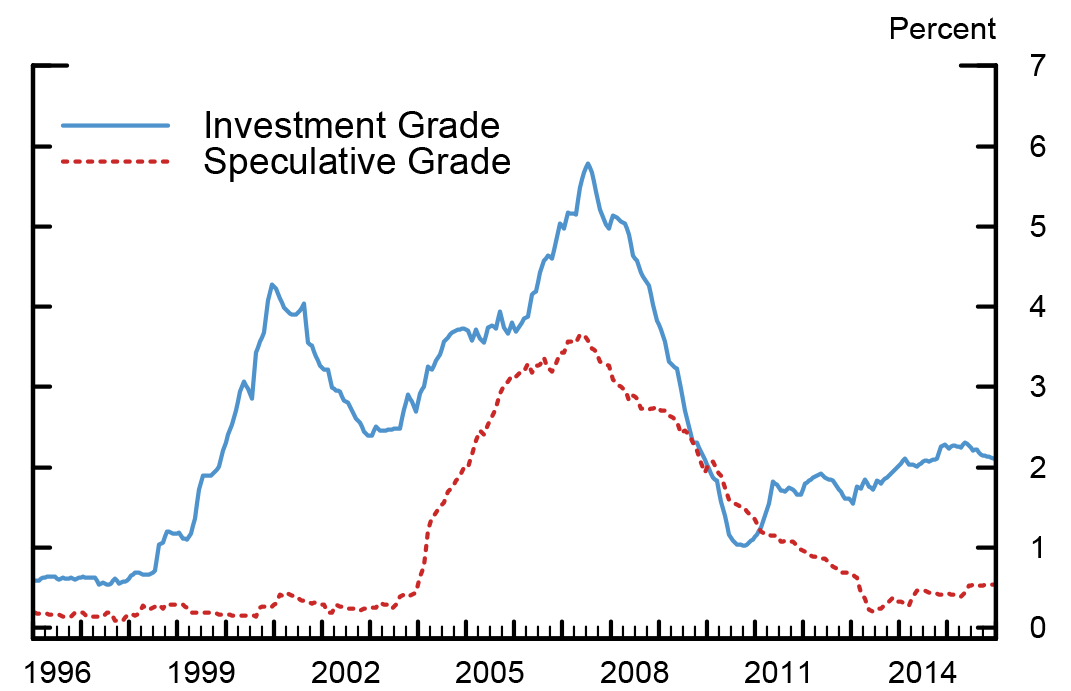 |
Source: Mergent, Fixed Income Securities Database (FISD): Shown as fraction of total amount outstanding.
Analysis of Interest Rate Swap Usage
We examined the 322 nonfinancial firms that issued bonds between July 1, 2015, and November 30, 2015, according to the Mergent Fixed Income Securities Database. To estimate the exposure of these firms to interest-rate swaps, we searched through their Form 10-Qs in the Securities and Exchange Commission (SEC) Edgar database. Publicly traded corporations are required to file this form quarterly with the SEC. They typically disclose their use of derivatives in a section dedicated to address their exposure to various risks, including interest rate risk. We searched 10-Qs filed between September and December 2015 using the keywords "interest rate swap" and "interest-rate swap." 3 We read the 10-Qs of all firms containing these keywords to check whether they have outstanding swaps positions and to obtain the type and notional amounts of these swaps.
Of the 322 bond-issuing firms, only 43 (13 percent) reported having outstanding swaps contracts. These firms used receive-fixed pay-floating swaps (generally referred to as fair value hedges), receive-floating pay-fixed swaps (generally referred to as cash flow hedges), or both. Most firms reported that they mainly used swaps for hedging purposes: They noted they used swaps contracts to maintain a desired mix of fixed- and floating-rate debt, or to mitigate earnings and cash flow fluctuations that may result from interest rate volatility. In addition, some firms linked their fair value hedges to particular fixed-rate bond issues. This purpose is also supported by evidence in Covitz and Sharpe (2005), who find that differences in debt structure across firms and time tend to be counterbalanced by differences in their derivatives positions.
We cannot rule out, however, the possibility that receive-fixed pay-floating swaps are also used to speculate on future interest rate changes. For example, some firms noted that lowering overall borrowing costs was one of the objectives of using swaps, in line with the findings of Faulkender (2005). These firms could be especially vulnerable to possible rate increases.
Table 1 summarizes the swap exposure of the 43 firms. Of particular interest are 19 firms reporting fixed-to-floating swaps. Ten of these firms have only fixed-to-floating swaps while the other nine also have receive-floating pay-fixed swaps. The average reported notional amount of fixed-to-floating swaps is $1,840 million, substantially larger than the $373 million average receive-floating pay-fixed swaps position. Unfortunately, 9 firms do not specify whether these contracts are fixed-to-floating or floating-to-fix swaps.
| Table 1: Swaps by Contract Type |
|---|
| Fixed to Floating Only | Floating to Fixed Only | Both | Unspecified | Total | |
|---|---|---|---|---|---|
| Number of Firms | 10 (10) | 12 (15) | 9 (9) | 8 (9) | 39 (43) |
| Average Value ($ millions) | 1,839.60 | 373 | 2,016.90 | 1,332.60 | 1,325.20 |
Source: SEC Edgar database; the number of firms inside parentheses includes firms with swaps that do not report nominal values of swaps contracts. Return to text.
To better understand differences between firms with and without swap exposure, we obtained financial information from the Compustat quarterly database, and Standard & Poor's credit ratings from the Capital IQ credit ratings database. We found financial and ratings information for 243 firms of 322, including 42 with swaps contracts.4 Table 2 summarizes the characteristics of these firms.
| Table 2: Firm Characteristics |
|---|
| Number of Firms | Assets ($ millions) | Debt ($ millions) | Leverage Ratio | Cash/Assets | Swap/Debt | |
|---|---|---|---|---|---|---|
| Panel A: Full Sample | ||||||
| Firms with Swap | 42 | 27,220.46 | 9,526.54 | 0.39 | 0.07 | 0.15 |
| Firms without Swap | 201 | 19,670.37 | 6,195.43 | 0.38 | 0.12 | -- |
| Panel B: Ratings-based Subsamples | ||||||
| Investment Grade | ||||||
| Firms with Swaps | 30 | 34,452.64 | 11,395.35 | 0.35 | 0.08 | 0.15 |
| Firms without Swaps | 93 | 35,137.92 | 10,193.91 | 0.32 | 0.08 | -- |
| Speculative Grade | ||||||
| Firms with Swaps | 12 | 9,139.99 | 4,854.50 | 0.48 | 0.03 | 0.17 |
| Firms without Swaps | 108 | 6,226.61 | 2,560.50 | 0.43 | 0.15 | -- |
Source: Standard & Poor's Financial Services LLC ("S&P"), Compustat Unrestated Quarterly Data, 2016. All rights reserved. For intended recipient only. No further distribution and or reproduction permitted. Accessed via Wharton Research Data Services (WRDS); Capital IQ credit ratings database; SEC Edgar database.
Panel A shows that firms with swaps contracts tend to be larger in assets and debt, relative to firms with no exposure to swaps. The firms with swaps contracts also hold less cash relative to their assets. These differences are concentrated among firms with low credit ratings, as shown in panel B. This panel reports characteristics of these firms sorted by their credit ratings. Speculative grade firms with swaps are much larger than their peers without swaps, with their assets and debt 1.5 and 2 times as large, respectively. These firms also have higher leverage ratios (debt/assets) and hold less cash (only about 3 percent of their assets), making them more vulnerable to a deterioration in external financing conditions. Nevertheless, the number of speculative-grade firms with swaps constitutes a small fraction of the universe: Only 12 firms with swaps are rated speculative grade. Also, the size of their swap positions is small relative to their total debt: On average, speculative-grade firms have $1.1 billion worth of swaps contracts, or about 17 percent of their total debt. Finally, only 2 of the speculative-grade firms specify that they use fixed-to-floating swaps.
There are two caveats in our analysis. First, our analysis may not capture all bond issuers with outstanding interest rate swaps contracts. Firms might not use the words "interest rate swaps" when disclosing their derivatives usage in Form 10-Q.5 Second, our exercise is limited to firms issuing bonds and does not cover the exposure of firms to the corporate loan market. Expanding the analysis to include this market would provide a broader view of the exposure to rising interest rates in the nonfinancial corporate sector, as loans tend to be linked to floating rates. Ippolito, Perez and Ozdagli (2015) offer some insights into this market. They find that firms with bank loans are twice as likely as firms with n0n-bank debt to use floating-to-fixed swaps, but their remaining exposure to floating rates is still significant.
References
Covitz, D. and Sharpe, S.A. (2005). "Do Nonfinancial Firms Use Interest Rate Derivatives to Hedge? (PDF)" Finance and Economics Discussion Series, 2005-39. Washington: Board of Governors of the Federal Reserve System.
Faulkender, M. (2005). "Hedging or Market Timing? Selecting the Interest Rate Exposure of Corporate Debt," Journal of Finance, 60.
Ippolito, I., Ozdagli, A. K., and Perez, A. (2015). "The Transmission of Monetary Policy through Bank Lending: The Floating Rate Channel," CEPR Working Paper No. 9696.
1. All four authors are at the Board of Governors of the Federal Reserve System. The views expressed in this note do not necessarily reflect those of the Board of Governors, or its staff. We thank Daniel Covitz and Steven Sharpe for their helpful comments. Return to text
2. See Covitz and Sharpe (2005) for an analysis of interest rate derivative contracts in a period characterized by a steep decline in interest rates. Return to text
3. This time window excludes firms filing the form late. Some risky firms or those under distress are likely to be in this category. Return to text
4. Some firms were not matched because they were private or subsidiary firms. Return to text
5. For example, they can use phrases such as "interest-rate lock" or "derivatives." Return to text
Please cite this note as:
Ogden, Rick, Francisco Palomino, Nitish Sinha, and Youngsuk Yook (2016). "Corporate Bond Issuers Swap Exposure to Rising Interest Rates," FEDS Notes. Washington: Board of Governors of the Federal Reserve System, May 26, 2016, http://dx.doi.org/10.17016/2380-7172.1776.
Disclaimer: FEDS Notes are articles in which Board economists offer their own views and present analysis on a range of topics in economics and finance. These articles are shorter and less technically oriented than FEDS Working Papers.
