
FEDS Notes
 Print
PrintAugust 5, 2016
International Portfolio Investment Holdings of Long-term Securities in the Enhanced Financial Accounts
Elizabeth Holmquist, Max Miller, and Youngsuk Yook 1
This note and associated website provide new detail on international portfolio investment holdings of long-term securities, as part of the Enhanced Financial Accounts (EFA) initiative.2 "Portfolio investment" refers to ownership by one country's residents of less than 10 percent of an enterprise in another country.3 This project primarily focuses on cross-border holdings of long-term securities, though it does include information on short-term Treasury security holdings as well.4 The Financial Accounts of the United States report quarterly portfolio investment positions of various types of securities aggregated across all countries in table L.132 ("Rest of the World"). The data described in this note and associated website complement the Financial Accounts by providing monthly, country-level detail on the cross-border holdings of long-term securities, starting from 2012.
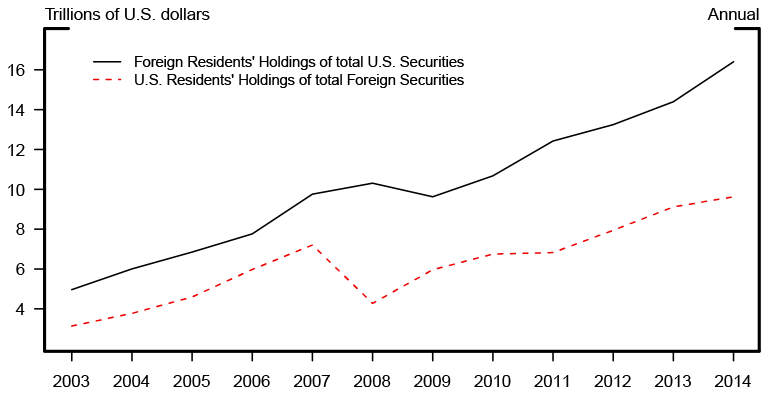
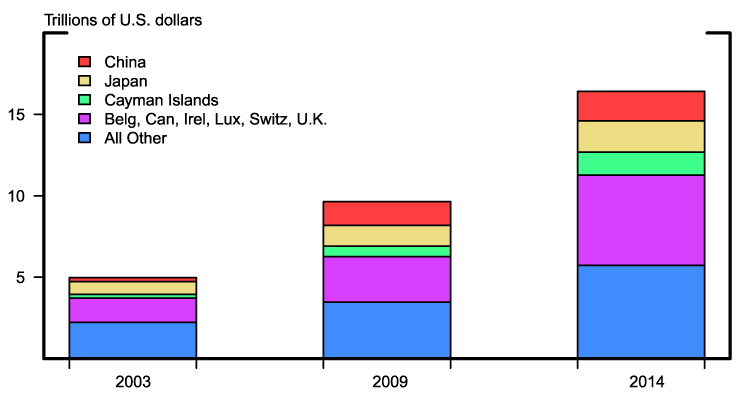
Cross-border portfolio investment holdings have grown rapidly in size and importance in the past decade. Despite considerable pullback during the recent financial crisis, both foreign residents' holdings of U.S. securities and U.S. residents' holdings of foreign securities grew more than three-fold between 2003 and 2014 (figure 1).5 International portfolio holdings of U.S. and foreign securities, long-term and short-term combined, stood at about $16 trillion and $10 trillion, respectively, in 2014. Figure 2 shows the increase in foreign holdings of U.S. securities from 2003 to 2014 for the largest holders. This country-level breakdown reveals that a handful of countries including China, Japan, the Cayman Islands, and several European countries account for much of this growth.6
 |
|
Source: Treasury International Capital System annual benchmark survey of cross-border portfolio holdings. Porfolio holdings include both long- and short-term securities.
 |
|
Note: Colors in key correspond with segments in each bar, in order from top to bottom.
Source: Treasury International Capital System annual benchmark survey of cross-border portfolio holdings. Porfolio holdings include both long- and short-term securities.
EFA Tables and Charts
The information included in the EFA tables and charts comes from Securities Long Term (SLT) data collected through the Treasury International Capital (TIC) reporting system.7 As a result, the EFA tables follow the TIC SLT's security classification rather than that used in the Financial Accounts. The TIC SLT classifies U.S. long-term securities held by foreign residents into four categories: Treasury securities, agency bonds, corporate and other bonds, and corporate stocks. Each of these four categories includes both foreign official and private holdings. Foreign long-term securities held by U.S. residents are broken into two types: bonds (including foreign government and corporate bonds) and corporate stocks. All securities are reported at current market value.
In addition to these tables on long-term securities, a supplemental EFA table provides information on foreign holdings of U.S. short-term Treasury securities. Country-level information on other types of short-term securities such as agency and corporate debt are not available on a monthly basis, but the TIC annual benchmark survey results, which include both short-term and long-term security holdings, indicate that non-Treasury short-term securities generally constitute a very small fraction of total portfolio holdings.8
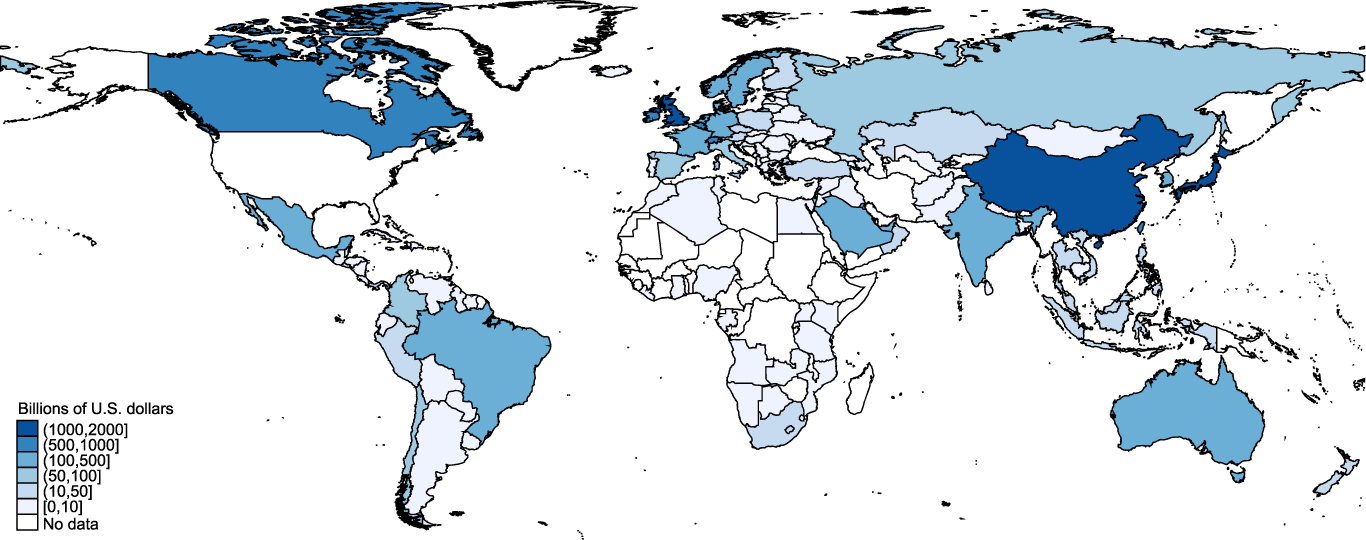
Three different types of charts complement the tables. The first set of charts are world maps reporting total portfolio holdings by country. For example, figure 3 shows a cross-sectional distribution of total U.S. long-term securities held by foreign residents as of April 2016. This figure shows that the holdings are concentrated in Europe and East Asia.
 |
|
Source: Treasury International Capital System Securities Long Term (SLT) data.
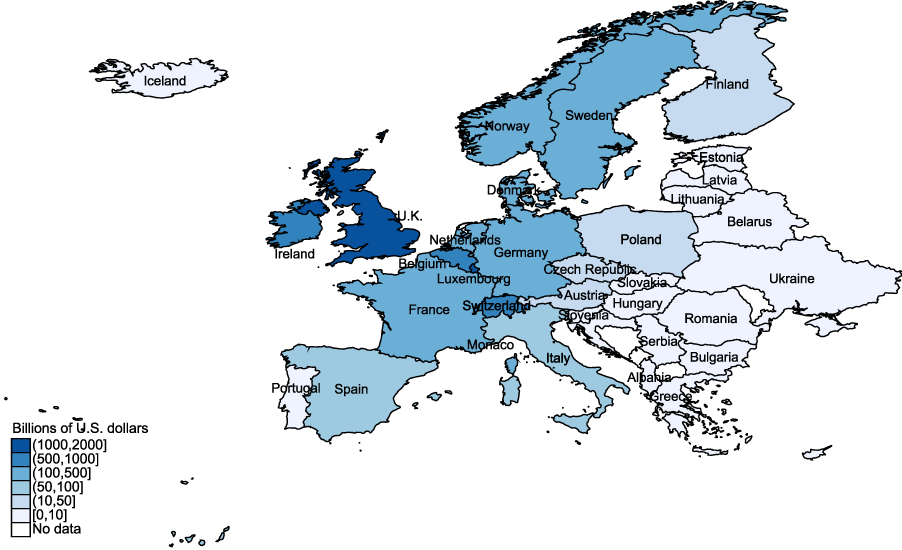
A second set of charts shows regional maps, providing a closer look at each country's holdings. Figure 4, for example, shows a snapshot of total U.S. long-term securities held by European residents.
 |
|
Source: Treasury International Capital System Securities Long Term (SLT) data.
The final set of EFA charts shows portfolio holdings of each type of security over time. For example, figure 5 shows the foreign residents' holdings of different types of U.S. long-term securities at a monthly frequency since 2012. The figure indicates that the recent increase in foreign residents' holdings of U.S. long-term securities reflects primarily an increase in foreign holdings of U.S. corporate stocks.
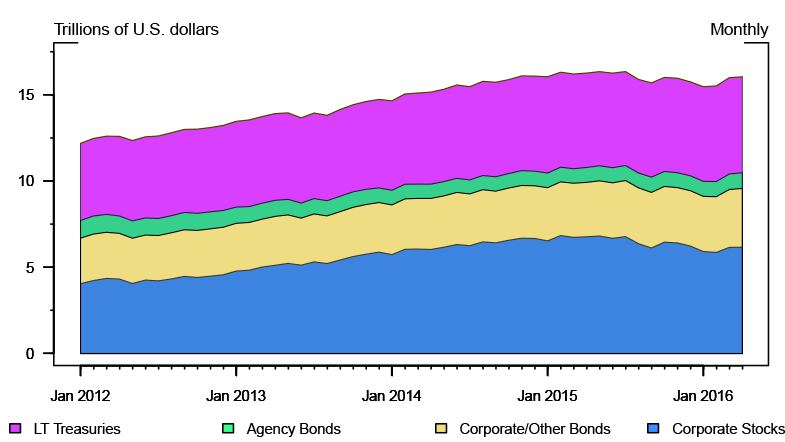 |
|
Note: Colors in key correspond with regions, in order from top to bottom.
Source: Treasury International Capital System Securities Long Term (SLT) data.
Differences between the EFA and Financial Accounts Tables
The portfolio holdings data in EFA tables and the Financial Accounts tables are slightly different due to the differences in source data. The EFA tables are based on the monthly TIC SLT, while the Financial Accounts tables are benchmarked to quarterly International Investment Position data published by the Bureau of Economic Analysis (BEA). However, the differences between EFA and the Financial Accounts portfolio positions are generally small because the BEA's estimates are primarily based on the TIC SLT and TIC annual benchmark surveys.
Furthermore, some securities are classified differently in the EFA tables and the Financial Accounts, or are shown in separate lines in the Financial Accounts. For example, U.S. corporate stocks in the EFA tables are defined to include U.S. corporate equities, mutual fund shares, and money market fund shares, while these three asset categories are shown separately in the Financial Accounts tables. In addition, U.S. corporate and other bonds in the EFA tables are defined to include both corporate bonds and municipal securities, while, again, these two categories are shown separately in the Financial Accounts. Finally, the categories labeled "U.S. short-term" and "long-term Treasuries" in the EFA tables are equivalent to "Treasury bills" and "other Treasury securities," respectively, in the Financial Accounts tables.
References
Brandner, Erika, Fang Cai, and Ruth Judson (2012). "Improving Measurement of Cross-Border Securities Holdings: The Treasury International Capital SLT," Federal Reserve Bulletin, vol. 98 (May), pp. 1-28, www.federalreserve.gov/pubs/bulletin/2012/pdf/Cross-BorderSecurities_FINAL.pdf.
Gallin, Josh, and Paul Smith (2014). "Enhanced Financial Accounts," FEDS Notes. Washington: Board of Governors of the Federal Reserve System, August 1, www.federalreserve.gov/econresdata/notes/feds-notes/2014/enhanced-financial-accounts-20140801.html.
International Monetary Fund (2009). Balance of Payments and International Investment Position Manual, 6th ed. Washington: IMF, https://www.imf.org/external/pubs/ft/bop/2007/pdf/bpm6.pdf.
Smith, Paul (2015). "Launching the Enhanced Financial Accounts," FEDS Notes. Washington: Board of Governors of the Federal Reserve System, August 28, www.federalreserve.gov/econresdata/notes/feds-notes/2015/launching-the-enhanced-financial-accounts-20150828.html.
U.S. Department of the Treasury, Federal Reserve Bank of New York, and Board of Governors of the Federal Reserve System (2016). Foreign Portfolio Holdings of U.S. Securities as of June 30, 2015. Washington: U.S. Treasury, Federal Reserve Bank of New York, and Board of Governors, May, http://ticdata.treasury.gov/Publish/shl2015r.pdf.
1. All three authors are at the Board of Governors of the Federal Reserve System. The views expressed in this article do not necessarily reflect those of the Board of Governors, or its staff. We thank our colleagues in the Global Financial Flows section for their helpful discussions. Return to text
2. See Gallin and Smith (2014) and Smith (2015) for information on the EFA initiative. Return to text
3. Ownership of 10 percent or more is classified as direct investment, and accounted for separately in Table L.230 ("Direct Investment") of the Financial Accounts of the United States. See International Monetary Fund (2009) for more detail on the definition of direct investment and portfolio investment. Return to text
4. Long-term securities are defined as those with an original term-to-maturity greater than one year or without a stated maturity date such as equities. Return to text
5. Foreign residents' holdings of U.S. securities are shown as of December-end each year, and U.S. residents' holdings of foreign securities are shown as of June-end each year. Return to text
6. Note that in these data, a country's "holdings" are not necessarily owned by its residents. Some of these countries (e.g., the Cayman Islands) serve as financial centers in which substantial amounts of securities owned by residents of other countries are managed or held in custody. See U.S. Treasury, Federal Reserve Bank of New York, and Board of Governors (2016) for more information on custodial bias. Return to text
7. The SLT form's title is "Aggregate Holdings of Long-Term Securities by U.S. and Foreign Residents." See Brandner, Cai, and Judson (2012) for more detail on the TIC Form SLT. Return to text
8. For example, foreign holdings of U.S. short-term securities, excluding Treasury bills, were 1.4 percent of total foreign holdings of U.S. securities in 2015. Return to text
Please cite as:
Holmquist, Elizabeth, Max Miller, and Youngsuk Yook (2016). "International Portfolio Investment Holdings of Long-term Securities in the Enhanced Financial Accounts," FEDS Notes. Washington: Board of Governors of the Federal Reserve System, August 5, 2016, http://dx.doi.org/10.17016/2380-7172.1814.
Disclaimer: FEDS Notes are articles in which Board economists offer their own views and present analysis on a range of topics in economics and finance. These articles are shorter and less technically oriented than FEDS Working Papers.
