
FEDS Notes
 Print
PrintJuly 29, 2016
The Role of Social Security in Overall Retirement Resources: A Distributional Perspective
Sebastian Devlin-Foltz1, Alice Henriques, and John Sabelhaus
During recent decades, the US employer-sponsored retirement system has undergone a major shift from primarily defined benefit (DB)-type plans to primarily defined contribution (DC)-type plans. Furthermore, in the past decade, participation in employer retirement plans has fallen, particularly for younger and lower-income families. In light of this, there is growing concern that wealth accumulation through employer-provided pension plans is falling short, especially for the bottom half of the income distribution.2 However, focusing only on employer-sponsored pensions provides an incomplete picture; it has left the public pension, Social Security, out of the discussion. Social Security provides near universal coverage and calculates benefits progressively, leaving lower-income households with much higher replacement rates relative to their pre-retirement income. Claims to future Social Security benefits are a key component of retirement wealth, and thus failure to include Social Security leads to a biased assessment of the overall distribution of retirement wealth.3
In this note, we first present trends in participation in employment-related retirement plans, and then provide analysis for one birth cohort, nearing retirement age, of the impact of Social Security on retirement wealth. We use the triennial Survey of Consumer Finances (SCF), analyzing the distribution of retirement wealth from a lifecycle perspective. In particular, we divide each survey-year sample into ten-year birth cohorts born between 1920 and 1990, and then sort households into income groups based on the intra-cohort distribution of "usual" income.4 Each birth cohort is observed up to nine times, at three year intervals, between the 1989 and 2013 surveys. This lifecycle approach provides a dynamic perspective on retirement plan participation and retirement wealth accumulation.
This analysis presented here paints a troubling picture of below-trend participation in the employer-sponsored pension system for younger households and lower-income households. However, when we factor in Social Security wealth to lower-income households' balance sheets near retirement, their retirement readiness, measured by the ratio of retirement assets to usual income, greatly improves in comparison to higher-income households, and the apparent distributional differences are all but eliminated. This underscores the importance of the Social Security system in stabilizing income replacement rates for the most vulnerable Americans.
Participation in Employer-Sponsored Retirement Plans
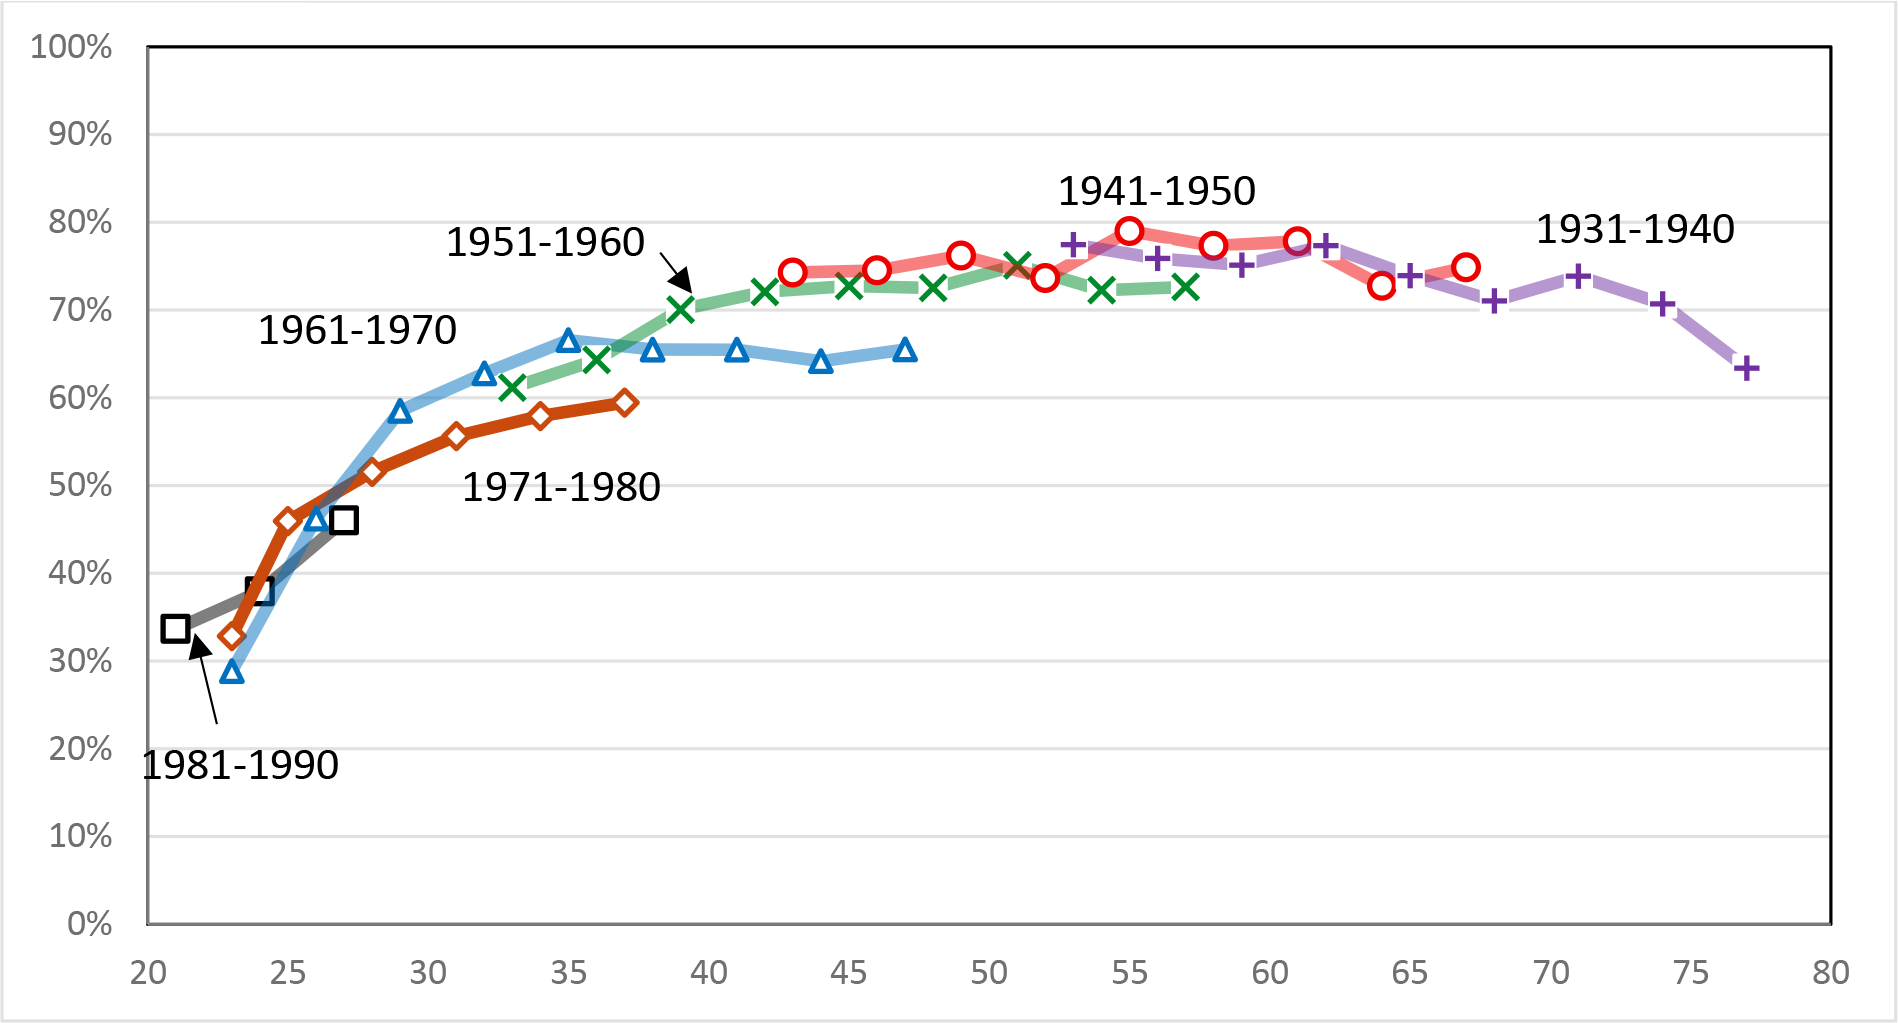
The SCF cross-sections used here span the period 1989 to 2013, and thus any given birth cohort can be tracked for (at most) a twenty-four year period. Looking across birth cohorts, and using all of the SCF surveys, one sees a very predictable lifecycle pattern in retirement plan participation by age (Figure 1). The overall pattern is hump-shaped, as retirement plan participation (generally) rises steeply for families as they move from their twenties to their fifties, before stabilizing, and declining (though perhaps only slightly) for families that have crossed over into retirement.5 Comparing the lifecycle trajectories across birth cohorts at similar ages tell the more interesting story about evolving retirement coverage, however. The height difference (at a given age) for any two overlapping cohort lines indicates the difference in participation (at that age) between the two cohorts.
Figure 1 thus shows two clearly different stories about trends in retirement plan participation over the 1989-2013 period. In the early part of the period (before the early 2000s), cohorts born more recently were achieving generally higher rates of plan participation at younger ages. That trend reversed around 2007, and the drop in participation shows younger cohorts are failing to achieve the levels reached by preceding cohorts at the same ages.
 |
Source: Author's tabulations of the Survey of Consumer Finances. See Devlin-Foltz, Henriques, and Sabelhaus (2016) for details.
Acknowledging that participation in retirement plans is down substantially when taking a lifecycle perspective, especially for younger cohorts, is an important starting point, but the more pressing question is who, within those birth cohorts, is experiencing those changes? The obvious dimension on which to cut the cohort data is income, as there are well-known differences in retirement plan offerings and participation across income groups. The SCF makes it possible to look within birth cohorts across income groups using the same lifecycle perspective, to study both levels and changes in participation over time. The largest decreases in retirement plan participation, relative to the lifecycle trajectories of
Bottom 50 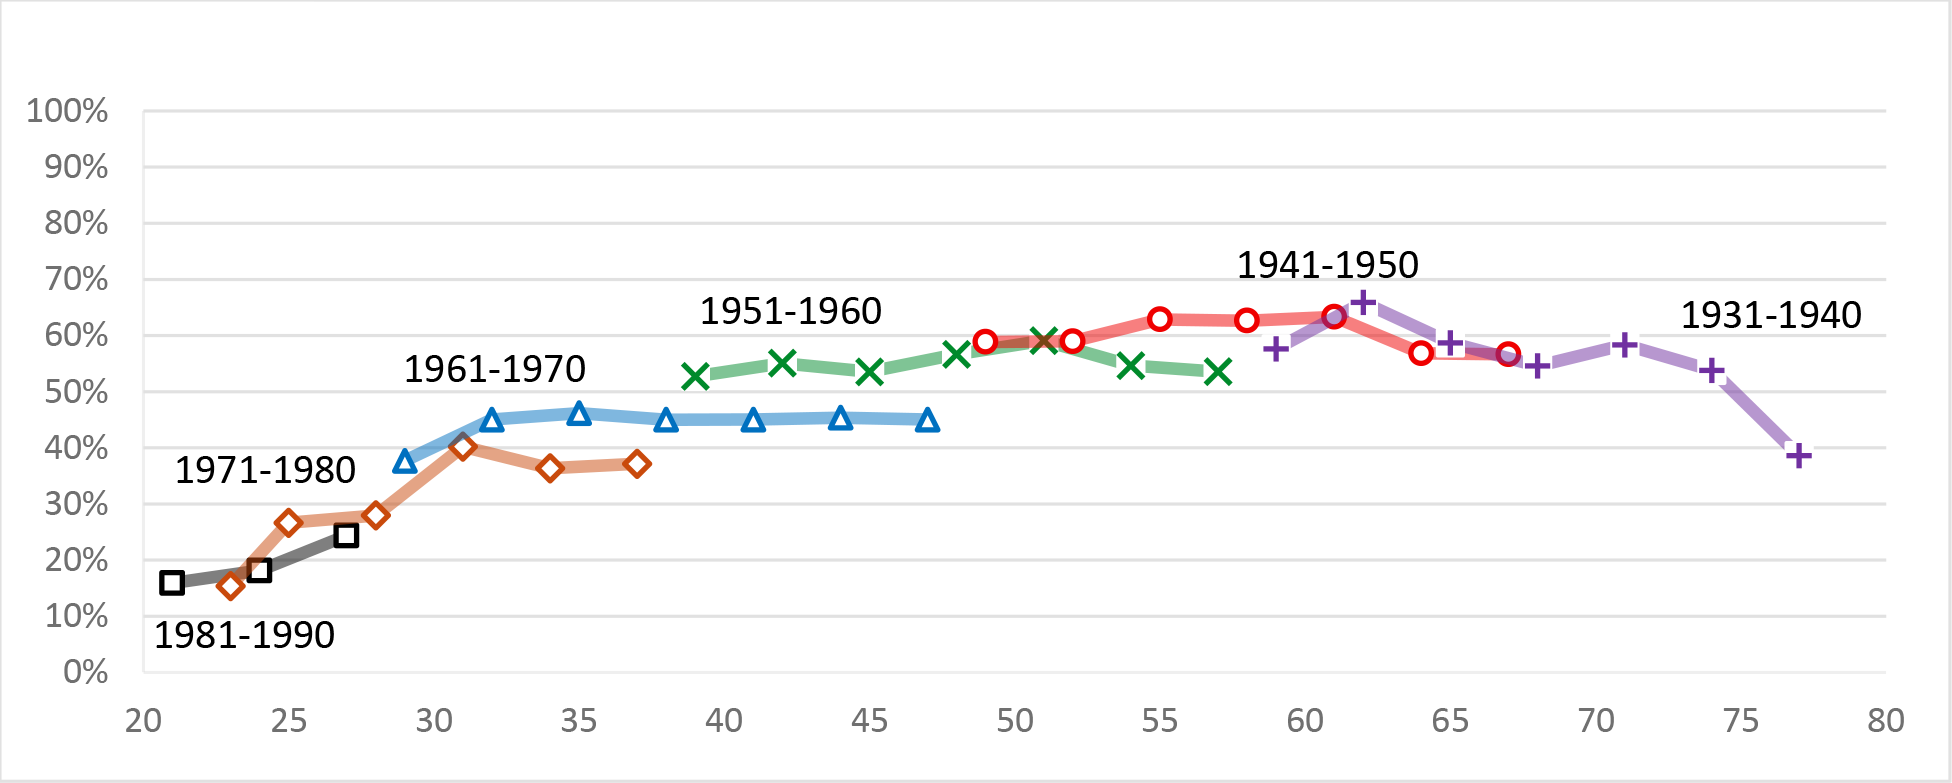 |
Next 45 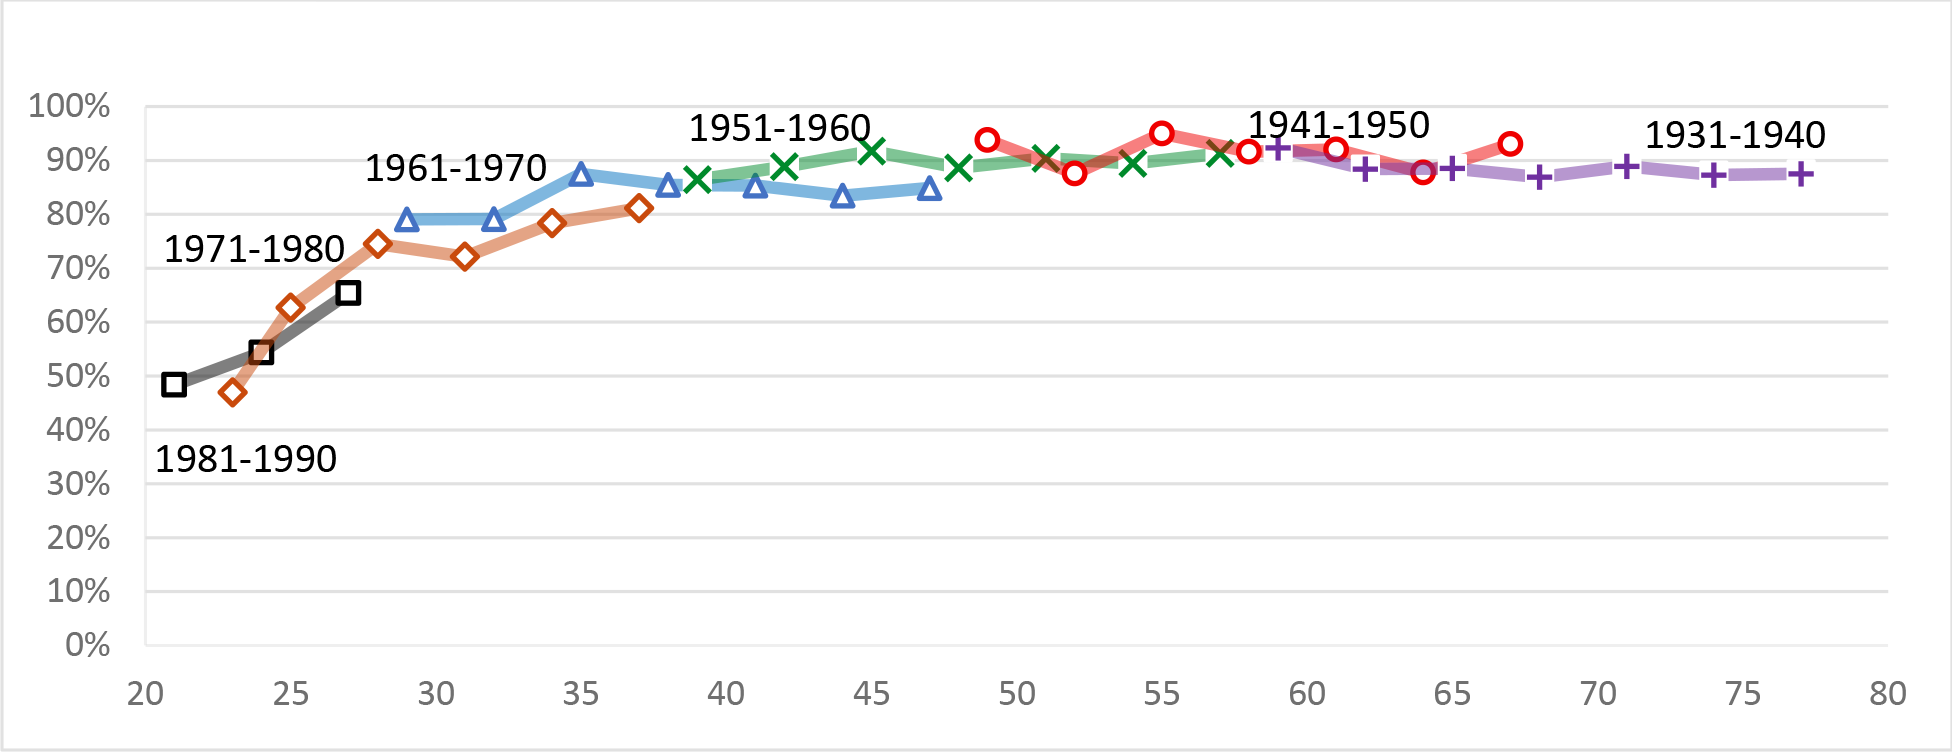 |
Top 5 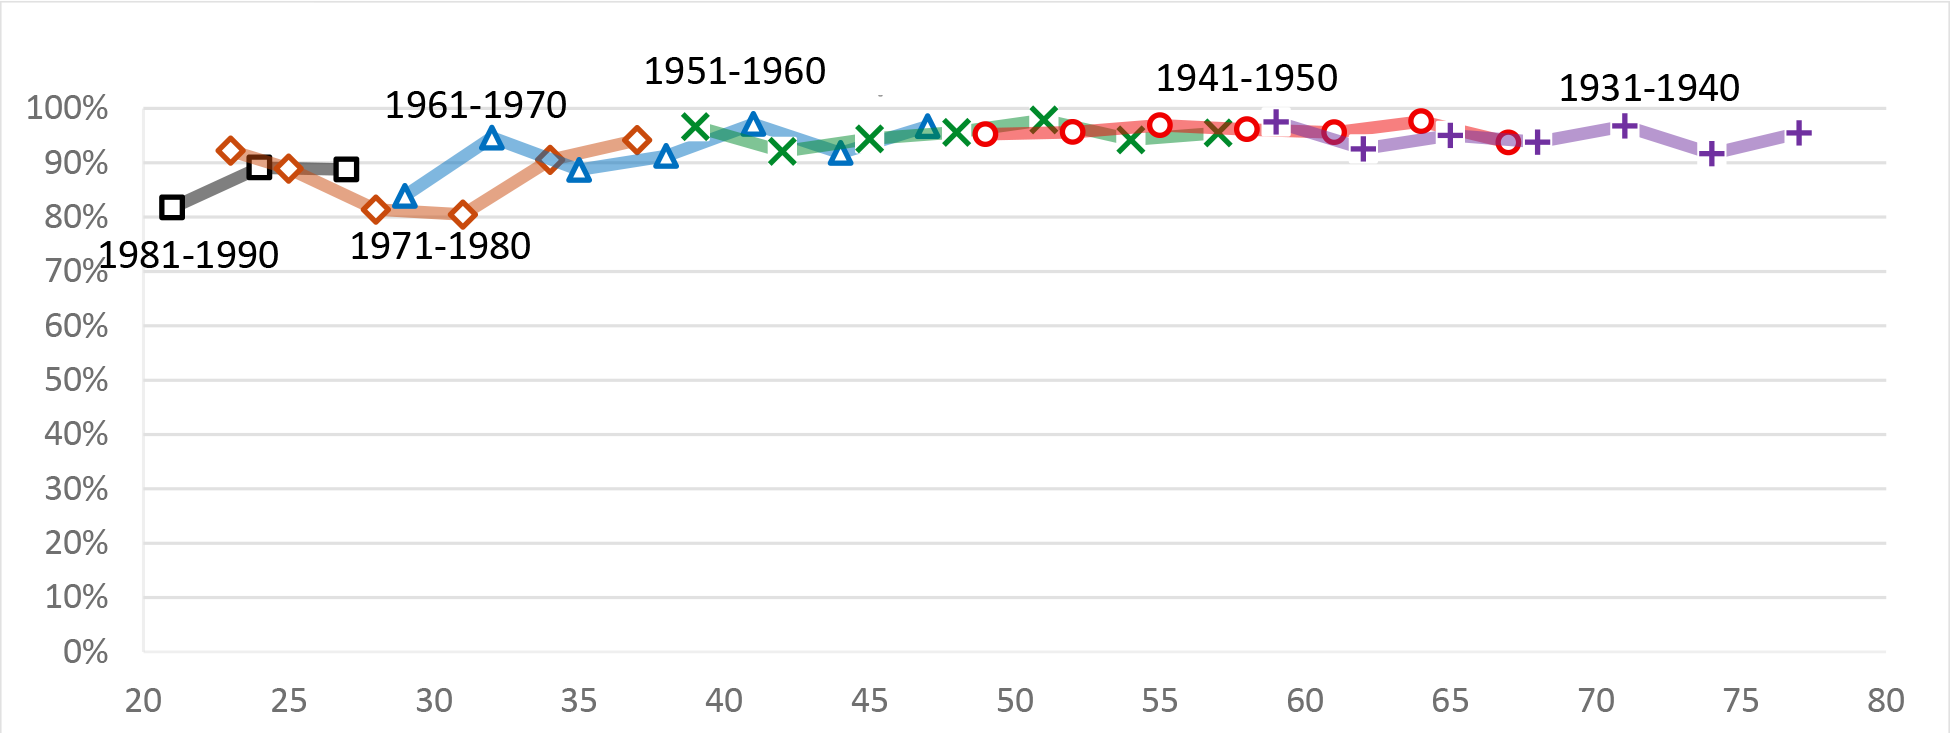 |
Source: Author's tabulations of the Survey of Consumer Finances. See Devlin-Foltz, Henriques, and Sabelhaus (2016) for details.
previous cohorts in the same income groups, have occurred for pre-retirement families in the bottom half of the distribution by usual income (Figure 2), driven primarily by reduced plan offerings, and to some extent for the younger cohorts in the next 45 percent (median through 95th percentiles). The only groups who have not seen large changes in retirement plan coverage are older families across all income groups, and all age groups at the top of the usual income distribution.
The Role of Social Security Wealth
Any analysis of retirement wealth claims across income groups is incomplete without Social Security. The Social Security program is both very large relative to other forms of retirement wealth and quite different from a distributional perspective. The size of the program is often described using measures like benefit flows relative to total GDP, but a more striking perspective involves calculating the present value of benefits, which puts Social Security on a comparable basis with how employer-sponsored retirement wealth is measured. The Social Security actuaries estimate that the present value of OASDI benefits for people aged 15 and older in 2013 was about $52 trillion, roughly double in real terms relative to the comparable estimates from two decades prior, due to population aging, increases in lifetime earnings, and increased life expectancy.6 The present value of future Social Security benefits is also now roughly double the size of all DB and DC claims combined. From a distributional perspective, the fact that income is capped for the purpose of collecting taxes and paying benefits, and the benefit formula itself is progressive, means that claims to Social Security benefits are much more evenly distributed than other forms of retirement wealth.
Although the SCF does not collect all of the inputs needed to project Social Security benefits for respondent families and, thus, estimates for the entire population would involve strong assumptions about earnings growth and retirement ages, it is possible to get a sense of the distributional impact of Social Security (relative to DB and DC wealth) by focusing on one cohort at one point in time, just before retirement. In what follows, the focus is on the 1951 to 1960 birth cohort, as observed in the year 2013. This group ranged from 53 to 62 years old when the 2013 SCF was conducted. This cohort was close enough to retirement that their current earnings are a reasonable proxy for their lifetime earnings. Benefits are then computed under the (conservative) assumption that everyone claims at age 62.7
The importance of Social Security wealth relative to other forms of retirement wealth is illustrated clearly by this simple calculation (Table 1). The statistics in this table are all medians, in order to focus on representative individuals within each income group, so that the very high incomes at the top of the income distribution do not pull down retirement wealth to income ratios for that group, and the relatively high DB and DC assets for some families in the bottom half of the income distribution do not distort (upwards) the retirement wealth of the many families in the bottom half with little or no retirement wealth.
| Median Usual Income | Median Private (DB + DC) Retirement Wealth | Median Social Security Wealth | Median Total Retirement Wealth | Ratio of Private Retirement Wealth to Usual Income | Ratio of All Retirement Wealth to Usual Income | |
|---|---|---|---|---|---|---|
| Bottom 50 | $38,552 | $6,500 | $171,966 | $204,465 | 17% | 530% |
| Next 45 | $103,669 | $288,371 | $343,373 | $636,085 | 278% | 614% |
| Top 5 | $487,524 | $716,000 | $478,707 | $1,123,748 | 147% | 231% |
Source: Survey of Consumer Finances, 1989-2013. Authors calculations, see Devlin-Foltz, Henriques, and Sabelhaus (2016) for details.
Note: Numbers are for 2013 only, for those households where the respondent was born between 1951 and 1960 and is currently employed, reporting wages and salaries or self-employment income during the survey year.
Median retirement wealth in the bottom 50 is substantially lower than in the top 50. However, when one accounts for Social Security, the differences in total retirement wealth across the distribution are much less severe. To think about retirement readiness, we examine the ratio of retirement assets to usual income (final two columns). The main takeaway message on retirement readiness is that Social Security goes a long way towards explaining why differences in DB and DC retirement wealth do not translate into dramatic shocks to living standards across the income distribution as a given cohort crosses over into retirement. Median total retirement wealth (including Social Security) is much lower for the bottom half of the usual income distribution, but relative to median income, it is roughly the same as for the next 45 percent income group, and more than double the same ratio for the top 5 percent. Of course the median family in the top 5 percent owns much more in absolute terms for both DB and DC and Social Security wealth, but when measured relative to usual income right before retirement, their retirement claims are actually smaller.
The distributional differences in employment-related retirement plan participation and wealth claims (Figure 2 and Table 1) are potentially informative for policy design. The bottom half of the income distribution is indeed experiencing the largest declines in employment-related coverage over the most recent decade, but employment-related coverage and typical DB and DC wealth for families with lower incomes were never really substantial, even prior to the recent declines. Social Security has long dominated the retirement incomes of most US retirees. In that sense, continued focus on a stable and well-funded Social Security system may be the most important policy response to recent distributional trends in the employment-related pension system.
References
Aguiar, Mark, and Erik Hurst. 2005. "Consumption versus Expenditure," Journal of Political Economy, 113(5): 919-948.
Bricker, Jesse, Lisa J. Dettling, Alice Henriques, Joanne W. Hsu, Kevin B. Moore, John Sabelhaus, Jeffrey Thompson, and Richard A .Windle. 2014. "Changes in U.S. Family Finances from 2010 to 2013: Evidence from the Survey of Consumer Finances," Federal Reserve Bulletin, 100(4): 1-40. (September)
Devlin-Foltz, Sebastian, Alice Henriques, and John Sabelhaus. 2016. "Is the U.S. Retirement System Contributing to Rising Wealth Inequality?" Russell Sage Journal of the Social Sciences (Forthcoming).
Government Accountability Office (GAO). 2015. Most Households Approaching Retirement Have Low Savings. GAO-15-419 (May).
Hurd, Michael D., and Susann Rohwedder, 2013. "Heterogeneity in spending change at retirement," Journal of the Economics of Ageing, 1(2): 60-71.
Love, David A., Michael G. Palumbo, and Paul A. Smith. 2009. "The Trajectory of Wealth in Retirement," Journal of Public Economics, 93: 191-208.
Munnell, Alicia H., Wenliang Hou, and Anthony Webb. 2014. "NRRI Index Shows Half Still Falling Short" Boston MA: Boston College Center for Retirement Research Issue in Brief 14-20. (December)
Poterba, James M., Steven Venti, and David Wise. 2013. "Health, Education, and the Post-Retirement Evolution of Household Assets," National Bureau of Economic Research Working Paper 18695. (January)
Wolff, Edward N. 2015. "U.S. Pensions in the 2000s: The Lost Decade?" Review of Income and Wealth, 61(4):599-629. (December)
1. This note was written while Sebastian Devlin-Foltz was a research assistant at the Federal Reserve Board. Return to text
2. See, in particular, the retirement wealth tabulations and analysis in General Accountability Office (2015) and Wolff (2015). Munnell, Hou, and Webb (2015) present the latest results from the Boston College Center for Retirement Research (BCCR) "Retirement Risk Index," which is based on the same household survey data used here, but they focus on projected retirement income flows rather than retirement wealth claims per se. The analysis of retirement wealth claims we present here is based on Devlin-Foltz, Henriques, and Sabelhaus (2016). Return to text
3. As discussed in more detail below, the present value of Social Security benefits for all workers currently in the system is similar in magnitude to all other components of household sector net worth combined. Return to text
4. For a description of the most recent SCF, including the definition of "usual" income, see Bricker et.al. (2015). Return to text
5. The tendency of retirees to not draw down tax-preferred accounts has been analyzed extensively by Love et al. (2009) and Poterba et al. (2013). Whether or not these trajectories are consistent with optimizing behavior depends importantly on one's underlying model, and even the concept of "consumption" versus "spending" one has in mind. See, for example, Aguiar and Hurst (2005) and Hurd and Rohwedder (2013). Return to text
6. Based on unpublished numbers from the Office of the Chief Actuary of the Social Security Administration. The estimate for recent years can be found in the annual Trustees Report, at www.ssa.gov/oact/tr/2015/VI_F_infinite.html#. Return to text
7. Benefits are estimated separately for the head and spouse, but the sorting by age is based on the head, and sorting by income based on the combined incomes of head and spouse. Assuming Social Security claiming at age 62 is conservative because continued work could raise the base (Average Indexed Monthly Earnings) used to compute benefits for some workers. In general, however, the system is roughly actuarially fair. Details about the DB and Social Security wealth estimates are in the appendix of Devlin-Foltz, Henriques, and Sabelhaus (2016). Return to text
Please cite this note as:
Devlin-Foltz, Sebastian, Alice M. Henriques, and John E. Sabelhaus (2016). "The Role of Social Security in Overall Retirement Resources: A Distributional Perspective," FEDS Notes. Washington: Board of Governors of the Federal Reserve System, July 29, 2016, http://dx.doi.org/10.17016/2380-7172.1812.
Disclaimer: FEDS Notes are articles in which Board economists offer their own views and present analysis on a range of topics in economics and finance. These articles are shorter and less technically oriented than FEDS Working Papers.
