
FEDS Notes
 Print
PrintJanuary 13, 2017
Confidence Interval Projections of the Federal Reserve Balance Sheet and Income
Erin E. Syron Ferris, Soo Jeong Kim, and Bernd Schlusche1
NOTE: This FEDS Note was revised on February 17, 2017 to correct a sentence on the modal path of the unrealized position of the SOMA portfolio. This Note was also revised on April 5, 2017 to include a list of references.
1. Background
In response to the financial crisis of 2008 and the subsequent recession, the Federal Reserve employed large-scale asset purchases (LSAPs) and a maturity extension program (MEP) with the purpose of reducing longer-term interest rates, and thereby promoting more accommodative financial conditions at a time when the conventional monetary policy tool, the federal funds rate, was at its effective lower bound. The accommodation provided by the LSAPs in turn provided critical support to the economy, contributing to lowering the unemployment rate compared to what it would have been in the absence of these policies.2
Most directly, the LSAPs altered the size and composition of the Federal Reserve's balance sheet, as well as the Federal Reserve's net income. The larger balance sheet and the ensuing greater duration mismatch between assets and liabilities have raised questions about the interest rate risk of the Federal Reserve's portfolio. The Federal Reserve has regularly reported to the public details of its current and projected securities holdings as well as their associated income under various interest rate and macroeconomic scenarios.3 This note furthers the discussion by presenting projections of the Federal Reserve's balance sheet and income statement for a range of future potential interest rate paths consistent with macroeconomic simulations from the Federal Reserve's FRB/US model.4,5 The results presented in this note therefore help assess the interest rate risk stemming from the configuration of the Federal Reserve's portfolio induced by the LSAPs and the MEP.
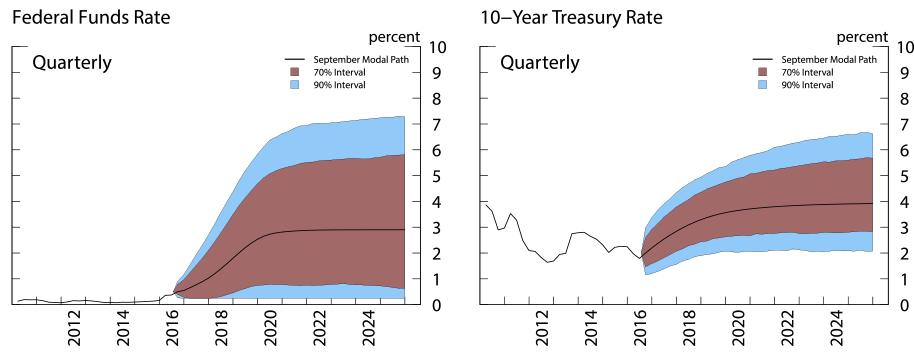
As a first input, we use the deterministic or "modal" path that is consistent with the FOMC participants' Summary of Economic Projections (SEP) submitted in conjunction with the September 2016 FOMC meeting. We then apply the sets of paths for the federal funds rate, the 10-year Treasury yield, as well as those for other financial and macroeconomic variables as generated from stochastic simulations of the FRB/US model around the modal path to create confidence intervals for the evolution of SOMA holdings, reserve balances, and income.6 Figure 1 shows the federal funds rate and the 10-year Treasury yield from the stochastic simulations. The purpose of showing confidence intervals is to provide an indication about the degree of uncertainty around the projected dynamics of the Fed's balance sheet and income.
2. The Federal Reserve's Balance Sheet and Income: Components and Recent History
In this section, we present the key components and the recent evolution of the Federal Reserve's balance sheet and income statement.7
The Federal Reserve's balance sheet follows the typical equation by which assets must equal the sum of liabilities and capital. Assets of the Federal Reserve consist primarily of securities held in its System Open Market Account (SOMA) portfolio. Prior to the financial crisis, the SOMA portfolio stood at about $800 billion and comprised of Treasury securities only.8 By the end of the LSAP programs in 2014, the SOMA portfolio had reached more than $4 trillion, including $1.7 trillion in agency mortgage-backed securities (MBS).9 As shown on Table 1, the Federal Reserve has maintained the portfolio at this elevated level, continuing to reinvest principal repayments on its securities holdings.
(billions of $) |
|---|
| Assets | Liabilities + Capital | ||
|---|---|---|---|
| SOMA | 4,242 | Deposits of DIs | 2,209 |
| U.S. Treasury Securities | 2,462 | FR notes | 1,381 |
| Federal agency debt and MBS | 1,780 | Reverse repurchase agreements | 499 |
| Other assets | 245 | Other liabilities | 359 |
| Capital | 39 | ||
| Total | 4,487 | Total | 4,487 |
Source: Calculations based on: Federal Reserve Board, H.4.1 statistical release, Factors Affecting Reserve Balances of Depository Institutions and Condition Statement of Federal Reserve Banks, (December 30, 2015), https://www.federalreserve.gov/monetarypolicy/bst_fedsbalancesheet.htm
Historically, the Federal Reserve's liabilities consisted primarily of currency in circulation (FR notes in Table 1). As a consequence of the LSAP programs, however, reserve balances--the deposits of depository institutions (DIs) held at Federal Reserve banks--became the largest liability, standing at approximately $2.2 trillion at the end of 2015.10 Total capital, the final category on the balance sheet, stood at $39 billion.
The Federal Reserve's net income, a portion of which is remitted to the U.S. Treasury, is shown in its income statement; a simplified version is presented in Table 2. As can be seen from the table, net income reflects many components, including interest income earned on the securities held in the SOMA portfolio and interest expense paid on reserve balances.11,12 Since interest income has increased more rapidly than interest expense in recent years, net earnings remittances have also grown.
(millions of $) |
|---|
| 2015 | |
|---|---|
| Interest Income | |
| Loans | $ - |
| System Open Market Account (SOMA): | |
| Treasury securities, net | 63,317 |
| GSE debt and MBS, net | 50,261 |
| Other interest income | 36 |
| Total interest income | 113,614 |
| Interest Expense | |
| System Open Market Account (SOMA): | |
| Securities sold under agreement to repurchase | 248 |
| Other | 2 |
| Deposits: | |
| Depository institutions | 6,846 |
| Term Deposit Facility | 89 |
| Total interest expense | 7,185 |
| Net interest income | 106,429 |
| Total non-interest (loss) | (146) |
| Total Operating Expenses | 6,379 |
| Net income before providing for remittances to the Treasury | 99,904 |
| Earnings remittances to the Treasury: | |
| Interest on Federal Reserve Notes | 91,143 |
| Required by the Federal Reserve Act, as amended by the FAST Act | 25,956 |
| Total earnings remittances to the Treasury | 117,099 |
| Net (loss) income after providing for remittances to the Treasury | (17,195) |
| Total other comprehensive (loss) income | 366 |
| Comprehensive (loss) income | (16,829) |
Source: Federal Reserve System Audited Annual Financial Statements
The Federal Reserve also reports the end-of-quarter unrealized capital gain (loss) position of the SOMA portfolio, which is the difference between the market value of the securities in the portfolio and their book value.13,14 As interest rates change, so does the market value of the securities held in the SOMA portfolio. As of June 30, 2016, the SOMA portfolio displayed an unrealized gain of $282 billion.15
3. Projection Assumptions
The size and composition of the Federal Reserve's balance sheet as well as the associated net income can shift with interest rate and macroeconomic outcomes. Consequently, projections for the Federal Reserve's balance sheet and income require various assumptions about the evolution of financial and macroeconomic variables, as well as the monetary policy decisions to be taken by the Federal Open Market Committee (FOMC).
To start with, since the longer-run size of the balance sheet is largely determined by the amount of currency in circulation, our assumption that currency expands at a rate equal to that of projected nominal GDP growth implies that different simulated paths for nominal GDP growth result in different balance sheet projections. In addition, because agency MBS have an embedded prepayment option, the stock of MBS held in the SOMA portfolio depends importantly on interest rates and economic conditions. We use a staff MBS prepayment model to project prepayments of principal from MBS and hence assess how macroeconomic variables affect the path of agency MBS holdings. Furthermore, changes in agency MBS holdings can, in turn, result in different paths for SOMA Treasury holdings once the size of the balance sheet is normalized, with normalization defined as the point in time when reserve balances decline to a level of $100 billion.16
Finally, the assumptions about the stance of monetary policy are consistent with the FOMC's September 2014 Policy Normalization Principles and Plans, with no sales of securities and reinvestments of rolling-off securities continuing until normalization of the level of the federal funds rate is well under way.17
4. Balance Sheet Outcomes and Interest Rate Risk
4.1 Balance Sheet Outcomes
As is shown in Figure 2, the size of the balance sheet varies with macroeconomic outcomes. The range of possible outcomes for the 70- and 90-percent confidence intervals are represented by the red and blue areas, respectively. Along the contour of the simulations, the range implied by potential SOMA holdings and reserve balances is generally fairly narrow. However, SOMA holdings display somewhat wider dispersion after the normalization of the size of the balance sheet, merely reflecting variability in macroeconomic outcomes and, in turn, projected currency growth.
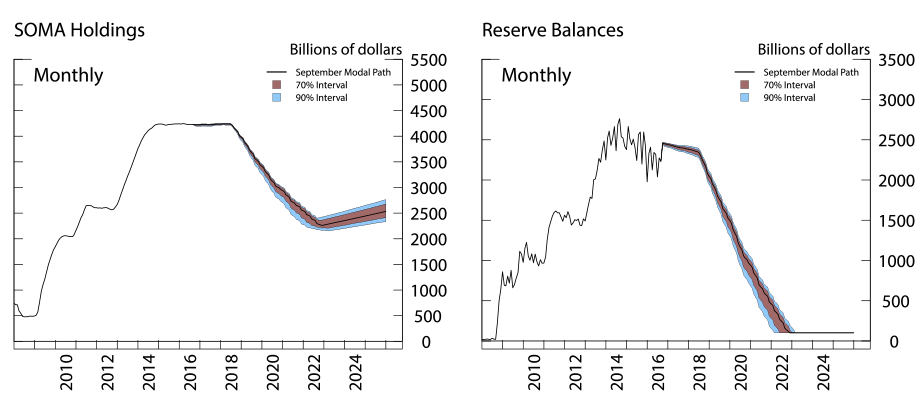
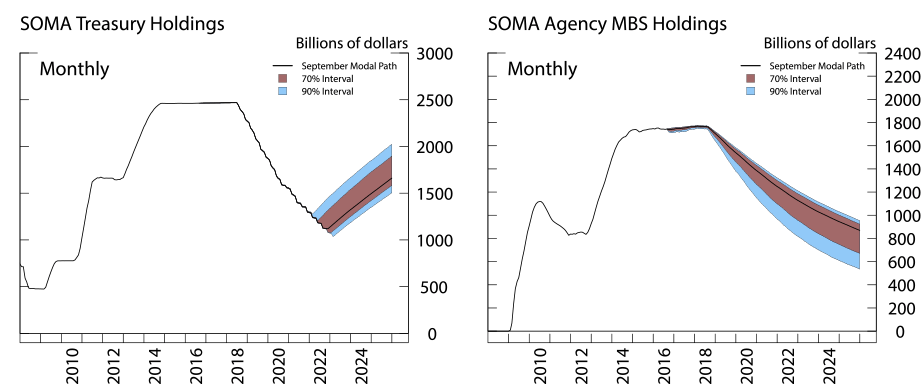
At the end of the projection period in 2025, the size of the balance sheet is expected to be $2.5 trillion along the modal path, with possible outcomes ranging between $2.3 and $2.8 trillion, reflecting the differences in nominal GDP growth and the resulting assumed changes in currency outstanding. In addition, as depicted in Figure 3, Treasury securities and MBS holdings are projected to range between $1.5 and $2.0 trillion, and from $525 billion to $950 billion, respectively.
4.2 Unrealized Gain/Loss Position
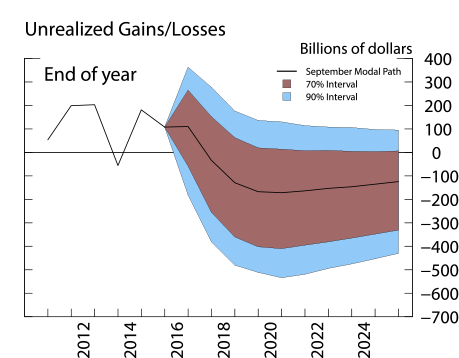
Figure 4 shows the unrealized gain or loss position of the SOMA portfolio, which is influenced importantly by the level of interest rates. The modal path, depicted by the solid black line, indicates that the portfolio is projected to shift to an unrealized loss in late 2017, before posting a peak projected shortfall of about $170 billion in late 2020. However, the tail risk, as captured by the lower edge of the 90-percent confidence interval, can be large, as the unrealized loss in the corresponding scenario peaks at about $530 billion in a simulation in which interest rates would move much higher than in the baseline. Although the modal path implies that the unrealized loss position narrows subsequently through 2025, as securities acquired under the LSAPs mature or pay down and new securities are added to the portfolio at par, under some scenarios the unrealized loss position could remain larger than $400 billion as of 2025. It is important to stress that the Federal Reserve does not record gains and losses on its portfolio unless a security is sold, and, as indicated above, the FOMC does not anticipate selling MBS as part of the normalization process.18 When securities mature, the value of any unrealized gain or loss would fall to zero.
4.3 Federal Reserve's Earnings Remittances
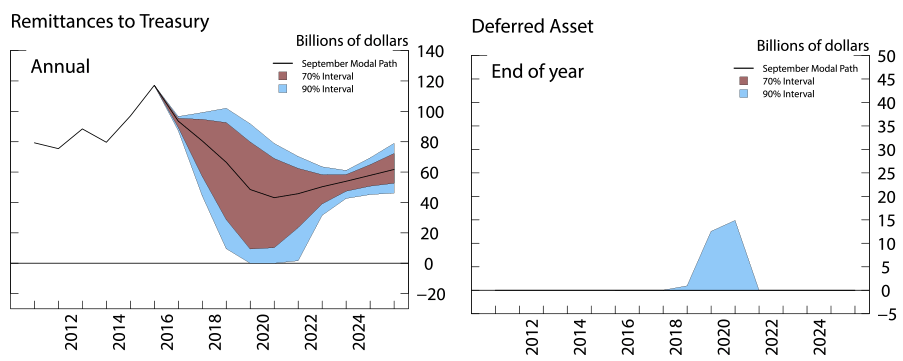
Under the modal outlook, earnings remittances to the U.S. Treasury are projected to decline over the next few years, falling to their annual low of roughly $40 billion, before rebounding toward $62 billion by the end of the projection period. Most of the risk to the Federal Reserve's earnings remittances stems from the possibility that interest expense could rise faster than interest income through the medium term (Figure 5). In fact, earnings remittances are most sensitive to shifts in short-term interest rates, since changes in interest income tend to be more gradual than those in interest expense. In particular, in a context in which interest rates rise over the medium term while reserve balances are still elevated, higher interest expense on reserve balances reduces the Federal Reserve's net income. As shown in Figure 6, we find that inside the 70-percent confidence interval earnings remittances never fall to zero. Thus, transfers to the U.S. Treasury are not suspended, and no deferred asset is recorded. However, under some scenarios, the Federal Reserve incurs for a few years a small deferred asset peaking at only about $15 billion during 2020 (Figure 6).19 The small size of the deferred asset in these scenarios could therefore alleviate the concerns about potential interruptions to the Federal Reserve's earnings remittances to the U.S. Treasury.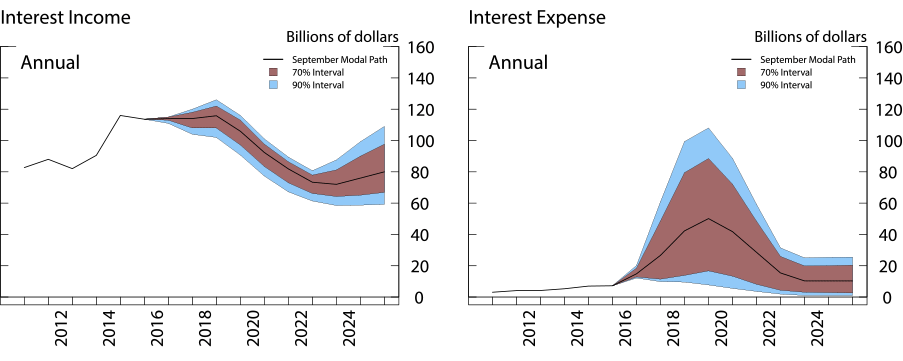
However, this assessment of the possible outcomes for the Federal Reserve's net income and earnings remittances should not be interpreted as a guide to the overall implications for the taxpayer of the larger size of the Federal Reserve's balance sheet. If a larger balance sheet and the resulting accommodation in financial conditions provide even a modest boost to economic activity, the subsequent increases in tax revenues for the U.S. Treasury would dwarf any potential estimated reduction in earnings remittances from the Federal Reserve even under scenarios in which a small deferred asset is recorded. In addition, by depressing longer-term interest rates, the larger balance sheet is also likely to hold down the Treasury's debt service costs.
Conclusion
In this note, we presented the implications for the Federal Reserve's balance sheet and income arising from a range of future potential macroeconomic outcomes. We used the paths of financial and macroeconomic variables generated by stochastic simulations of the FRB/US model to project confidence intervals for the evolution of SOMA holdings, reserve balances, and income. One notable feature of our projections is that, under some scenarios in which interest rates rise significantly more than along a modal path, a deferred asset may be recorded for a few years.20 Nonetheless, the implications of the Federal Reserve's policy actions for its balance sheet and income statement do not represent a factor influencing policy decisions. In fact, the fair value of the Federal Reserve's portfolio as well as its earnings, gains, or losses do not affect the ability to continue its operations or to carry out its responsibilities as the nation's central bank, which is to conduct monetary policy to achieve its statutory goals of maximum employment and stable prices. Finally, all considered, the aggregate gains for U.S. households, businesses, and the federal government resulting from the Federal Reserve's efforts to foster progress towards maximum employment and stable prices far outweigh any estimate of possible financial losses for the Federal Reserve even under higher interest rate scenarios.
References
[1] Engen, Eric M., Laubach, Thomas, and Reifschneider, David: "The Macroeconomic Effects of the Federal Reserve's Unconventional Monetary Policies", FEDS Working Paper No. 2015-005, 2015, https://ssrn.com/abstract=2561522
[2] Christensen, Jens H.E., Lopez, Jose A., and Rudebusch, Glenn D.: "A probability-based stress test of Federal Reserve assets and income", Journal of Monetary Economics, pp 26-43, April 2015, Vol. 73, https://www.researchgate.net/journal/0304-3932_Journal_of_Monetary_Economics
[3] Brayton, Flint, Laubach, Thomas, and Reifschneider, David: "Optimal-Control Monetary Policy in the FRB/US Model", FEDS Notes. Washington: Board of Governors of the Federal Reserve System, November 21, 2014
[4] Carpenter, Seth, Jane Ihrig, Elizabeth Klee, Daniel Quinn, and Alexander Boote (2015). "The Federal Reserve's Balance Sheet and Earnings: A Primer and Projections," International Journal of Central Banking, vol. 11, no. 2, pp. 237-283.
1. We thank Michele Cavallo, Casey Clark, James Clouse, Gregory Evans, Jane Ihrig, and Elizabeth Klee, and Lawrence Mize for feedback. We also thank James Trevino and Jamie Grasing for excellent assistance. Return to text
2. Engen, Laubach, and Reifschneider (2015) estimate that the Federal Reserve's asset purchases helped make overall financial conditions more accommodative, hence providing significant stimulus for the broader economy. Return to text
3. The Federal Reserve reports on a weekly basis the level and the changes in the size and the composition of its balance sheet in the H.4.1 statistical release available at http://www.federalreserve.gov/releases/h41/ (see Tables 2 and 5). Each quarter, the Federal Reserve also presents the market value of its portfolio in the "Federal Reserve Banks Combined Quarterly Financial Reports", available at http://www.federalreserve.gov/monetarypolicy/bst_fedfinancials.htm#quarterly. Finally, balance sheet and income projections under alternative interest rate scenarios are presented once a year in the Domestic Open Market Operations Annual Report published by the Federal Reserve Bank of New York, available at http://www.newyorkfed.org/markets/annual_reports.html  . Return to text
4. The FRB/US model is a large-scale estimated general equilibrium model of the U.S. economy that has been in use at the Federal Reserve Board since 1996. Further information is available at http://www.federalreserve.gov/econresdata/frbus/us-models-about.htm. Return to text
5. Academic research also addresses this issue; Christensen et al. (2015) use a probabilistic approach to study the interest rate risk of the SOMA portfolio. Return to text
6. The stochastic simulations are obtained by conducting 5000 runs of the FRB/US model using the estimated historical residuals. More specifically, this involves sampling with replacement from the FRB/US residuals from 1969 to 2013 to proxy for a set of possible macroeconomic shocks to the economy, and then applying those residuals to the baseline paths to generate ranges of possible outcomes. For details regarding the construction of the illustrative baseline projection of the FRB/US model, see Brayton et al. (2014). Return to text
7. Carpenter et al. (2015) provide a comprehensive overview of the components of the Federal Reserve's balance sheet and income. Return to text
8. This note primarily considers the domestic SOMA portfolio. Return to text
9. A summary of the LSAPs is available at http://www.federalreserve.gov/faqs/what-were-the-federal-reserves-large-scale-asset-purchases.htm. Return to text
10. Financial institutions were credited cash in the form of reserves in exchange for Treasury securities and agency MBS. Return to text
11. Federal Reserve Banks transfer residual net earnings to the U.S. Treasury after providing for the costs of operations, payment of dividends, and the amount necessary to maintain a $10 billion surplus. Furthermore, when earnings are insufficient to cover the costs of operations, payment of dividends, and the amount necessary to maintain a $10 billion surplus, earnings transfers to the U.S. Treasury are suspended and a deferred asset is recorded. Return to text
12. Reserve Banks began paying interest on required and excess reserve balances in October 2008. Further details are available at http://www.federalreserve.gov/monetarypolicy/reqresbalances.htm. Return to text
13. The book value of the SOMA portfolio is the par value of the portfolio plus any unamortized net premiums and discounts associated with the securities. Return to text
14. Because the SOMA portfolio is recorded on an amortized cost basis, unrealized gains and losses are not reflected in the balance sheet or in net income. As a result, unrealized gains and losses do not affect the periodic remittances to the U.S. Treasury. Return to text
15. The unrealized gain position is reported in the "Federal Reserve Banks Combined Quarterly Financial Reports", available at http://www.federalreserve.gov/monetarypolicy/bst_fedfinancials.htm#quarterly and in the audited "Annual Financial Statements of the Federal Reserve System," available at http://www.federalreserve.gov/monetarypolicy/bst_fedfinancials.htm#audited. Return to text
16. The size of the balance sheet is assumed to be normalized when the securities portfolio reverts to the level consistent with its longer-run trend; this trend is determined largely by currency in circulation and a projected long-run level of reserve balances. Return to text
17. The FOMC's September 2014 Policy Normalization Principles and Plans are available at http://www.federalreserve.gov/newsevents/press/monetary/20140917c.htm. As outlined in the September 2016 FOMC statement, the Committee's existing policy is to reinvest principal payments from its holdings of agency debt and agency mortgage-backed securities in agency mortgage-backed securities and to roll over maturing Treasury securities at auction until normalization of the level of the federal funds rate is well under way. See http://www.federalreserve.gov/newsevents/press/monetary/20160921a.htm. For all scenarios in this note, we assume that the timing of a change in the Committee's policy on reinvesting payments of principal on Treasuries and agency MBS is the median number of months forward as reported in the Federal Reserve Bank of New York's September 2016 Survey of Primary Dealers. More information is available at https://www.newyorkfed.org/markets/primarydealer_survey_questions.html . Return to text
18. Instead, the FOMC intends to reduce the Federal Reserve's securities holdings in a gradual and predictable manner, primarily by ceasing reinvestments of principal on securities held in the SOMA. Return to text
19. As above, these scenarios are those for which interest rate paths are in the highest 5 percent of their ranges. Return to text
20. It is also possible that the sample period from which the residuals were drawn may lead to an overestimation of the risks implied by our projections, as it includes the Great Inflation in the 1970s and the subsequent Federal Reserve's response in the early 1980s. For robustness, we also considered drawing residuals from 1990 to the present, and, as expected, the error bands are smaller for all variables. This feature is particularly noticeable for the deferred asset, which peaks at about $5 billion when we use the shorter sample, compared to the $15 billion peak implied by the full sample, as indicated above. Return to text
Please cite as:
Ferris, Erin E. Syron, Soo Jeong Kim, and Bernd Schlusche (2017). "Confidence Interval Projections of the Federal Reserve Balance Sheet and Income," FEDS Notes. Washington: Board of Governors of the Federal Reserve System, January 13, https://doi.org/10.17016/2380-7172.1875.
Disclaimer: FEDS Notes are articles in which Board economists offer their own views and present analysis on a range of topics in economics and finance. These articles are shorter and less technically oriented than FEDS Working Papers.