February 22, 2017
The Economic Outlook and Monetary Policy
At the Forecasters Club of New York Luncheon, New York, New York
Thank you for this invitation to speak here today. I will begin by taking stock of the progress of the U.S. economy. I will then discuss longer-term challenges for the economy and wrap up with a discussion of monetary policy. As usual, my comments reflect my own views and not necessarily those of my colleagues on the Federal Open Market Committee (FOMC).
The Current State of the Economy
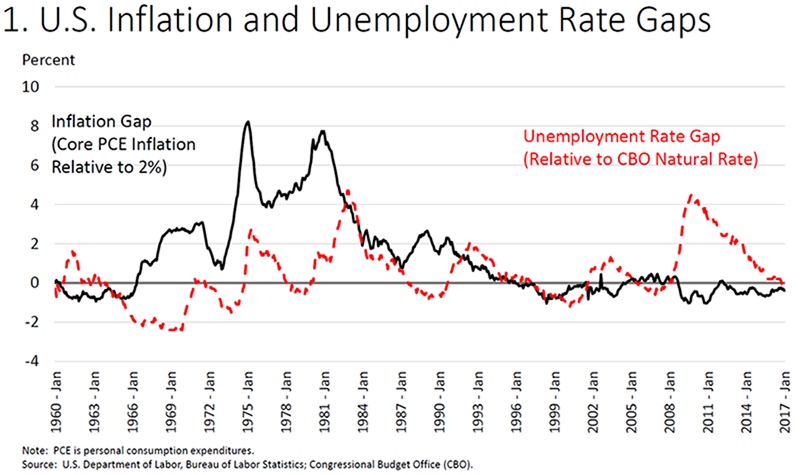
The Congress has tasked the Federal Reserve with achieving stable prices and maximum employment--the dual mandate. The FOMC has set a longer-term price stability objective of 2 percent annual inflation, as measured by the PCE (personal consumption expenditures) price index.1 This is a symmetric objective, meaning that the Committee would be concerned if inflation were running persistently above or below 2 percent. Until early last year, inflation was running substantially below our 2 percent objective, largely reflecting declines in energy prices during late 2014 and early 2015. However, because prices of energy and food commodities are often volatile, a core measure that excludes these components provides a better indication of where overall inflation is headed. While core inflation has also run consistently below 2 percent in recent years, it has been gradually rising, with the most recent 12-month reading at 1.7 percent, three-tenths higher than a year ago (the black line in figure 1). Market-based measures of inflation compensation have moved well above their lows of mid-2016 but remain below pre-crisis levels, and survey measures have stayed relatively well anchored. Overall, inflation seems to be on track to reach the 2 percent objective over the next couple of years. Although inflation is currently below our objective, core inflation has generally been close to 2 percent over the past 20 years. This outcome reflects the success of monetary policy in anchoring inflation expectations.
Many indicators show that we have also made significant progress toward maximum employment. Since 2010, payroll employment has increased by almost 16 million jobs, and the unemployment rate has fallen from 10 percent to 4.8 percent--in line with most estimates of the longer-run normal level (or natural rate) of unemployment and with the median estimate by FOMC participants in the December 2016 Summary of Economic Projections (SEP). Accordingly, the red line in the figure indicates that the unemployment rate gap has essentially been closed.2
A variety of other measures also suggest that we are close to maximum employment. Surveys of household sentiment about the availability of jobs and of business sentiment regarding the difficulty of filling jobs have now reached levels seen in prior periods of full employment. Moreover, although the pace of wage increases is slower than during pre-crisis periods of full employment, wages have been increasing faster than both output per hour (productivity) and inflation, and labor's share of income has begun to move up after a long decline.
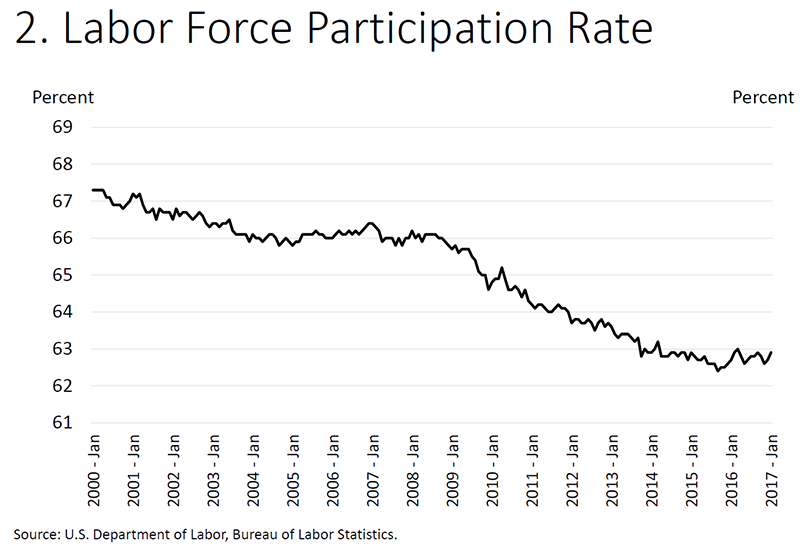
All in all, we appear to be close to our employment objective, and are nearing our inflation objective. While the pace of progress has at times been frustratingly slow, this outcome is a better one than that achieved by most other advanced economies. Even so, it is worth remembering that the current and future states of the economy are always uncertain, and today is no exception. Our discussions of the economy may sometimes ring in the ears of the public with more certainty than is appropriate. Take the concept of "maximum employment," which requires an estimate of both the natural rate of unemployment for those who are in the labor force and the sustainable level of labor force participation.3 The natural rate of unemployment is not directly observed, and the record suggests that it could be materially lower or higher than current estimates.4 There is also uncertainty about the underlying trend level of labor force participation. Participation has been declining since about 2000 because of the aging of our population and other secular trends, and analysts generally agree that participation will continue to decline over time for these reasons (figure 2). A canonical paper by a group of Fed economists estimates a trend rate of decline of about 0.3 percentage point per year.5 After declining sharply and dipping well below the prior trend in the years following the crisis, participation has been roughly flat since late 2013. Relative to this estimate of the declining trend, three years of flat participation implies a cyclical improvement of roughly 1 percentage point. But there is a range of views on the underlying trend and whether we can expect a bit more near-term cyclical improvement in participation. The Congressional Budget Office estimates that participation is currently 0.7 percentage point below its trend rate, which suggests remaining upside potential. By contrast, other recent work does not find a strong case for a meaningful further slack.6 The issue has important implications, since changes in participation can have material effects on the unemployment rate: Holding the level of employment constant, a 25 basis point change in the participation rate would lead roughly to a corresponding 40 basis point change in the unemployment rate.
Longer-Run Issues
Productivity and growth
Our economy is strong and operating near its capacity. But we face important challenges when it comes to the longer-term growth rate of the economy. Long-term economic growth depends mainly on nonmonetary factors such as population growth and workforce participation, the skills and aptitudes of our workforce, the tools at their disposal, and the pace of technological advance. Fiscal and regulatory policies can have important effects on these factors. The main long-run contribution monetary policy can make is to provide a stable macroeconomic and financial environment. The level of potential growth does have important implications for monetary policy.
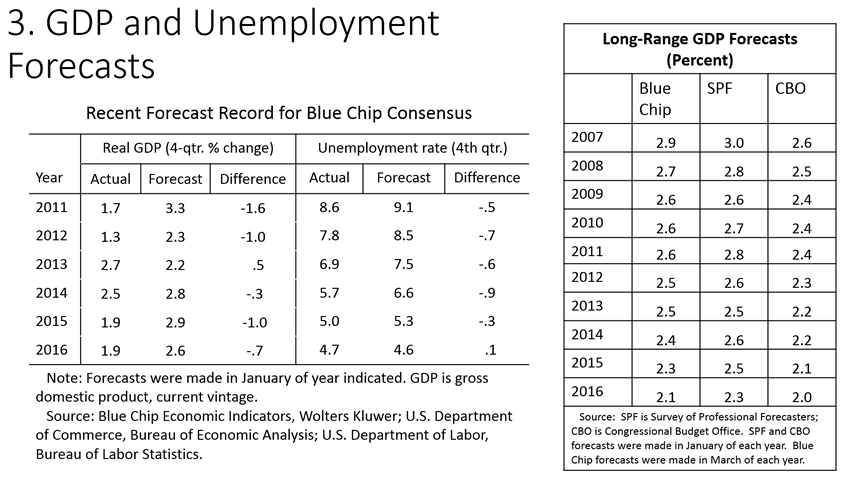
One of the surprising features of this expansion has been that 2 percent growth in real gross domestic product (GDP) has been enough to create solid job gains and unexpectedly large declines in unemployment. During much of the recovery, forecasters have been overly optimistic about growth but too pessimistic on job creation and the decline in the unemployment rate. In 2007, the average expectation for long-run GDP growth from the Blue Chip survey of 50 forecasters was 2.9 percent (figure 3). The consensus estimate has moved down steadily since then and is now at 2.1 percent. Other forecasters have also lowered their estimates over time, including those sampled by the Survey of Professional Forecasters and, yes, FOMC participants.7 Yet, as this figure shows, unemployment has declined faster than expected.
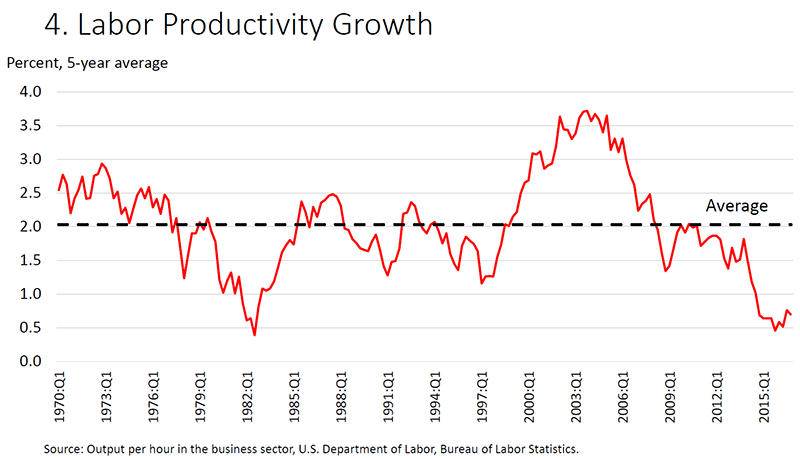
More than the expected number of workers have been required to produce less than the expected amount of output. The implication is that trend productivity and, ultimately, potential growth are lower than expected. The decline in estimates of potential growth has been driven largely by unexpectedly weak productivity growth. Labor productivity has increased only 1/2 percent per year, on average, since 2011--the worst performance over such a period since World War II (figure 4). As this figure shows, productivity growth moves around significantly over time and has averaged about 2 percent since 1970. One factor behind the decline since the financial crisis is the relatively slow increase in the capital stock per worker, as weak demand and uncertainty about the future have held back business investment. But the more important factor has been the marked decline in total factor productivity (TFP), which represents the part of productivity that is not explained by capital increases or increases in the skills of the labor force. TFP is thought to be mainly a function of technological innovation and efficiency gains. The decline in TFP growth has been widespread across advanced economies, suggesting that global trends are at play.8
There is no consensus about the future direction of productivity growth.9 Some argue that the important paradigm-changing innovations are behind us, while others think that this slowdown is only a passing phase. One thing on which all agree is that the future prospects for productivity growth and potential GDP are highly uncertain. I hope there is also broad agreement on the need for policies that maximize potential growth and spread prosperity as widely as possible. We need policies that encourage labor force participation and investment in education and training, in infrastructure, and in businesses. These policies are, of course, mostly outside the authority of the Federal Reserve.
Low interest rates
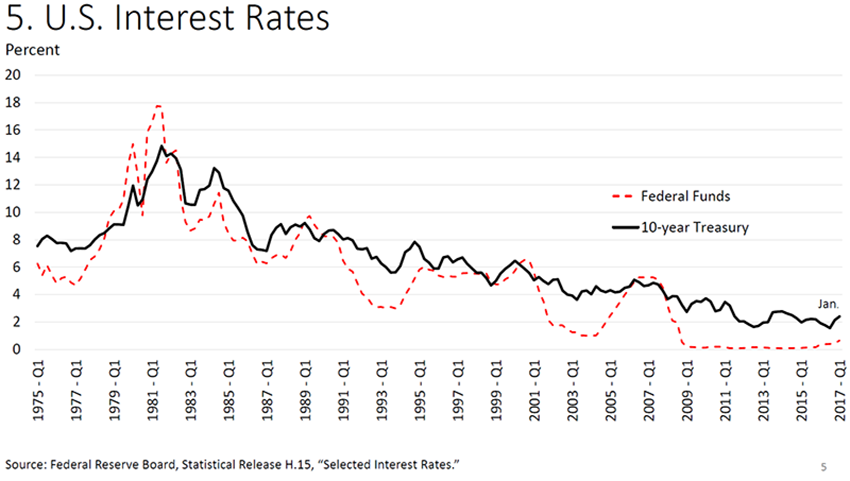
Another unanticipated feature of this recovery has been the low level of both short- and longer-term interest rates. At 2.4 percent, the yield on the 10-year Treasury is far below levels typically seen before the financial crisis (figure 5). Of course, Fed policy is a factor in holding down longer-term yields. But longer-term rates have been declining for more than 30 years, for several reasons. Much of the decline is due to significantly lower long-term expectations of inflation, as well as reduced term premiums, likely reflecting both lower inflation risk and the fact that, with anchored inflation expectations, nominal bonds have become an attractive hedge against market risk. Regulatory changes have raised demand for safe assets. Lower potential growth implies lower returns and therefore lower rates. Changes in savings and investment demand owing to demographics and other factors have put downward pressure on yields as well.
As a result, the real federal funds rate that is neither contractionary nor expansionary when the economy is operating near its potential--the so-called neutral real rate or r*--has declined significantly. We cannot directly observe the neutral rate but can only infer it from the evolution of the economy--it "is seen by its works."10 The neutral rate changes significantly over time, and estimates of its level entail substantial uncertainty.11 Before the crisis, the longer-run neutral real rate was generally thought to be roughly stable at around 2.25 percent. Since the crisis, estimates have declined steadily. For example, the median estimate implied by FOMC participants stood at 1.0 percent in the December 2016 SEP. Many analysts believe that the neutral rate is even lower than that today and will only return to its longer-run value over time.12 One important implication is that today's low rates are not as stimulative as they may seem--consider that, despite historically low rates, inflation has run consistently below target.
Monetary Policy amid Uncertainty
I'd like to turn now to monetary policy. I expect the economy to continue broadly along its current path, which implies further labor market tightening and inflation edging closer to 2 percent. On this path, unemployment would decline modestly below current estimates of the natural rate and remain there for some time. I see that as a desirable outcome and do not see data suggesting that we are behind the curve. In recent years, the economy has faced significant downside risks, particularly from weak global conditions. The Committee has been quite patient, and I believe that has served us well. But risks now seems to me to be more in balance. Going forward, I see it as appropriate to gradually tighten policy as long as the economy continues to behave roughly as expected. As always, the actual path could be faster or slower than expected and will depend on developments in the economy.
Before concluding, I would like to turn briefly to a discussion of how policy decisions are made, including the role of simple monetary policy rules. Since the 1990s, central banks have grown ever more communicative about their monetary policy decisions. A central tenet that underlies this increase in transparency is that monetary policy is more effective when the public understands how the central bank will respond to changing conditions, and can calibrate expectations accordingly.13 That means that the Committee must have a clearly communicated, systematic way of responding to changes in economic conditions and the outlook. In that spirit, the FOMC takes a forward-looking approach to policymaking, whereby each policy decision the FOMC makes is grounded not just in current assessments of the economy but also in expectations for how the economy will evolve relative to our goals. Individual participants develop their own forecasts of the economy's evolution. The Committee then makes a collective decision, embodied in the postmeeting statement, setting monetary policy to achieve those goals.14 Over time, incoming information and shocks to the economy inevitably alter views of the appropriate path for monetary policy. One way of seeing this is through the SEP forecasts of individual FOMC participants. These forecasts tend to converge over time to the Committee's 2 percent inflation objective and to each individual's interpretation of maximum employment, because each individual explicitly writes down a path for policy that is intended to achieve those outcomes. Accordingly, revisions to the projections tend to show up in the path for the federal funds rate that each individual sees as appropriate to achieve those objectives.15
In preparing for FOMC meetings, policymakers routinely review alternative policy paths prescribed by several simple policy rules that are in wide usage.16 Decades of research have produced many variations of these rules, which are typically derived from differing but valid insights and which yield different rate paths. For example, economists at the Federal Reserve Bank of Cleveland regularly update on the Bank's website an analysis of seven different rules and their prescriptions.17
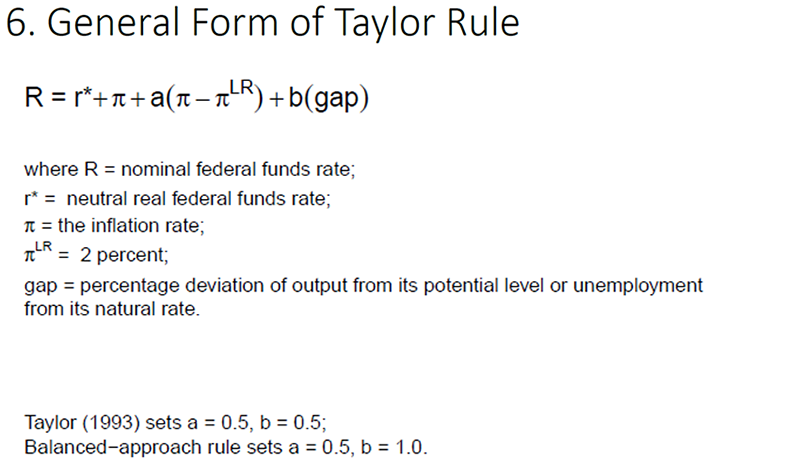
A good way to see the range of possibilities is through a generalized form of a Taylor-type rule (figure 6).18 As you can see, this rule is based on key factors for monetary policy, such as the neutral real rate of interest, or r*, and deviations of inflation and output or unemployment from their longer-run values. While these are often called "simple" rules, application of a rule requires a significant number of important choices. It is necessary to pick a value or a path for r*. The rule also calls for an estimate of the output or unemployment rate gap. There is particularly high uncertainty about measuring the deviation of output from its potential; our real-time estimates of this gap are often revised substantially in hindsight. To reduce that uncertainty, we often use the unemployment gap rather than the output gap in these rules.19 We also need to pick values for the coefficients a and b, whether they are the values John Taylor posited in his seminal 1993 article or other values from the vast literature that has come since.20
There are still other choices to make. Traditional policy rules are backward looking in the sense that they use available data about inflation and output. But monetary policy needs to be forward looking, as I discussed, and there are rules that rely on forecasts of inflation and output. Finally, many have advanced the view that, when times are particularly uncertain, monetary policy should react cautiously to incoming information.21 That insight leads to rules that incorporate inertia, thereby slowing down the movement of rates over time. Each of these insights has some validity, and each has important implications for the prescriptions of a policy rule.
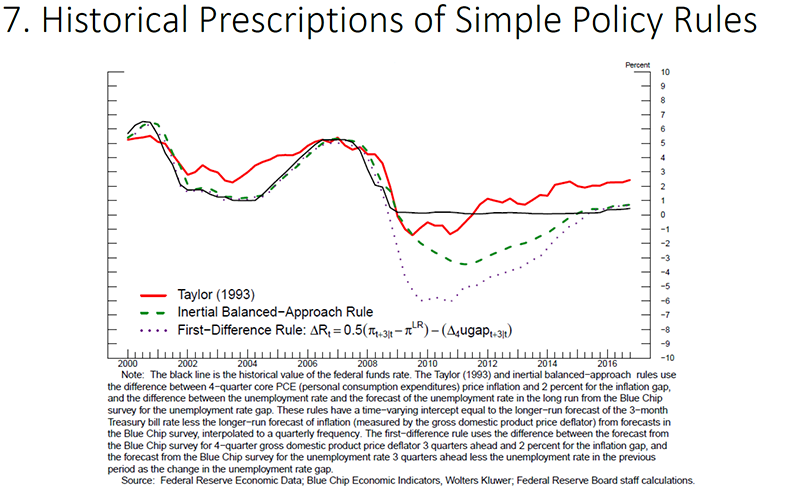
Figure 7 shows the prescriptions of three simple policy rules since 2000.22 While the rules often diverged, all of them called for a substantial reduction in the federal funds rate around the time of the financial crisis, and all of them prescribed easing well below the effective lower bound (ELB).23 Faced with the impossibility of providing more accommodation at the ELB through deeply negative policy rates, the Committee turned instead to two unconventional monetary policy tools--large-scale securities purchases and forward guidance.
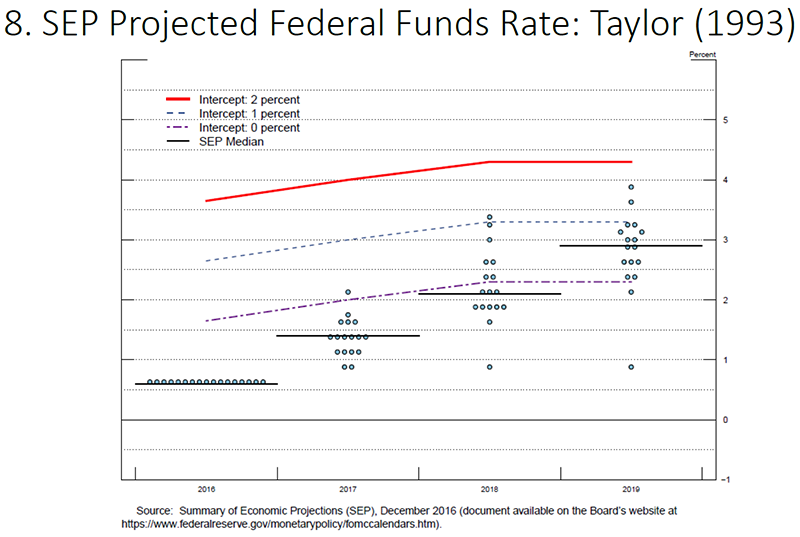
Figure 8 shows the Taylor (1993) rule for different values of r* layered over the "dots" from the December 2016 SEP, with a black horizontal line at the median value for each year.24 The red solid line shows the rule prescriptions when the intercept is set equal to 2 percent, as in Taylor's original formulation. If we replace that intercept with the median of the longer-run r* from the December 2016 SEP, which is 1 percent (the blue dashed line), we see that the rule prescribes policy interest rates lower than the unadjusted rule. However, many observers believe that the neutral real interest rate is currently well below its longer-run value. The language that has appeared in the Committee's postmeeting statement since December 2015 that "the federal funds rate is likely to remain, for some time, below levels that are expected to prevail in the longer run" is consistent with this view. Some estimates put the current value of r* close to zero, which leads to the purple dashed-dotted line in figure 8.25
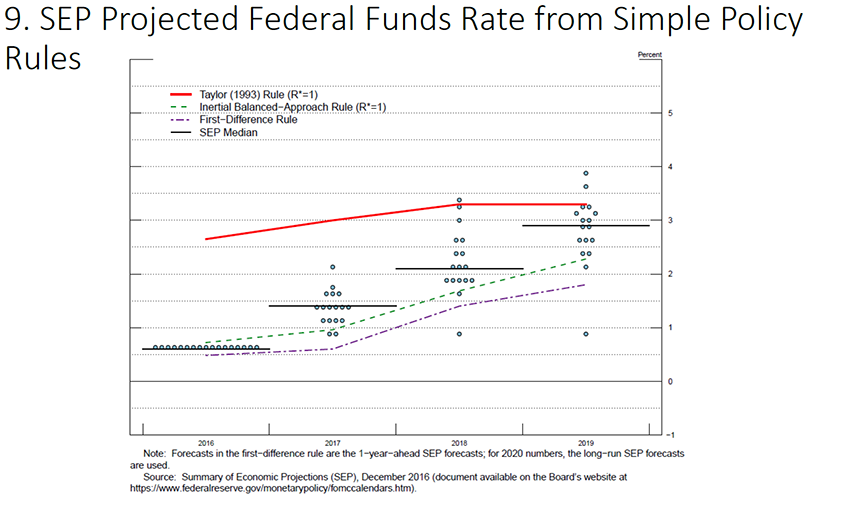
Figure 9 provides prescriptions from the policy rules shown in figure 7 that vary along dimensions other than the neutral real rate. The first-difference rule shown by the purple dashed-dotted line incorporates forecasts by prescribing changes to the federal funds rate based on projected inflation relative to its objective and the projected change in the output gap.26 The insight behind this rule is that it does not require estimates of the neutral real rate or the level of the output gap.27 The green dashed line shows the policy prescription from an inertial version of the "balanced approach" rule with an intercept of 1 percent, which includes a lagged value of the nominal interest rate.28 This rule does not go as far as the first-difference rule in eliminating the level of r* from the policy prescription, but it does prescribe that policy move only slowly toward its longer-run level, which places less weight in the short-run on the estimate of r*. This rule prescription is closer to FOMC participants' assessments of appropriate monetary policy. Although many FOMC participants believe that r* has fallen, they also believe that it will rise toward a longer-term level of 1 percent over time, and the better fit of the inertial rule in part captures this assessment.
I would offer several takeaways from this overview. There is general agreement that these simple policy rules do provide interesting and useful insights into policy. To gain the benefit of those insights, it is helpful to look at a range of rules. But there is no consensus that any one rule is best, let alone that it would be desirable to require the FOMC to pick and mechanically follow one rule to the exclusion of others.29
Simple rules also leave out critical considerations for the path of policy. One such consideration of great importance is that, with the secular decline in interest rates over the past 35 years, policy is now far more likely to hit the ELB than had been thought, which may present severe challenges. Research suggests that, as a precautionary matter, policy should be more aggressive in providing accommodation as rates move closer to the ELB.30 But there is no consensus today on whether or how to incorporate ELB-related risks into a simple policy rule of the type that I have discussed here. Another such consideration is that simple policy rules include no consideration of financial stability. But monetary policy may sometimes face tradeoffs between macroeconomic objectives and financial stability. Recent business cycles show that instability can emerge when inflation is under control. Some have argued for inclusion of a financial stability term into policy rules, but the issue is far from settled.31
To conclude, I think it's fair to say that simple policy rules are widely thought to be both interesting and useful, but to represent only a small part of the analysis needed to assess the appropriate path for policy. I am unable to think of any critical, complex human activity that could be safely reduced to a simple summary equation. In particular, no major central bank uses policy rules in a prescriptive way, and it is hard to predict the consequences of requiring the FOMC to do so, as some have proposed. Policy should be systematic, but not automatic.
1. See the FOMC's Statement on Longer-Run Goals and Monetary Policy Strategy, available in Board of Governors of the Federal Reserve System (2017), Monetary Policy Report (PDF) (Washington: Board of Governors, February). Return to text
2. Figure 1 reports the unemployment rate gap using the Congressional Budget Office (CBO) estimates because they extend further back in time than projections from the SEP. The CBO's estimate of the natural rate for 2017 is 4.7 percent. Return to text
3. The labor force is made up of people who have jobs as well as people who are jobless but are looking for a job and are available to work. See Bureau of Labor Statistics, "Labor Force Participation," webpage (accessed February 17, 2017). Return to text
4. Confidence intervals around statistical estimates of the natural rate are routinely estimated to be quite wide, reflecting both uncertainty about the correct model specification as well as uncertainty about the parameter estimates given the model. The canonical paper by Staiger, Stock, and Watson puts the 95 percent confidence interval at 1-1/2 percentage points on either side of the point estimate. See Douglas Staiger, James H. Stock, and Mark W. Watson (1997), "How Precise Are Estimates of the Natural Rate of Unemployment?" in Christina D. Romer and David H. Romer, eds., Reducing Inflation: Motivation and Strategy (Chicago: University of Chicago Press). Return to text
5. See Stephanie Aaronson, Tomaz Cajner, Bruce Fallick, Felix Galbis-Reig, Christopher Smith, and William Wascher (2014), "Labor Force Participation: Recent Developments and Future Prospects (PDF)," Brookings Papers on Economic Activity, Fall, pp. 197-275. Return to text
6. See Congressional Budget Office (2017), The Budget and Economic Outlook: 2017 to 2027 (PDF) (Washington: CBO, January); and Alan B. Krueger (2016), "Where Have all the Workers Gone? (PDF)" paper presented at the Federal Reserve Bank of Boston's 60th Economic Conference, held at the Federal Reserve Bank of Boston, Boston, October 4. Return to text
7. The history of longer-run forecasts for real GDP growth from the SEP is shown in figure 4 of Jerome H. Powell (2016), "A View from the Fed," speech delivered at the Brookings Institution, Washington, November 30. Return to text
8. There may also be a role for homegrown factors, such as the decrease in business dynamism. See Jerome H. Powell (2016), "Recent Economic Developments, Monetary Policy Considerations, and Longer-Term Prospects," speech delivered at the Chicago Council on Global Affairs, Chicago, June 28. The worldwide nature of the slowdown is documented in Organisation for Economic Co-operation and Development (2016), "New OECD Indicators Trace Productivity Growth Slowdown Pre- and Post-Crisis," webpage, OECD. For a discussion of the effects of dynamism on productivity, see Lucia Foster, John Haltiwanger, and C.J. Krizan (2001), "Aggregate Productivity Growth: Lessons from Microeconomic Evidence," in Charles R. Hulten, Edwin R. Dean, and Michael J. Harper, eds., New Developments in Productivity Analysis (Chicago: University of Chicago Press). Return to text
9. On the pessimistic end of the spectrum are analysts such as Robert J. Gordon (2016), The Rise and Fall of American Growth: The U.S. Standard of Living since the Civil War (Princeton, N.J.: Princeton University Press). Among the optimists are Erik Brynjolfsson and Andrew McAfee (2014), The Second Machine Age: Work, Progress, and Prosperity in a Time of Brilliant Technologies (New York: W.W. Norton & Company). Return to text
10. See John H. Williams (1931), "The Monetary Doctrines of J. M. Keynes," Quarterly Journal of Economics, vol. 45 (August), pp. 547-87. Return to text
11. See Jerome H. Powell (2016), "Discussion of the Paper 'Language after Liftoff: Fed Communication Away from the Zero Lower Bound,'" speech delivered at the 2016 U.S. Monetary Policy Forum, New York, February 26. See also Michael Feroli, David Greenlaw, Peter Hooper, Frederic Mishkin, and Amir Sufi (2016), "Language after Liftoff: Fed Communication Away from the Zero Lower Bound," paper presented at the 2016 U.S. Monetary Policy Forum, a conference sponsored by the University of Chicago Booth School of Business, held in New York, February 26. Return to text
12. See, for example, Kathryn Holston, Thomas Laubach, and John C. Williams (2016), "Measuring the Natural Rate of Interest: International Trends and Determinants (PDF) ," Federal Reserve Bank of San Francisco Working Paper Series 2016-11 (San Francisco: Federal Reserve Bank of San Francisco, August); Benjamin K. Johannsen and Elmar Mertens (2016), "The Expected Real Interest Rate in the Long Run: Time Series Evidence with the Effective Lower Bound," FEDS Notes (Washington: Board of Governors of the Federal Reserve System, February 9); and Michelle Bongard and Benjamin K. Johannsen (2016), "The Neutral Rate and the Summary of Economic Projections," FEDS Notes (Washington: Board of Governors of the Federal Reserve System, November 28). Return to text
13. See Michael Woodford (2001), "Monetary Policy in the Information Economy (PDF)," paper presented at "Economic Policy for the Information Economy," a symposium sponsored by the Federal Reserve Bank of Kansas City, held in Jackson Hole, Wyo., Aug. 30-Sept. 1, pp. 297-370; and Alan S. Blinder, Michael Ehrmann, Marcel Fratzscher, Jakob De Haan, and David-Jan Jansen (2008), "Central Bank Communication and Monetary Policy: A Survey of Theory and Evidence," Journal of Economic Literature, vol. 46 (December), pp. 910-45. Return to text
14. See Janet L. Yellen (2017), "The Economic Outlook and the Conduct of Monetary Policy," speech delivered at the Stanford Institute for Economic Policy Research, Stanford, Calif., January 19. Return to text
15. The SEP is not a "consensus" forecast of the Committee, and the interest rate projections in the SEP are each individual participant's assessment of appropriate monetary policy. Thus, the Committee's forward-looking approach to policymaking is not the same as the forecast-targeting approach advocated by Svensson (2005) and others. See Lars E.O. Svensson (2005), "Monetary Policy with Judgment: Forecast Targeting," International Journal of Central Banking, vol. 1 (June), pp. 1-54. Return to text
16. For another discussion of simple rules and their role in the Committee's policy process, see Stanley Fischer (2017), "I'd Rather Have Bob Solow Than an Econometric Model, But...," speech delivered at the Warwick Economics Summit, Coventry, United Kingdom, February 11. Return to text
17. See Federal Reserve Bank of Cleveland (2017), "Simple Monetary Policy Rules," webpage, Federal Reserve Bank of Cleveland. Return to text
18. See John B. Taylor and John C. Williams (2010), "Simple and Robust Rules for Monetary Policy," in Benjamin M. Friedman and Michael Woodford, eds., Handbook of Monetary Economics, vol. 3 (Amsterdam: Elsevier), pp. 829-59. Return to text
19. In general, the unemployment rate is more informative of the state of the business cycle than GDP because of the difficulties in estimating potential output. See Charles A. Fleischman and John M. Roberts (2011), "From Many Series, One Cycle: Improved Estimates of the Business Cycle from a Multivariate Unobserved Components Model (PDF)," Finance and Economics Discussion Series 2011-46 (Washington: Board of Governors of the Federal Reserve System, October). Return to text
20. See John B. Taylor (1993), "Discretion versus Policy Rules in Practice," Carnegie-Rochester Conference Series on Public Policy, vol. 39 (December), pp. 195-214. Return to text
21. See William Brainard (1967), "Uncertainty and the Effectiveness of Policy," American Economic Review, vol. 57 (May), pp. 411-25. In discussing the effects of uncertainty on monetary policy, Blinder (1998, p. 11) notes that policymakers "should compute the direction and magnitude of their optimal policy move...and then do less." See Alan S. Blinder (1998), Central Banking in Theory and Practice (Cambridge, Mass.: MIT Press). Others have suggested that inertia may be a feature of making decisions by committee; see Clare Lombardelli, James Proudman, and James Talbot (2005), "Committees versus Individuals: An Experimental Analysis of Monetary Policy Decision Making," International Journal of Central Banking, vol. 1 (June), pp. 181-205; and Francisco Ruge-Murcia and Alessandro Riboni (forthcoming), "Collective versus Individual Decision-making: A Case Study of the Bank of Israel Law," European Economic Review. Return to text
22. These are static simulations and do not incorporate feedback from the policy rule to real activity or inflation. Return to text
23. Ben Bernanke finds that a "balanced approach" rule estimated using real-time data closely tracks the federal funds rate from 1996 through 2008. See Ben S. Bernanke (2015), "The Taylor Rule: A Benchmark for Monetary Policy?" Ben Bernanke's Blog, April 28. Return to text
24. Figure 2 of the SEP provides each individual FOMC participant's assessment of "appropriate monetary policy" in the form of a dot plot. "Appropriate monetary policy" is defined as the future path of policy that each participant deems most likely to foster outcomes for economic activity and inflation that best satisfy his or her individual interpretation of the Federal Reserve's objectives of maximum employment and price stability. The policy prescriptions are derived using the median projections for core PCE price inflation, the unemployment rate, and the longer-run normal unemployment rate from the December 2016 SEP. Return to text
25. See Kathryn Holston, Thomas Laubach, and John C. Williams (2016), "Measuring the Natural Rate of Interest: International Trends and Determinants (PDF)," Finance and Economics Discussion Series 2016-073 (Washington: Board of Governors of the Federal Reserve System, September). Return to text
26. Orphanides (2003) proposed a rule that sets changes in the nominal interest rate equal to deviations in nominal income growth relative to target, ΔR = β [ (π + Δy) -(π* + Δy*) ], where y is real GDP. The forecast-based version employed here substitutes the change in the unemployment gap for the change in the output gap (using an Okun's law coefficient of 2) and sets β to 0.5, yielding ΔR = 0.5 (π-π*) -Δu. When implemented using forecasts, inflation is the 4-quarter inflation rate 3 quarters ahead, and Δu is the 4-quarter change in the unemployment rate 3 quarters ahead. See Athanasios Orphanides (2003), "Historical Monetary Policy Analysis and the Taylor Rule," Journal of Monetary Economics, vol. 50 (July), pp. 983-1022. Return to text
27. While the natural rate of interest may be changing over time and the first-difference rule does not take these changes into account, Orphanides and Williams (2007) argue that rules like the first-difference rule can deliver good economic performance even when there is uncertainty about those changes. See Athanasios Orphanides and John C. Williams (2007), "Robust Monetary Policy with Imperfect Knowledge," Journal of Monetary Economics, vol. 54 (July), pp. 1406-35. Return to text
28. Chair Yellen has called this rule the "balanced-approach" rule. See Janet L. Yellen (2012), "Perspectives on Monetary Policy," speech delivered at the Boston Economic Club Dinner, Boston, June 6. This rule has also been considered by others. For example, see John B. Taylor (1999), "A Historical Analysis of Monetary Policy Rules," in John B. Taylor, ed., Monetary Policy Rules (Chicago: University of Chicago Press), p. 319-341. Return to text
29. Eisenhardt and Sull proposed the use of simple rules by corporations. See Kathleen M. Eisenhardt and Donald Sull (2001), "Strategy as Simple Rules," Harvard Business Review, January. Among the companies they site positively as having employed simple rules were Enron, AOL, and Yahoo. Return to text
30. See Charles Evans, Jonas Fisher, Francois Gourio, and Spencer Krane (2015), "Risk Management for Monetary Policy Near the Zero Lower Bound (PDF)," Brookings Papers on Economic Activity, BPEA Conference Draft, March 19-20. Return to text
31. See Tobias Adrian and Nellie Liang (2014), "Monetary Policy, Financial Conditions, and Financial Stability (PDF)," Federal Reserve Bank of New York Staff Reports 690 (New York: Federal Reserve Bank of New York, September; revised December 2016). Return to text
31. See Tobias Adrian and Nellie Liang (2014), "Monetary Policy, Financial Conditions, and Financial Stability (PDF)," Federal Reserve Bank of New York Staff Reports 690 (New York: Federal Reserve Bank of New York, September; revised December 2016). Return to text