
FEDS Notes
 Print
PrintFebruary 9, 2016
The Expected Real Interest Rate in the Long Run: Time Series Evidence with the Effective Lower Bound
Benjamin K. Johannsen and Elmar Mertens1
Introduction
In response to the global financial crisis, the Federal Open Market Committee lowered the target for the federal funds rate to a range of 0 to 25 basis points in December 2008, and maintained that target range until the end of 2015. Over that same period, longer-term interest rates in the United States were at historically low levels. When the Federal Open Market Committee began its policy normalization process in December 2015, it stated that "the federal funds rate is likely to remain, for some time, below levels that are expected to prevail in the longer run."
In this note, we present estimates of the expected long-run level of the real federal funds rate, which--together with long-run inflation expectations--makes up the level of the nominal federal funds rate that is expected to prevail in the long run. In recent years, researchers and commentators have pointed to a possible decline in the longer-run normal level of the real federal funds rate that could have been caused by a number of economic factors--such as a decline the trend rate of output growth or an aging population.2 We use a statistical framework to estimate the expected long-run normal level of the real federal funds rate. To distinguish cyclical variations in the real interest rate from those with longer-run consequences we condition our estimates on a measure of economic slack, inflation, and the levels of short- and longer-term interest rates. Since the nominal federal funds rate has been at (or very near) its effective lower bound (ELB) in recent years, we embed the concept of so-called shadow rates (further explained below) in a time-series model that captures the joint dynamics of interest rates, inflation and economic slack. While we find some supporting evidence for a decline in the expected longer-run level of the federal funds rate, our estimates also show that these results are surrounded by large amounts of uncertainty.
Methodology and Data
We use a dynamic time-series model to characterize the evolution of the following four observable variables: the nominal federal funds rate, the nominal yield on Treasury bonds with a maturity of five years, headline PCE inflation, and a measure of the unemployment gap based on the Congressional Budget Office's (CBO) estimates of the natural rate of unemployment in the long term.
A key element of our modeling approach is a decomposition of data into trends and cyclical components. In macroeconomics, there is a long history of distinguishing between permanent and transitory effects of economic disturbances (see, for example, Blanchard and Fischer, 1989). Specifically, in the spirit of the frequently-used framework of Beveridge and Nelson (1981), we identify the trend components in each variable from the long-run forecasts generated by our model for each variable. Assuming that monetary policy can affect real variables only temporarily, the trend in real interest rates identified by our model can also be considered a measure of the longer-run neutral equilibrium real rate.3
The following trend components are specified in our model: a common trend in nominal interest rates and an inflation trend; the unemployment gap is expected to converge to zero in the long run.4 The common trend assumption for nominal interest rates implies that fluctuations in interest rate spreads will eventually peter out without changes in long-term spreads. As a result, our model's long-run forecasts for the federal funds rate and the nominal Treasury bond are restricted to move in lockstep.5 Furthermore, appealing to a long-run version of the Fisher equation, the trend in the nominal federal funds rate is modeled as the sum of the inflation trend and the real-rate trend, which we use to measure the longer-run normal level of the real federal funds rate. As a result, the expected long-run level of the nominal federal funds rate can change over time either because of variations in trend inflation or because of changes in the longer-term expected real rate.
The trend component of inflation allows our model to capture the persistent rise of the average level of inflation in the 1970s and its subsequent decline. The variability and persistence of inflation has varied considerably over our sample (see for example Cogley, Primiceri and Sargent, 2010) and we build on the work by Stock and Watson (2007, 2010, 2015), Garnier, Mertens and Nelson (2015), Shephard (2016) and Mertens (forthcoming) by assuming that the volatility of the trend component of inflation--as well as the variability of cyclical shocks to inflation as explained in more detail below--varies over time.6
We model the cyclical components of inflation, the federal funds rate, the long-term interest rate, and the unemployment gap as a vector-autoregressive process. In order to capture the notable variations in the size of the business cycle in post-war U.S. data (see Bernanke (2004) for a detailed discussion), the gap components of our model are assumed to have time-varying volatility; as in, for example, Justiniano and Primiceri (2008). Modeling the cyclical components in a joint vector autoregression captures the co-movements and interactions between current and past values of each of the variables in a parsimonious and fairly agnostic way. Among others, this modeling strategy allows the federal funds rate to respond to movements in economic slack--as measured by the unemployment rate gap--and cyclical variations of inflation. It also allows the unemployment rate gap to move in conjunction with changes in financial conditions that are captured by the cyclical component of the yield on longer-term Treasury bonds or for cyclical fluctuations in inflation to depend on changes in the unemployment rate gap.
Our model is estimated using quarterly data ranging from 1960:Q1 to 2015:Q4; all data is publicly available from the FRED database maintained by the Federal Reserve Bank of St. Louis.7 Inflation is measured by the quarterly rate of change in the PCE headline deflator (expressed as an annualized percentage rate).8 Readings for the federal funds rate and the 5-year nominal bond yields are constructed as quarterly averages of the effective federal funds rate and the Treasury's 5-year constant maturity rate, respectively.9 The unemployment gap is computed as the difference between the quarterly average rate of unemployment and the CBO's measure of the natural long-term rate of unemployment for a given quarter.10 All computations are based on the vintage of FRED data available that has been available at the end of January 2016.
Modeling Interest Rates at the Effective Lower Bound
A challenge for our statistical model is that, from late 2008 to late 2015, the federal funds rate was at (or very near) the ELB. This lower bound on nominal interest rates potentially alters the co-movement between the federal funds rate and the other data in our sample. Additionally, the non-linearity of the ELB is often ignored by traditional time-series methods. To overcome this technical challenge, we define the "shadow" federal funds rate, which is a notional rate that is constructed to be less than the zero during the period that the target range for the federal funds rate was between 0 and 25 basis points. During all other times, the shadow rate is assumed to equal to the federal funds rate. In this way, the observed nominal federal funds rate can be thought of as a censored version of the shadow rate. At the ELB we do not observe the shadow rate, but estimates of the shadow rate can be generated based on the historical persistence and co-movements between the federal funds rate and the other series in our model.
Several other studies have used the term "shadow rate" to refer to a similar modeling object, notably Krippner (2013), Wu and Xia (2015), and Bauer and Rudebusch (2014) that is typically derived from no-arbitrage conditions embedded in a term structure model for nominal interest rates. Our contribution is that we estimate time-variation in the longer-run normal level of the federal funds rate in a somewhat more agnostic time-series framework that infers the shadow rate merely by treating nominal interest rates at the ELB as censored shadow rates, but without imposing any particular economic structure. As a first step towards our approach the federal funds rate at the ELB could also be treated as missing data (without regard for any censoring constraints), which is equivalent to allowing the shadow rate to take any value during that period, as has been done, for example, by Tallman and Zaman (2012). In this case, the information contained in the federal funds rate during the period of the ELB would be discarded and the shadow rate would be inferred merely from the historical co-movements between the federal funds rate and the other macroeconomic variables used in our model. Below, we present results from both modeling approaches.
Estimates of the Longer-Run Level of the Real Federal Funds Rate
Figure 1 shows our estimate of the expected long-run real federal funds rate when we impose the restriction that the shadow rate be less than the zero during the period of the ELB. Panel A shows estimates that, at each date, use information up to that date (we refer to these as filtered estimates). Panel B shows estimates that use the entire data sample (we refer to these as smoothed estimates). Nevertheless, as the figure shows, we find some evidence of a decline in the expected longer-run federal funds rate using either the filtered or the smoothed estimates.
| Figure 1: Expected Long-Run Real Federal Funds Rate |
|---|
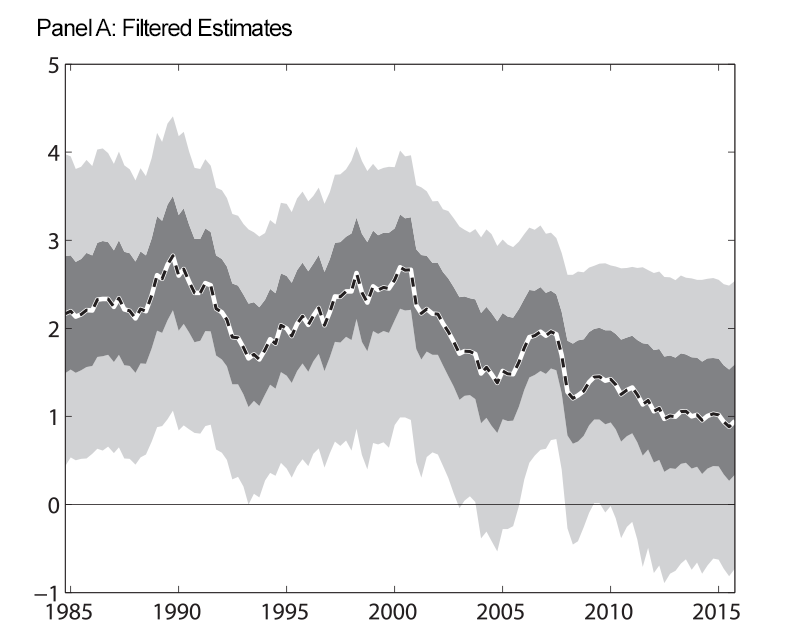 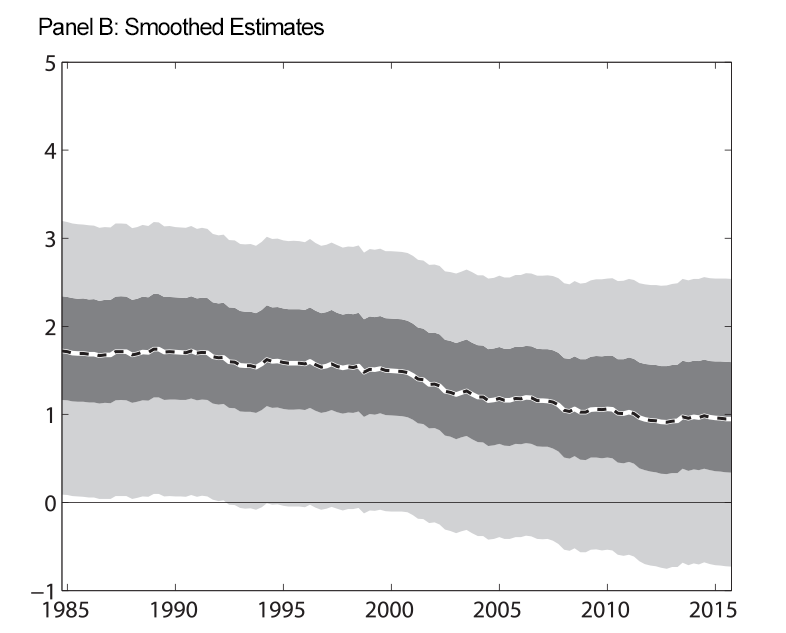 |
Note: At each date, filtered estimates use data up through that date to estimate the parameters of the model and the level of the long-run real federal funds rate. Smoothed estimates use data through the entire sample to estimate the parameters and the historical level of the long-run real federal funds rate. For the results in this figure, we impose that the shadow rate be less than zero during the period of the ELB. Shaded regions are 50 and 90 percent uncertainty bands. Estimated trends are expressed in annual percentage terms.
The uncertainty bands surrounding our estimates are wide, indicating uncertainty about both the level of and changes in the expected longer-run real federal funds rate is large. These results are reminiscent of results reported by Hamilton and others (2015), Kiley (2015), and Lubik and Matthes (2015) who also report large uncertainty bands surrounding estimates of the longer-run real rate.
An important feature of our estimated trend in real interest rates is that any decline began well-before the onset of the Great Recession; in particular also when considering our filtered estimates that do not condition on future observations from our data set. Our model sees the low federal funds rate since 2008 through the lens of co-movement among all of the variables in our model. Moreover, the time-varying volatility of the gap components helps the model attribute large changes in unemployment and inflation, like those seen at the onset of the global financial crisis, to cyclical fluctuations. This flexibility of our model helps explain why our model sees less movement in the trend real interest rate over the past decade than results reported in some other studies, for example Laubach and Williams (2015). Instead, the model delivers an estimate of a slow-moving and long-lived decline in the real rate trend that appears to have continued through the past few years.
To ensure that our results are not overly influenced by our shadow rate modeling device, we also conduct our analysis assuming that the federal funds rate data are missing whenever the federal funds rate average for a quarter was less than 25 basis points. Figure 2 shows the estimated real rate trend under this alternative treatment of the data. As in Figure 1, panels A and B show filtered and smoothed estimates. We again find that the estimated real rate trend is surrounded by lots of uncertainty and that any estimated decline in the trend began well before the onset of the global financial crisis.
| Figure 2: Expected Long-Run Real Federal Funds Rate, No ELB |
|---|
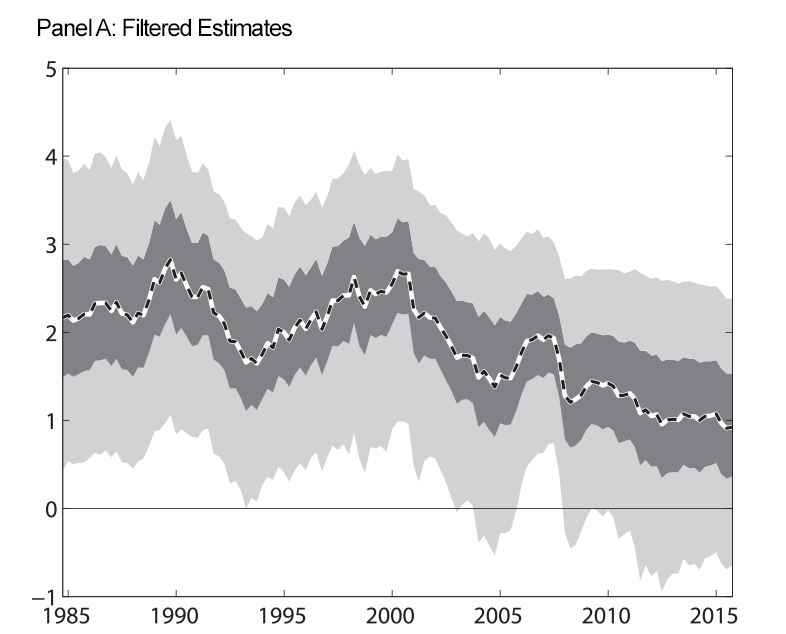 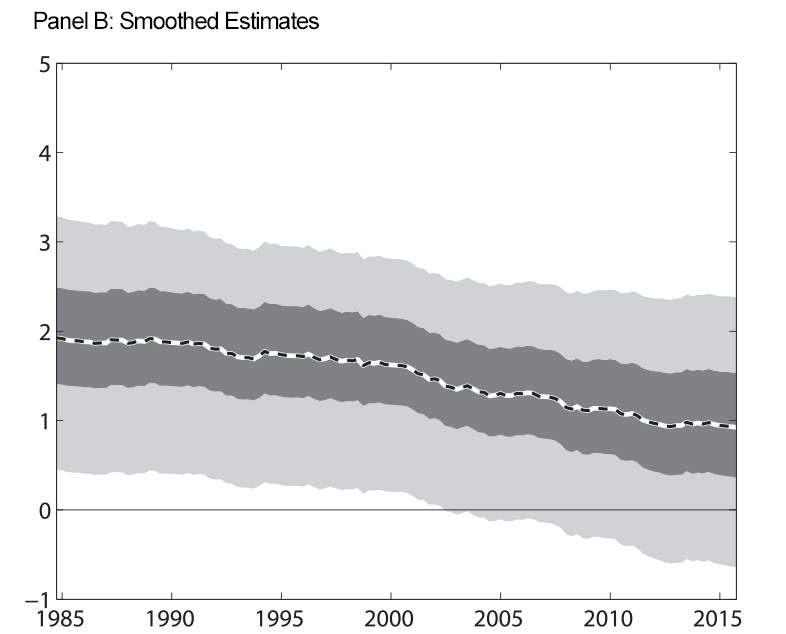 |
Note: At each date, filtered estimates use data up through that date to estimate the parameters of the model and the level of the long-run real federal funds rate. Smoothed estimates use data through the entire sample to estimate the parameters and the historical level of the long-run real federal funds rate. For the results in this figure, we do not impose that the shadow rate be less than zero during the period of the ELB. Shaded regions are 50 and 90 percent uncertainty bands. Estimated trends are expressed in annual percentage terms.
Figure 3 shows our estimates of the shadow rate. Panel A shows the shadow rate when we impose the censoring constraint which requires that the shadow rate be less than zero during the ELB period and panel B shows the shadow rate when we do not impose this restriction. While the estimated shadow rates from the two procedures are not identical, they show similar movements over time. This indicates that the information contained in the longer-term interest rate, as well as the information from inflation and the unemployment rate gap, is informative about shorter-term rates, and that our shadow rate modeling device is unlikely to be driving our results regarding the longer-run real federal funds rate.
| Figure 3: Estimated Shadow Rate |
|---|
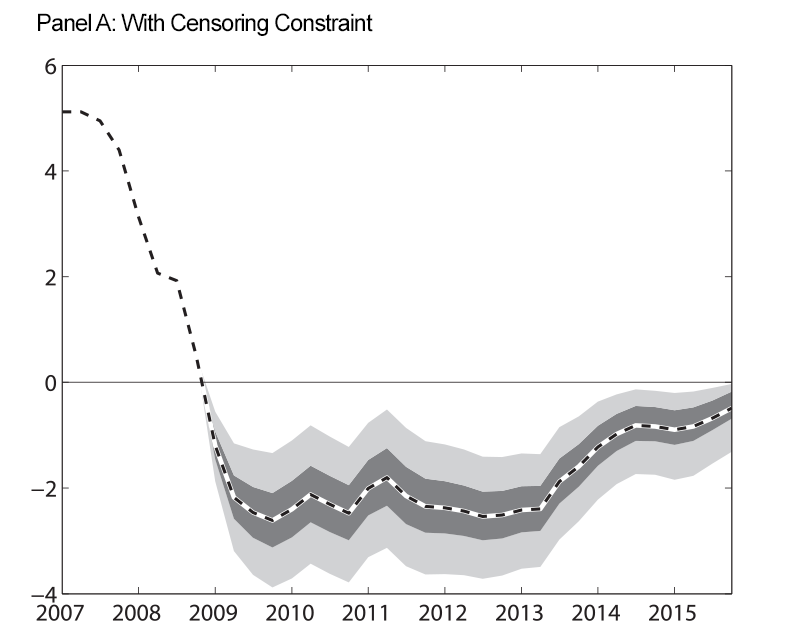 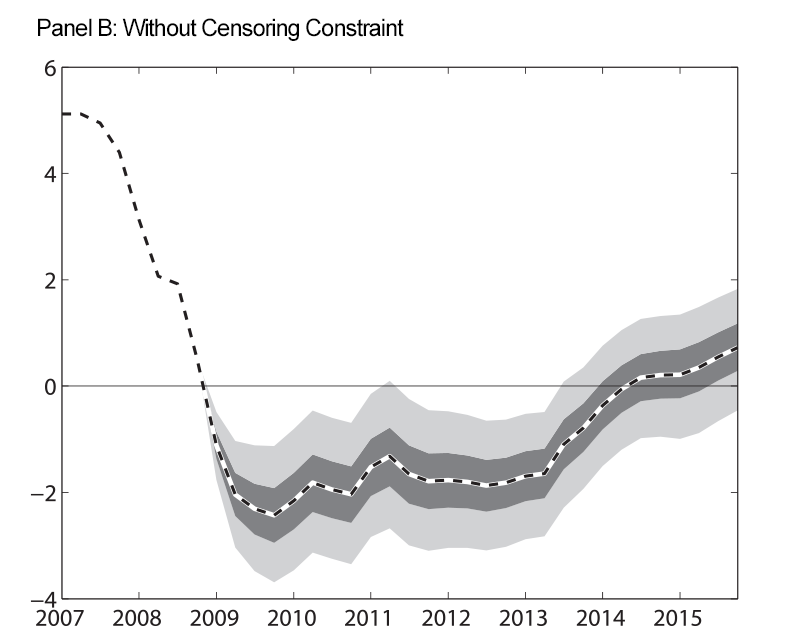 |
Note: At each date, the estimates of the shadow rate shown in both panels use data through the entire sample to estimate the parameters and the historical level of the shadow rate. Prior to 2008, the shadow rate in our model is equal to the federal funds rate. Shaded regions are 50 and 90 percent uncertainty bands. Estimated shadow rates are expressed in annual percentage terms.
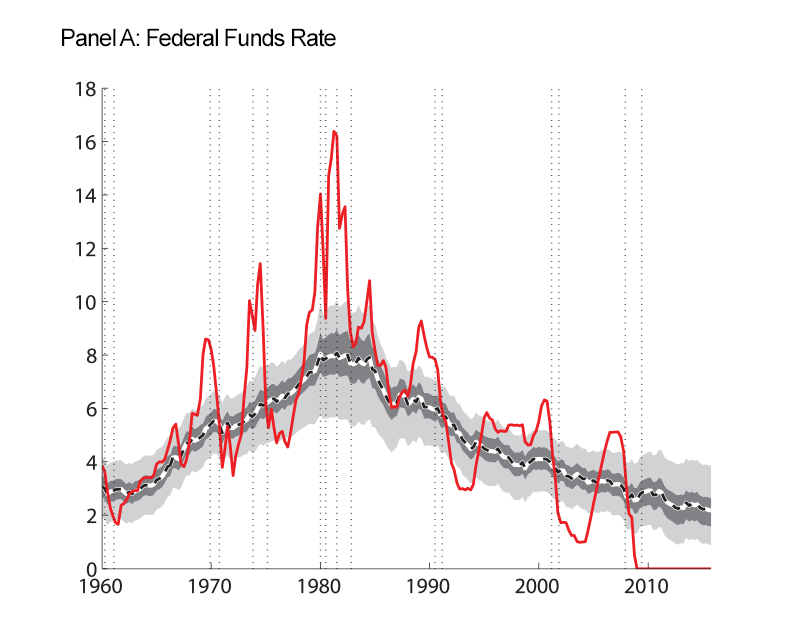
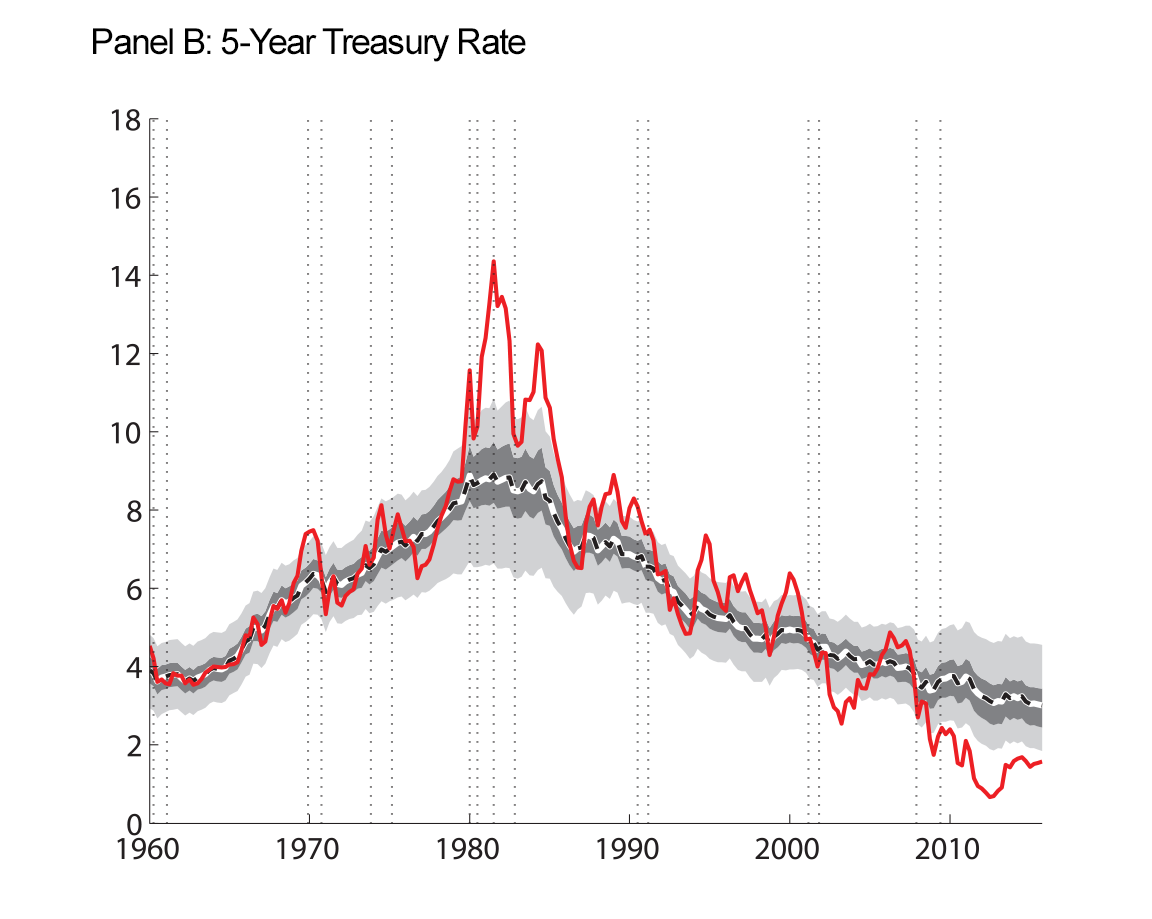
Our final figure displays the data we use as inputs to our model estimation, along with the smoothed trends that our model produces.
| Figure 4: Macroeconomic Data and Estimated Trends |
|---|
  |
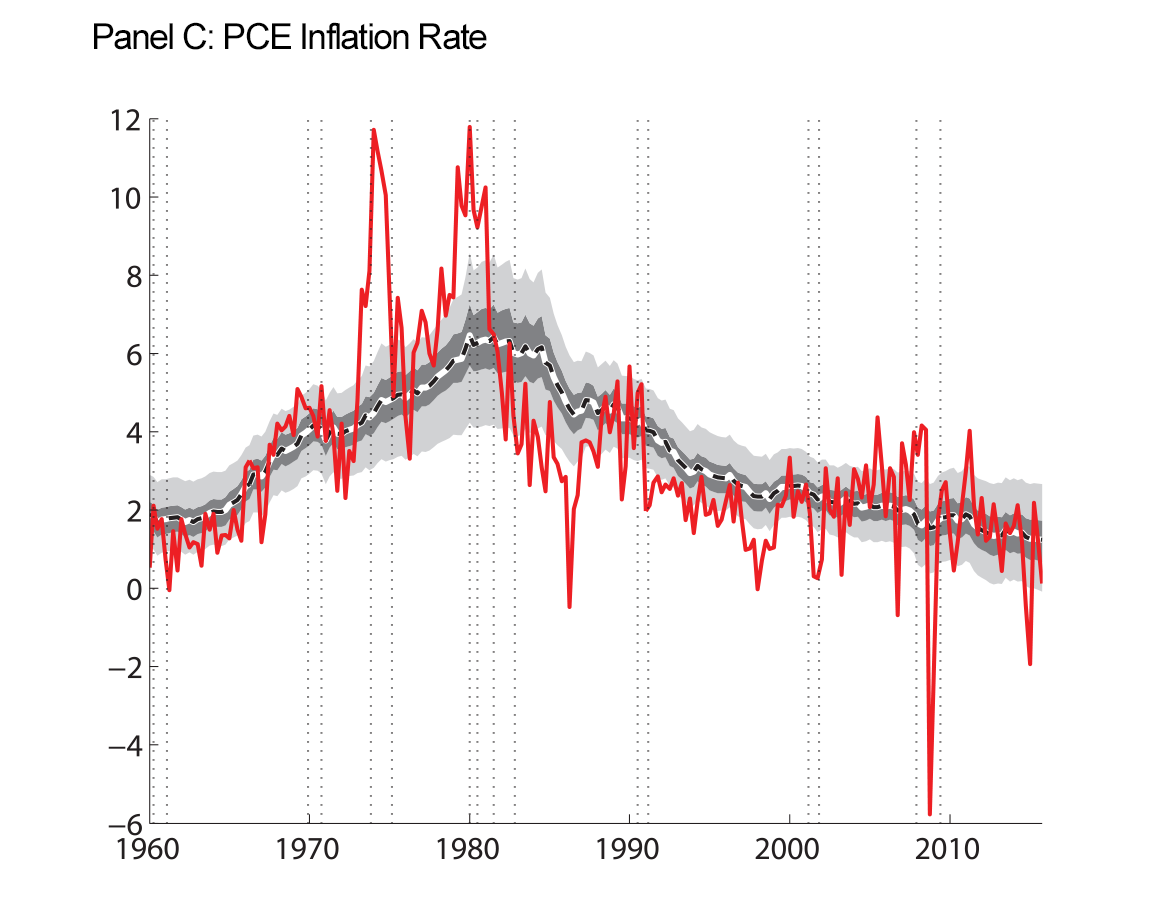 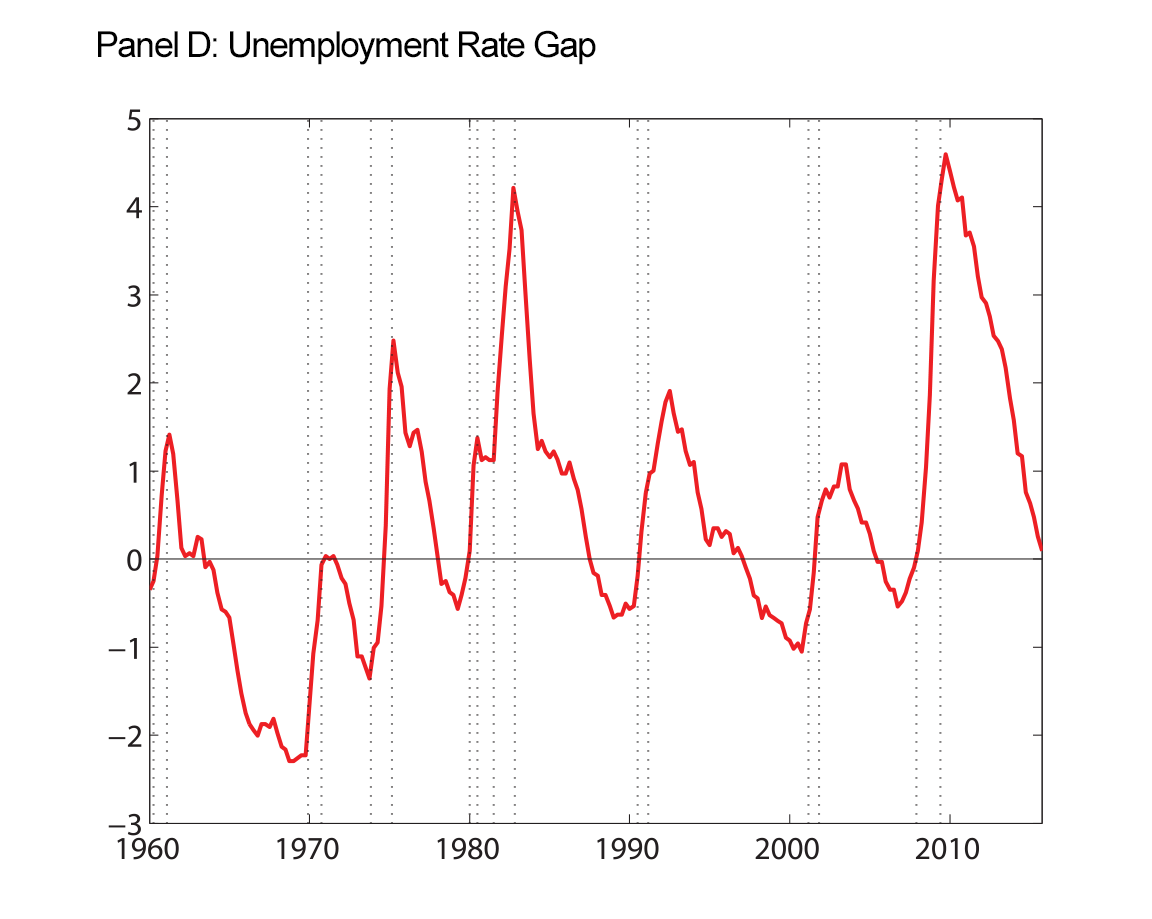 |
Note: Raw data are shown as the red solid line. At each date, we use data through the entire sample to estimate the parameters and the historical levels of the trends shown. Shaded regions are 50 and 90 percent uncertainty bands. Inflation and interest rates, along with their estimated trends, are expressed in annual percentage terms. Vertical dotted lines indicate peaks and troughs associated with recession, as dated by the National Bureau of Economic Research, http://www.nber.org/cycles.html  .
.
Conclusions
Interest rates in the United State have been historically low since 2008. Given the severity of the recession that followed the global financial crisis, it is no surprise that interest rates fell. However, it remains to be seen how much of that decline will be long-lasting.
Our modeling framework allows us to estimate the trend component of the real federal funds rate while filtering out cyclical fluctuations in the real federal funds rate based on its co-movement with other macroeconomic conditions as measured by the CBO's unemployment rate gap, inflation, and financial conditions represented by the level of longer-term Treasury yields. As our exercise draws on nominal interest rate data, we also account for the period of the ELB by modeling observed nominal interest rates as censored realizations of so-called shadow rates, which are hypothetical nominal interest rates implied by our model for the case where interest rates could fall below ELB. Our results suggest that any decline in the trend component of real interest rates over recent years can be thought of as a continuation of a decline that began years before. However, our results also suggest that estimates of the longer-run expected value of the federal funds rate are surrounded by a large amount of uncertainty.
References
Bauer, Michael and Glenn Rudebusch, forthcoming, "Monetary Policy Expectations at the Zero Lower Bound," Journal of Money, Credit, and Banking.
Bernanke, Ben S., February 20, 2004, "The Great Moderation," Remarks at the meetings of the Eastern Economic Association, Washington, DC.
Beveridge, Stephen and Charles R. Nelson, 1981, "A New Approach to Decomposition of Economic Time Series into Permanent and Transitory Components with Particular Attention to Measurement of the 'Business Cycle'," Journal of Monetary Economics, 7(2), pp. 151-174.
Blanchard, Olivier and Stanley Fischer, 1989, March, "Lectures on Macroeconomics," MIT Press, ISBN: 9780262022835.
Cogley, Timothy, Giorgio E. Primiceri, and Thomas J. Sargent, 2010. "Inflation-Gap Persistence in the US," American Economic Journal: Macroeconomics, 2(1): 43-69.
Garnier, Christine, Elmar Mertens, and Edward Nelson, 2015, September, "Trend Inflation in Advanced Economies," International Journal of Central Banking.
Hamilton, James D., Ethan S. Harris, Jan Hatzius, and Kenneth D. West, 2015, October, "The Equilibrium Real Funds Rate: Past, Present, and Future," Hutchins Center on Fiscal & Monetary Policy at Brookings Working Paper #16.
Kiley, Michael T., 2015, August, "What Can the Data Tell Us About the Equilibrium Real Interest Rate?" Finance and Economics Discussion Series, Federal Reserve Board of Governors, 2015-077.
Krippner, Leo, 2013, August, "A Tractable Framework for Zero Lower Bound Gaussian Term Structure Models," Reserve Bank of New Zealand Discussion Paper Series, DP2013/02.
Laubach, Thomas and John C. Williams, 2015, November, "Measuring the Natural Rate of Interest Redux," Hutchins Center on Fiscal & Monetary Policy at Brookings Working Paper #15.
Lubik, Thomas A. and Christian Matthes, 2015, October. "Calculating the Natural Rate of Interest: A Comparison of Two Alternative Approaches." Economic Brief No. 15-10. Federal Reserve Bank of Richmond.
Mertens, Elmar, forthcoming, "Measuring the Level and Uncertainty of Trend Inflation," Review of Economics and Statistics.
Rachel, Lukasz and Thomas D. Smith, 2015, December, "Secular Drivers of the Global Real Interest Rate," Bank of England Staff Working Paper, No. 571.
Shephard, Neil, 2016. "Martingale Unobserved Component Models," in Unobserved Components and Time Series Econometrics edited by Siem Jan Koopman and Neil Shephard, Oxford University Press.
Stock, James H. and Mark W. Watson, 2007, February, "Why has U.S. Inflation Become Harder to Forecast?" Journal of Money, Credit, and Banking 29(S1), 3-33.
Stock, James H. and Mark W. Watson, 2010, October, "Modeling Inflation after the Crisis" NBER Working Papers 16488, National Bureau of Economic Research.
Stock, James H. and Mark W. Watson, 2015, June, "Core Inflation and Trend Inflation," NBER Working Papers 21282, National Bureau of Economic Research.
Summers, Lawrence H., 2014, "US Economic Prospects: Secular Stagnation, Hysteresis and the Zero Lower Bound," Business Economics, 49(2), pp. 65-73.
Tallman, Ellis W. and Saeed Zaman, 2012, October. "Where Would the Federal Funds Rate Be, If It Could Be Negative?" Economic Commentary No. 2012-15, Federal Reserve Bank of Cleveland.
Wu, Jing Cynthia and Fan Dora Xia, forthcoming, "Measuring the Macroeconomic Impact of Monetary Policy at the Zero Lower Bound," Journal of Money, Credit, and Banking.
Yellen, Janet L., December 2, 2015. "The Economic Outlook and Monetary Policy," Remarks at the Economic Club of Washington, D.C.
1. Board of Governors of the Federal Reserve System. The views expressed here are those of the authors and not necessarily the views of the Board of Governors, the FOMC, or anyone else associated with the Federal Reserve System. Return to text
2. See, for example, Summers (2014) and Rachel and Smith (2015). Return to text
3. The neutral equilibrium real rate is typically defined as the inflation-adjusted "value of the federal funds rate that would be neither expansionary nor contractionary if the economy were operating near its potential" (Yellen, 2015). Since our estimated real-rate trend can only provide a perspective on longer-run expectations of the neutral equilibrium real rate, it does not provide an indication about the appropriate stance of monetary policy in the near term. Return to text
4. Implicitly, our model treats the CBO's estimate of the natural rate of unemployment as the (known) trend rate of unemployment. Return to text
5. The common trend assumption does not restrict long-run forecasts of short- and long-term interest rates to be identical because we additionally estimate an average difference between long-term and short-term rates. Return to text
6. Specifically, we allow for time-varying volatility in three components of the inflation process: trend and cycle plus a serially uncorrelated measurement error that serves to filter out the high-frequency variations in headline inflation. Return to text
7. See https://research.stlouisfed.org/fred2/ . Return to text
8. See https://research.stlouisfed.org/fred2/data/PCECTPI.txt . Return to text
9. Available at https://research.stlouisfed.org/fred2/data/DFF.txt , and https://research.stlouisfed.org/fred2/data/GS5.txt , respectively. Return to text
10. Available at https://research.stlouisfed.org/fred2/series/UNRATE and https://research.stlouisfed.org/fred2/series/NROU . Return to text
Please cite this note as:
Benjamin K. Johannsen and Elmar Mertens (2016). "The Expected Real Interest Rate in the Long Run: Time Series Evidence with the Effective Lower Bound," FEDS Notes. Washington: Board of Governors of the Federal Reserve System, February 9, http://dx.doi.org/10.17016/2380-7172.1703.
Disclaimer: FEDS Notes are articles in which Board economists offer their own views and present analysis on a range of topics in economics and finance. These articles are shorter and less technically oriented than FEDS Working Papers.