November 30, 2016
A View from the Fed
At the "Understanding Fedspeak" event cosponsored by the Hutchins Center on Fiscal and Monetary Policy at the Brookings Institution and the Center for Financial Economics at Johns Hopkins University, Washington, D.C.

Thanks to David Wessel and the Hutchins Center on Fiscal and Monetary Policy at the Brookings Institution for putting together this event.1 Today I will share my own views on the Federal Open Market Committee's (FOMC) public communications, which are designed to serve three important purposes. The first is to provide the transparency that enables the Congress and the public to hold the Committee accountable for its decisions on monetary policy. The second is to enhance the effectiveness of monetary policy. If the public understands the central bank's views on the economy and monetary policy, then households and businesses will take those views into account in making their spending and investment plans; policy will be more effective as a result. And the third is to show the full range of FOMC participants' views, even if doing so may sometimes make it difficult for the public to identify a consensus view. In my view, acknowledgment of this diversity of views is important in sustaining the public's support over time for the Federal Reserve as an institution--what Jon Faust refers to in his paper as our "democratic legitimacy."2 In my comments, I will also react to Jon's thought-provoking and well-reasoned paper.
The Modern Era
I will start with a brief tour of the modern era of FOMC communications, beginning with the issuance of the first postmeeting statement in February 1994.3 That statement contained four sentences and noted that the policy action was being announced immediately "so as to avoid any misunderstanding of the Committee's purposes."4 The Committee took additional steps to enhance transparency over the next two decades by putting its target for the federal funds rate into the statement (July 1995); releasing statements after every meeting rather than only after meetings at which the Committee had changed its policy (May 1999); including voting information along with an explanation of dissents in the statement (March 2002); adding the first explicit forward-guidance language to the statement--the "considerable period" language (August 2003); and accelerating the release of the minutes after an FOMC meeting (December 2004).5
The pace of change accelerated notably after Ben Bernanke became Chairman in 2006. At that time, the Fed was said to be a bit of a communications laggard compared with some other central banks. Chairman Bernanke's agenda would move the FOMC to the forefront of transparency and accountability in modern central banking.
In October 2007, after extensive discussions and internal trial runs, the FOMC published its first Summary of Economic Projections (SEP), which built on the macroeconomic forecasts from the semiannual Monetary Policy Report to the Congress. Since then, SEP projections have been expanded to include longer-run values for real gross domestic product growth, the unemployment rate, headline PCE (personal consumption expenditures) price inflation, and the federal funds rate; assessments of uncertainty and risks to the economic outlook; and, of course, the federal funds rate projections, or "dot plot," added in January 2012.6 An extensive write-up of the projections is included as an addendum to the meeting minutes. Finally, and perhaps most important, since April 2011, the Chair has held a quarterly press conference following the FOMC meetings at which SEP projections are collected.
In January 2012, the Committee first released its Statement on Longer-Run Goals and Monetary Policy Strategy, which is reaffirmed annually. This consensus statement serves as a quasi-constitutional document that clarifies that the Committee's inflation objective is 2 percent as measured by the annual change in the PCE price index, that this objective is symmetric, that the maximum level of employment is largely determined by nonmonetary factors affecting the structure and dynamics of the labor market, and that the Committee will take a balanced approach to promote its objectives of maximum employment and 2 percent inflation under circumstances in which the Committee judges that those objectives are not complementary.
Compared with a decade ago, FOMC participants express their views more frequently through speeches and interviews, and our communications vehicles reveal a greater diversity of viewpoints. In FOMC meetings, as readers of our transcripts know, FOMC participants now speak longer than they did before 2006, and they typically make their remarks prior to hearing the policy views of the Chair. Since September 2010, the minutes have included paragraphs that reflect the views on monetary policy expressed by all meeting participants, not just those who vote on the policy decision. These changes, taken together with the SEP and the dot plot, have given greater emphasis to the diversity of views of Fed policymakers.
Discussion
The large size and unique structure of the FOMC have important implications for our communications. The Committee has seats for up to 19 participants, up to 12 of whom hold votes at any given time. Governors are appointed by the President and confirmed by the Senate. Reserve Bank Presidents are appointed by the Banks' private-sector board members who are not affiliated with commercial banks, subject to approval by the Board of Governors. This unique federated structure was designed to ensure a diversity of views, among other purposes. My strong view is that this institutionalized diversity of thinking is a strength of our System. My own experience is that the best outcomes are reached when opposing viewpoints are clearly and strongly presented before decisions are made. The Committee's diversity shows through most clearly at times such as these, when economic conditions have been particularly challenging and when there have been significant policy disagreements.
Our communications are intended to enable the public to better understand how the Committee sees the economic situation and outlook, as well as what the Committee is likely to do if incoming data differ from that outlook--the Committee's "reaction function." My sense is that market participants and other members of the public focus instead mainly on the timing of the next policy change or on how many policy moves will occur in a given year. It also seems that the public may not fully appreciate the uncertainty that surrounds the outlook. In addition, market participants often say that there are too many voices saying too many different things about policy--the cacophony problem. The dot plot has been a poor predictor of the Committee's actual policy path, and some have questioned its usefulness. However, markets do not appear to be unusually uncertain about FOMC decisions.7
In theory, our communications about monetary policy can be roughly divided into those that express the consensus and those that show the diversity of views. Today I will focus on the latter. Specifically, are communications that illustrate the diversity of views about the likely policy path--particularly the dot plot and public commentary by FOMC participants other than the Chair--currently serving us well? And if not, how can we make improvements?
Questions of how much to say about the likely path of policy were extensively debated in the public sphere in the years leading up to the Bernanke era, and by the FOMC while Ben was Chairman.8 The benefits of greater transparency are typically thought to include more efficient pricing of financial assets and a closer alignment between the market's views and those of the Committee.9 Transparency should allow asset prices to respond immediately to incoming economic data, which would foster progress toward the Committee's objectives. Those who supported the publication of some form of policy rate path generally saw it as part of a forecast-based approach to policymaking, in which policy plans depend in a complex way on policymakers' outlooks, risk assessments, and objectives.10 The whole forward interest rate curve matters for financial conditions, not just the overnight rate. Monetary policy was therefore thought to be made more effective by communication of the full expected path of policy, which could then be incorporated into private-sector expectations and longer-term interest rates. But all along, there have been other voices urging caution and asking, in effect, "How much transparency is too much?" As Don Kohn noted in 2005 remarks, "more is not necessarily always better" when it comes to Fed communication.11 Critics have often argued that too much discussion of the likely path of policy could be taken as a commitment to a particular path and timing and could ultimately constrain the Committee from pursuing what it views to be the optimal path. Indeed, to the extent that the Committee's talk about the path of policy is given weight, that talk may leave "too little scope for private assessments of economic developments to show through" in market prices.12
Jon notes in his paper that communications about monetary policy generally received high marks from 2008 through early 2013, and he focuses his analysis on the challenging period since mid-2013. I am also going to skip over the years 2013-14, which included the "taper tantrum" and the relatively uneventful taper itself. I will focus instead on the years 2015-16, which seem to me to be the most relevant to the challenges the Committee faces today. I will pay particular attention to the dot plot, the cacophony issue, and the need to do a better job of explaining uncertainty.
The Dot Plot
The dot plot is not a consensus forecast of the Committee. Rather, the dots represent each individual participant's assessment of the appropriate policy path. The Committee considered the use of a consensus forecast in 2012 but abandoned the effort after struggling to reach agreement on its parameters.13
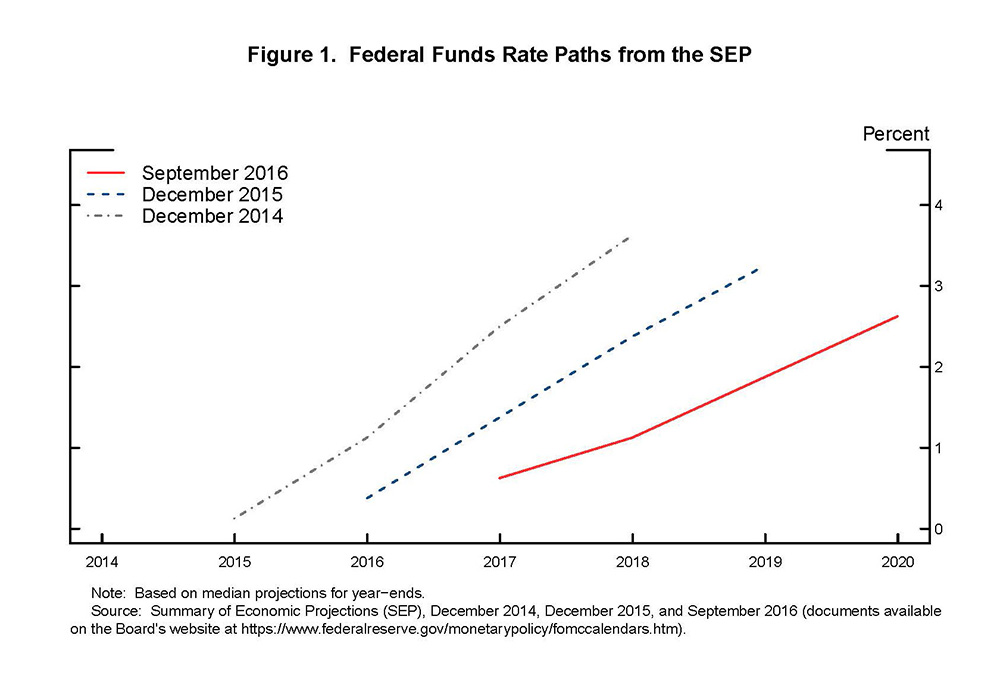
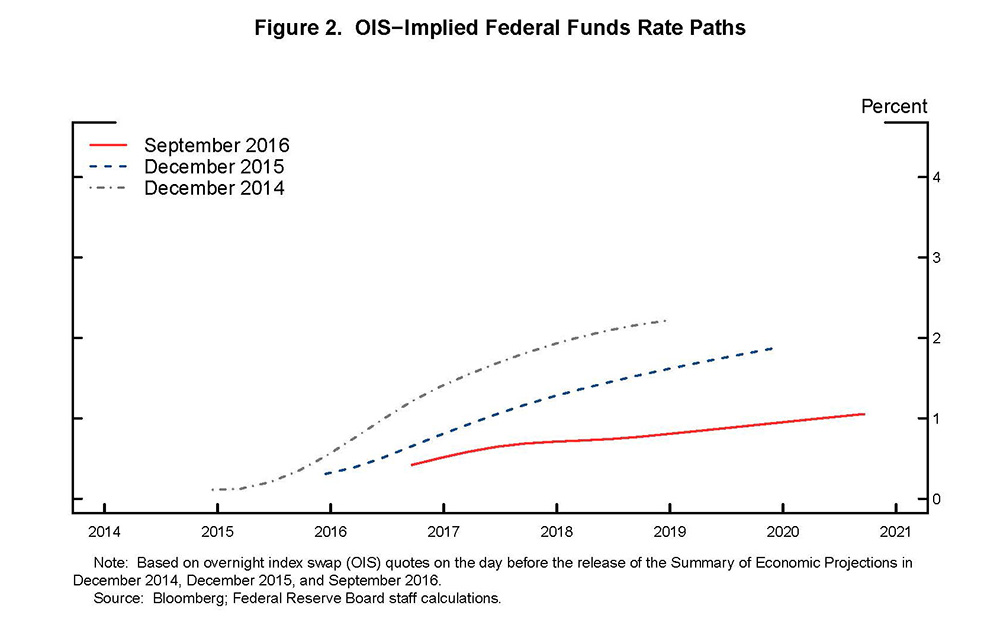
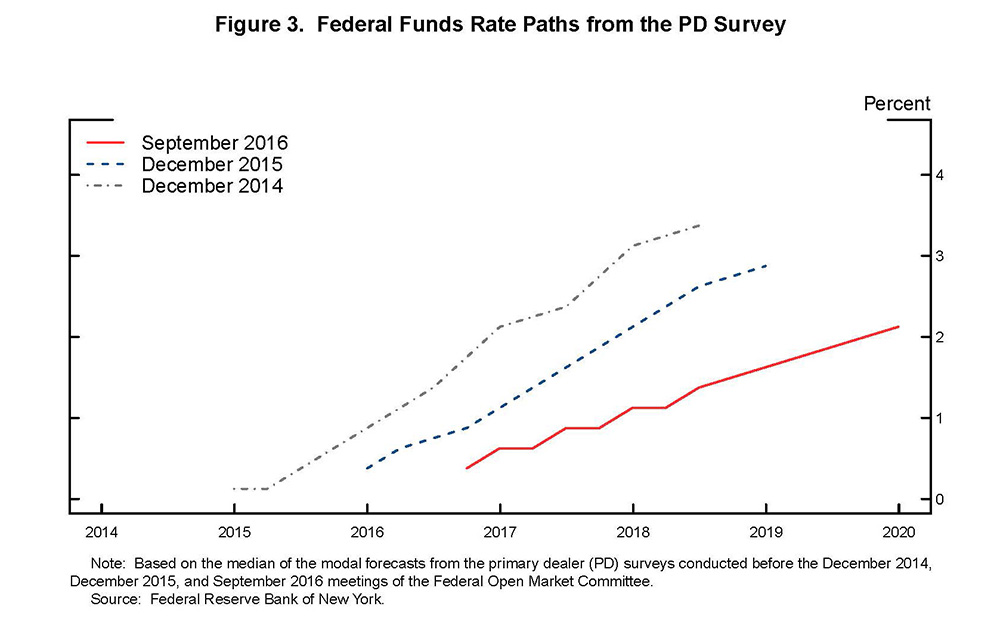
As you can see from figure 1, the median dots have moved down from SEP to SEP. The December 2014 SEP median dots showed increases of 350 basis points over the years 2015-2017. In the event, there was one 25 basis point rate increase in 2015, and the September 2016 SEP median shows one more in 2016 and two in 2017--for a total of 100 basis points. Figures 2 and 3 display rate expectations derived from financial market prices and forecasts made by financial market participants, respectively. These market paths have also declined significantly over the period. And the path estimated from overnight index swaps (figure 2) has been substantially below the SEP median. It does not appear that markets have uncritically accepted the dots, let alone taken them as a commitment.14
Some argue that the downward march of the dots has damaged the Committee's credibility. For me, the story is both more complicated and more interesting. Like Jon, I do not think of the dot plot as a useful predictor of near-term policy moves. But that is not to say that the dot plot is without value. Indeed, changes in the SEP and the dot plot over time have been quite revealing about the evolution of policymakers' views about the path of policy.
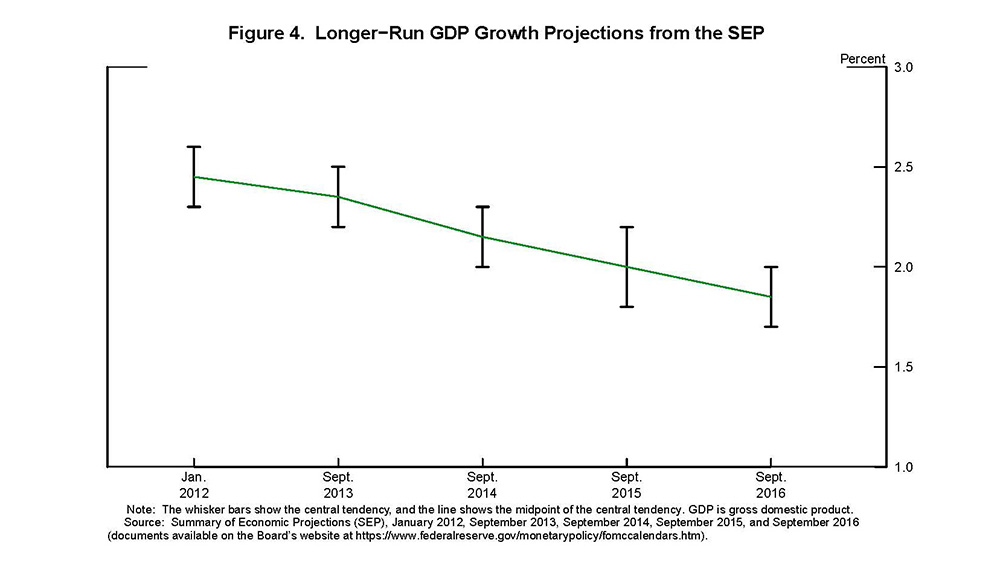
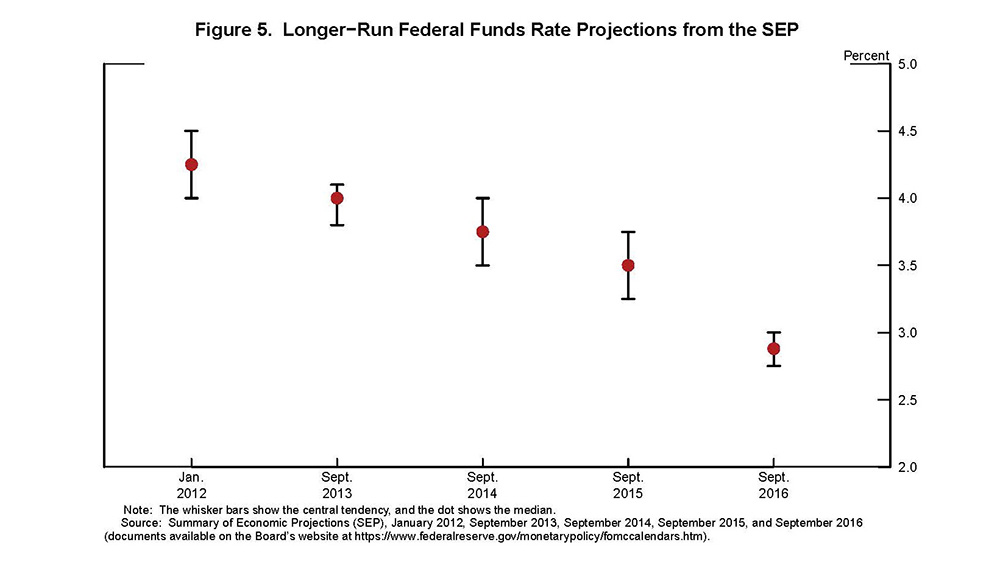
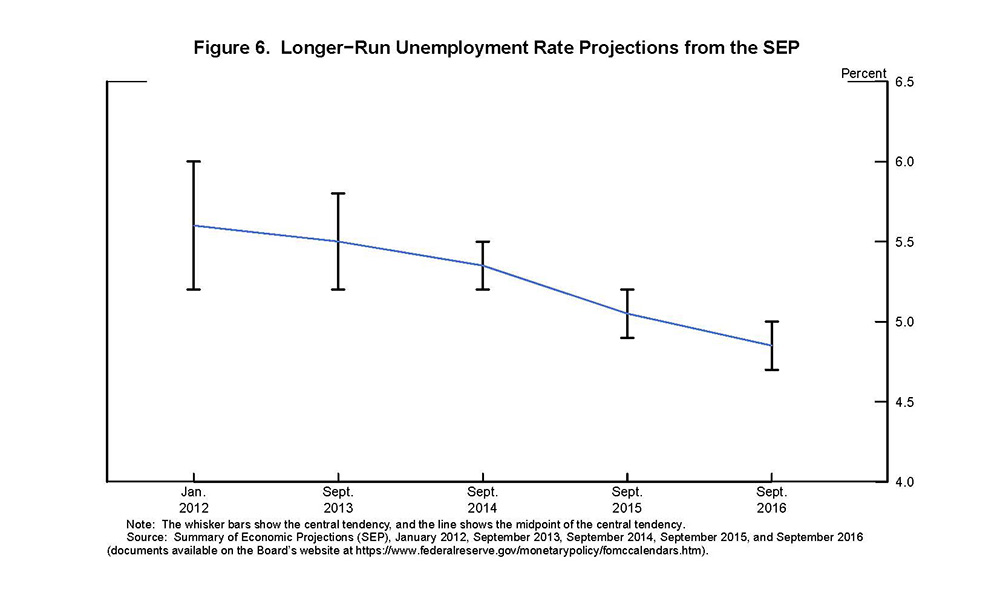
In recent years, FOMC participants have significantly revised their views about the values to which key economic variables will converge over the longer run. The same is true of many other economic forecasters. Since the beginning of 2012, participants' views about the longer-run annual growth potential of the economy have dropped from 2.45 percent to 1.85 percent (figure 4).15 Much of the downward revision in estimates of longer-run potential growth reflects the implications of demographic trends and the slowdown in productivity growth.16 These structural factors have also weighed on participants' assessments of the longer-run neutral federal funds rate--the rate that would be neither expansionary nor contractionary if the economy were operating near its potential.17 The median assessment of the longer-run neutral federal funds rate declined from 4.25 percent in 2012 to 2.90 percent in September of this year, with 60 basis points of that shift occurring just since September 2015 (figure 5). The persistence of low inflation despite faster-than-expected reductions in unemployment has also led participants to lower their estimates of the longer-run normal unemployment rate; the median estimate has declined from 5.60 percent in January 2012 to 4.85 percent in September 2016 (figure 6).
Taken together, these revisions explain a good part of the downward movement of the dots. One way to see that is through the application of a policy rule, such as a Taylor rule.18 Simple policy rules, as they are sometimes called, incorporate key factors for monetary policy, including the natural rate of unemployment, the neutral rate of interest, and deviations of inflation and unemployment from their long-run values. As they prepare for FOMC meetings, FOMC participants routinely see policy recommendations from a variety of rules, including several Taylor rule variations. While these rules are useful as benchmarks, in my view they should not be excessively relied on for policy decisions.19
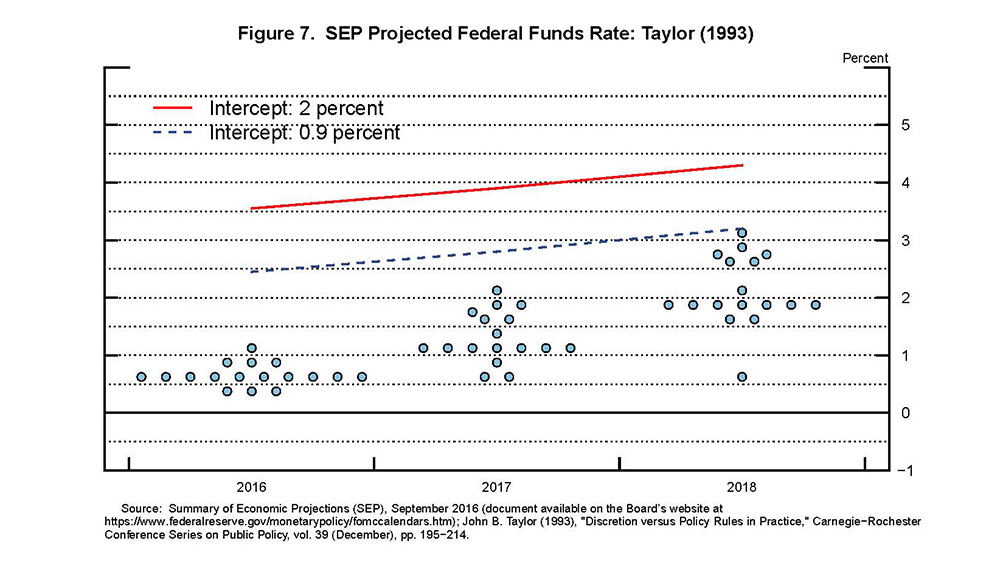
The red solid line in figure 7 shows the policy prescription using the original 1993 Taylor rule together with the September SEP dots for the federal funds rate.20 The Taylor rule prescription has been derived using the median value for core PCE price inflation, the unemployment rate, and the longer-run normal unemployment rate from the September 2016 SEP.
The intercept in this Taylor rule represents the longer-run real interest rate--or r*--which is set to 2 percent. If we replace that intercept with the median of the longer-run r* implied by the most recent SEP, which is 0.9 percent, we see that the rule prescribes much lower settings for policy interest rates than the unadjusted rule (the blue dashed line in figure 7). The lower intercept does not completely close the gap between the Taylor rule prescription and the dots. However, many observers believe that the neutral real interest rate is currently well below its longer-run value. The language that has appeared in the Committee's postmeeting statement since December 2015 that "the federal funds rate is likely to remain, for some time, below levels that are expected to prevail in the longer run" is consistent with this view.21
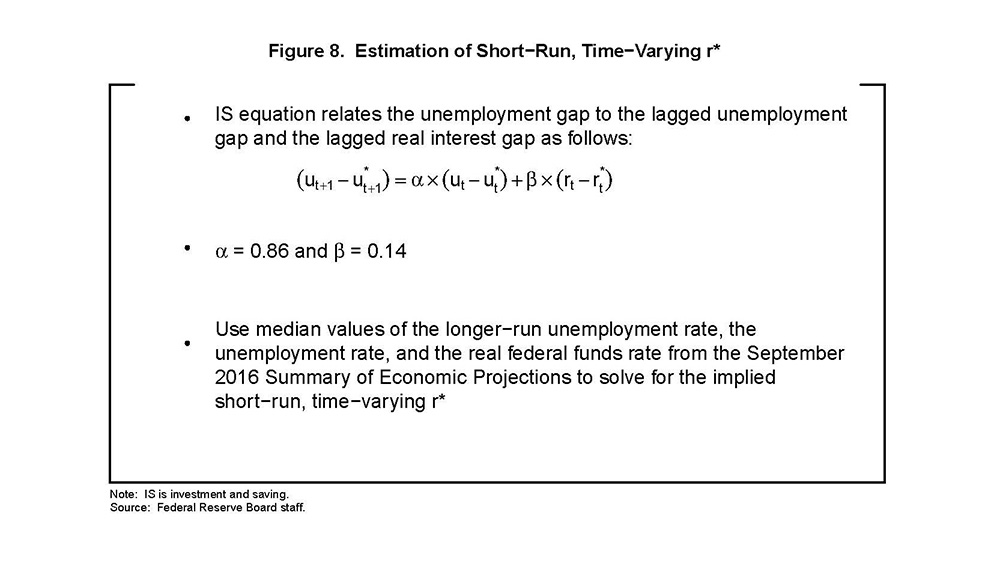
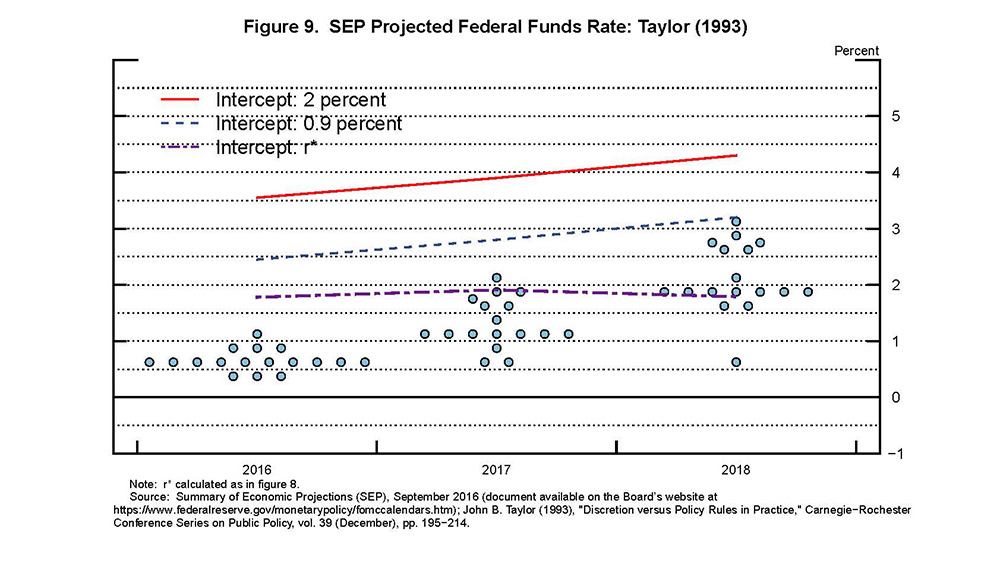
We can estimate a short-run, time-varying r* using a standard reduced-form IS (investment and saving) equation that relates the unemployment gap to its own lagged value and the lagged real interest rate gap. We use the median of FOMC participants' projections from the September SEP in this exercise. The IS specification employed here is similar to that used in Laubach-Williams (2003) and is shown in figure 8.22 Using these short-run, time-varying estimates of r* as intercepts in our Taylor rule gives us the purple dashed-dotted line in figure 9. This rule now tells us that the median dot remains slightly below the adjusted rule's prescription at the end of 2016 and 2017 but is back in line by the end of 2018.
As Don Kohn recently noted, "We have been in uncharted waters with unreliable anchors."23 The downward march of the dots shows that policymakers have been learning, and our understanding of the economy has been evolving, as we navigate the treacherous shoals of the post-crisis economy. The revisions in the longer-run values and the short-run, time-varying r* estimates provide a framework for understanding policymakers' evolving views of the economy and of appropriate monetary policy. And the dots for 2016 and 2017 lie below the purple dashed-dotted line in figure 9, showing that FOMC participants see an even more gradual path of rate increases than suggested by the short-run r* estimates. This lower path may be related to global economic weakness and risk-management considerations at the effective lower bound. Of course, all of this would have happened in the absence of an SEP or a dot plot. The new communications tools have made the process more transparent to the public. In this sense, the dot plot is more messenger than message.
Cacophony
I often hear that there are too many voices offering too much diversity of views about the likely path of policy--the cacophony problem. Reserve Bank Presidents and Governors are expected to publicly discuss their views on the economy and policy. Indeed, our policy on the external communications of FOMC participants states that "the Committee's public accountability is strengthened by open discussion of Committee participants' views about the economic outlook as well as their judgments about the appropriate course of monetary policy."24 Central banking often comes across as obscure and complicated, and we try to help the public understand what we do. But there is more to it than that. Jon Faust's paper captures well the framers' vision of an institutionalized diversity of perspectives. In my view, the public expression of our diverse views helps sustain public support for the Federal Reserve as a public institution. Those members of the public who disagree with our policy should know that their concerns are given voice in our deliberations. But there is a tradeoff here that needs to be managed: On the one hand, the effectiveness of policy is thought to depend on the public's understanding of the Committee's consensus. On the other hand, the expression of diverse views may sometimes make it difficult for the public to see that consensus.
Jon sees this public discussion about policy as mainly a form of negotiation. In my view, motivations are simpler and more obvious. Many of us enjoy getting out of the office to speak to outside groups. We appear to enjoy talking to print journalists, and some of us like going on television. With the proliferation of media of all kinds, there is a need for content, and we have been willing suppliers. In my view, these public appearances are mostly not about gaining leverage in a negotiation. There is a single FOMC participant who has most of the leverage in our policy discussions. Observers would be well advised to listen carefully to what she says.
I strongly agree with Jon that it is wise not to read too much about the path of policy into all of this communication. FOMC participants other than the Chair speak only for themselves and customarily make that clear at the beginning of their remarks. Their commentary is not intended to express the consensus or to predict its evolution.
As Jon notes, during the Greenspan era, there was very little discussion of the likely path for the policy rate by FOMC participants, including the Chairman. The proliferation of forward policy guidance during the crisis utterly broke that equilibrium. Many of us seem to be trained to a new habit, which is to offer one's views about the near-term path for policy, typically at the end of a speech on the outlook. While such communication can serve a useful purpose, I have come around to the view that focusing too much on the precise timing of policy moves may be adding to confusion and frustration about our communications. I am trying to avoid this problem in my own remarks.
Uncertainty
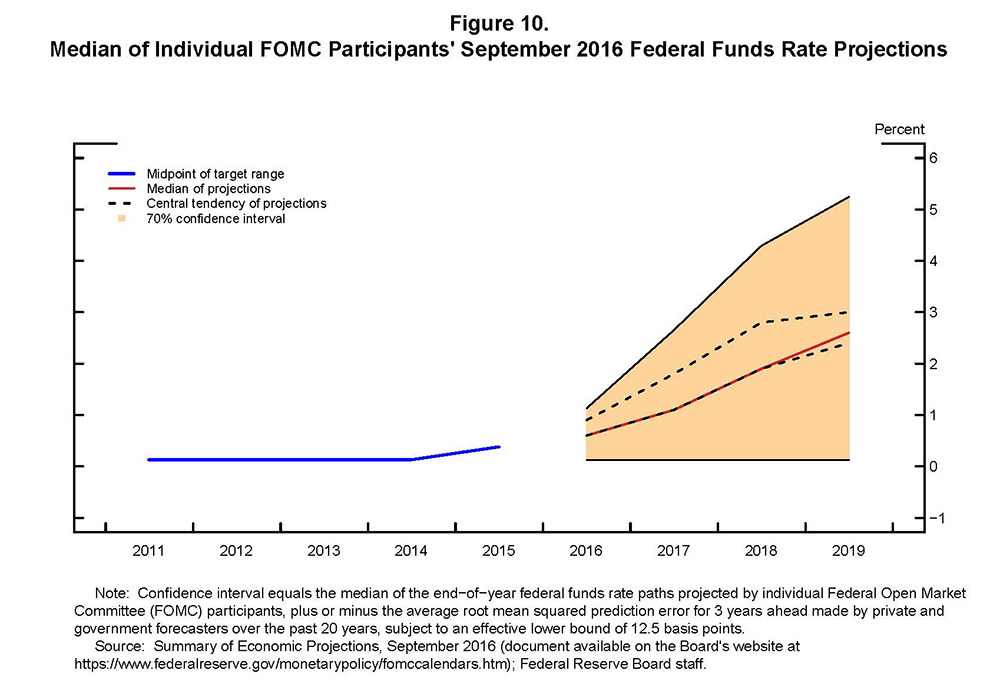
All economic forecasts are subject to considerable uncertainty. There is always a wide range of plausible outcomes for important economic variables, including the federal funds rate. In her remarks at Jackson Hole in August, Chair Yellen showed the median path for the federal funds rate from the June SEP surrounded by a 70 percent confidence interval based on the historical accuracy of private and government forecasts.25 I reproduce that figure here (figure 10), updated for the September 2016 SEP.26 Note that the tan confidence interval in the figure is much wider than the disparity of views as represented by the central tendency of the projections (the black dashed lines). This uncertainty is a fundamental aspect of our world, and it should probably feature more prominently in our communications.
Conclusion
To sum up, the FOMC and individual participants communicate a great deal these days--much more than in the past. Some of those communications are designed to express the consensus, and some are designed to show the diversity of views. In my view, communications should do more to emphasize the uncertainty that surrounds all economic forecasts, should downplay short-term tactical questions such as the timing of the next rate increase, and should focus the public's attention instead on the considerations that go into making policy across the range of plausible paths for the economy.
1. The views I express here are my own. Return to text
2. See Jon Faust (2016), "Oh, What a Tangled Web We Weave: Monetary Policy Transparency in Divisive Times," paper prepared for "Understanding Fedspeak," an event cosponsored by the Hutchins Center on Fiscal and Monetary Policy at the Brookings Institution and the Center for Financial Economics at Johns Hopkins University, held at the Brookings Institution, Washington, November 30. Return to text
3. For a review FOMC communications, see Mark A. Wynne (2013), "A Short History of FOMC Communication (PDF)," Economic Letter, vol. 8 (Dallas: Federal Reserve Bank of Dallas, September). Return to text
4. See Board of Governors of the Federal Reserve System (1994), FOMC statement, press release, February 4, paragraph 3. Return to text
5. The expedited release shortened the lag between an FOMC meeting and the publication of the meeting minutes between two and five weeks. See Deborah J. Danker and Matthew M. Luecke (2005), "Background on FOMC Meeting Minutes (PDF)," Federal Reserve Bulletin, vol. 91 (Spring), pp. 175-79. Return to text
6. The "dot plot" is a figure that provides individual policymaker assessments of appropriate monetary policy as defined by the value of the federal funds rate target or the midpoint of the federal funds rate target range at the end of each calendar year of the SEP forecast. Return to text
7. See, for example, David Mericle (2016), US Daily: The Fed and the Markets: A Failure to Communicate? (New York: Goldman Sachs, September 20). Return to text
8. See Alan S. Blinder, Michael Ehrmann, Marcel Fratzscher, Jakob De Haan, and David-Jan Jansen (2008), "Central Bank Communication and Monetary Policy: A Survey of Theory and Evidence," Journal of Economic Literature, vol. 46 (December), pp. 910-45. Return to text
9. See Ben S. Bernanke (2004), "Central Bank Talk and Monetary Policy," speech delivered at the Japan Society Corporate Luncheon, New York, October 7. Return to text
10. See Ben S. Bernanke (2004), "The Logic of Monetary Policy," speech delivered at the National Economists Club, Washington, December 2. Return to text
11. See Donald L. Kohn (2005), "Central Bank Communication," speech delivered at the Annual Meeting of the American Economic Association, Philadelphia, January 9, paragraph 5. Return to text
12. Quote taken from Kohn, "Central Bank Communication," paragraph 12, in note 10. This point has been emphasized in work by Stephen Morris and Hyun Shin. See, for example, Jeffery D. Amato, Stephen Morris, and Hyun Song Shin (2002), "Communication and Monetary Policy," Oxford Review of Economic Policy, vol. 18 (December), pp. 495-503. Return to text
13. According to the minutes from the October 22-23, 2012, FOMC meeting, "In their discussion, participants agreed that FOMC communications could be enhanced by clarifying the linkage between participants' economic forecasts, including the underlying policy assumptions, and the Committee's policy decision as expressed in the postmeeting statement. However, most participants judged that, given the diversity of their views about the economy's structure and dynamics, it would be difficult for the Committee to agree on a fully specified longer-term path for monetary policy to incorporate into a quantitative consensus forecast in a timely manner, especially under present conditions in which the policy decision comprises several elements." See Board of Governors of the Federal Reserve System (2012), "Minutes of the Federal Open Market Committee, October 23-24, 2012," press release, November 14, paragraph 52. Return to text
14. The expected policy rate paths shown in figures 1, 2, and 3 are not entirely comparable. The SEP paths are median values of the modal projections of individual participants for the end of the calendar year. The overnight index swap (OIS) paths are estimated using a spline approach; each line corresponds to the estimated path on the day before the release of SEP projections. OIS paths are mean forecasts of market participants and may be influenced by variations in risk premiums over time. The primary dealer survey paths are medians of modal forecasts, and the survey responses are collected about a week before the SEP projections are released. Return to text
15. Other forecasters--for instance, Blue Chip and the Survey of Professional Forecasters--have also revised down their estimates for longer-run real gross domestic product (GDP) growth. See Jerome H. Powell (2016), "Recent Economic Developments, the Productive Potential of the Economy, and Monetary Policy," speech delivered at the Peterson Institute for International Economics, Washington, May 26. In making these comparisons, I use the midpoint of the central tendency for real GDP growth and the unemployment rate. Return to text
16. See John G. Fernald (2015), "Productivity and Potential Output before, during, and after the Great Recession," in Jonathan A. Parker and Michael Woodford, eds., NBER Macroeconomics Annual 2014, vol. 29 (Chicago: University of Chicago Press), pp. 1-51; and Etienne Gagnon, Benjamin K. Johannsen, and David Lopez-Salido (2016), "Understanding the New Normal: The Role of Demographics (PDF)," Finance and Economics Discussion Series 2016-080 (Washington: Board of Governors of the Federal Reserve System, October). Return to text
17. For further discussion of the neutral nominal federal funds rate, see Janet L. Yellen (2015), "The Economic Outlook and Monetary Policy," speech delivered at the Economic Club of Washington, Washington, December 2. Return to text
18. See Fernanda Nechio and Glenn D. Rudebusch (2016), "Has the Fed Fallen behind the Curve This Year? " FRBSF Economic Letter 2016-33 (San Francisco: Federal Reserve Bank of San Francisco, November). Return to text
19. For example, FRB/US simulations using the Taylor (1993) rule for the period 2010-15 show substantially higher unemployment and lower inflation than was actually realized. For more information about the Taylor (1993) rule, see John B. Taylor (1993), "Discretion versus Policy Rules in Practice," Carnegie-Rochester Conference Series on Public Policy, vol. 39 (December), pp. 195-214. Return to text
20. The SEP policy projections are for the midpoint of the federal funds rate target range at the end of a calendar year. The Taylor (1993) rule is defined as Rt = 2 + πt + 0.5(πt – 2) + 0.5Yt. In this expression, R is the federal funds rate, π is the percent change in the core PCE price index from four quarters earlier, and Y is the output gap. The rule used here is in terms of the unemployment gap instead of the output gap. The output gap is approximated using Okun's law; specifically, Yt = 2.0(U* – Ut), where U is the unemployment rate and U* is the non-accelerating inflation rate of unemployment, or NAIRU. Return to text
21. See, for example, Board of Governors of the Federal Reserve System (2016), "Federal Reserve Issues FOMC Statement," press release, November 2, paragraph 4. Return to text
22. For a discussion of the short-run, time-varying estimates of r* using projections from the SEP, see Michelle Bongard and Benjamin K. Johannsen (2016), "The Neutral Rate and the Summary of Economic Projections," FEDS Notes (Washington: Board of Governors of the Federal Reserve System, November 28). These authors combine the IS specification used here with SEP projections to calculate implied values for r*. See also Thomas Laubach and John C. Williams (2003), "Measuring the Natural Rate of Interest," Review of Economics and Statistics, vol. 85 (November), pp. 1063-70. Return to text
23. See Donald Kohn (2016), "How Should Central Bankers Talk about Future Monetary Policy? Lessons from the Crisis and Beyond (PDF) ," (Washington: Hutchins Center on Fiscal and Monetary Policy, Brookings Institution, November). Return to text
24. The FOMC Policy on External Communications of Committee Participants was adopted in June 2011 and is available on the Board's website at https://www.federalreserve.gov/monetarypolicy/files/FOMC_ExtCommunicationParticipants.pdf; for the quoted text, see p. 1. Return to text
25. The reason for the confidence interval is that the economy is frequently buffeted by shocks and thus rarely evolves as predicted. See Janet L. Yellen (2016), "The Federal Reserve's Monetary Policy Toolkit: Past, Present, and Future," speech delivered at "Designing Resilient Monetary Policy Frameworks for the Future," a symposium sponsored by the Federal Reserve Bank of Kansas City, held in Jackson Hole, Wyo., August 26. Return to text
26. The confidence interval equals the median SEP path for the federal funds rate plus or minus average root mean squared prediction errors of the three-month Treasury bill rate (subject to a lower bound of 12.5 basis points), for horizons from zero to three years ahead, based on forecast errors made over the past 20 years. For general information on the methodology used to construct confidence intervals using historical forecasting errors, see David Reifschneider and Peter Tulip (2007), "Gauging the Uncertainty of the Economic Outlook from Historical Forecasting Errors ," Finance and Economics Discussion Series 2007-60 (Washington: Board of Governors of the Federal Reserve System, November). Return to text