October 12, 2017
Prospects for Emerging Market Economies in a Normalizing Global Economy
At the 2017 Annual Membership Meeting of the Institute of International Finance, Washington, D.C.
Thank you for inviting me to speak here at the Institute of International Finance Annual Membership meeting. I am pleased to note that there have been signs lately that a sustainable global recovery may finally be materializing. This is certainly good news, although significant risks and uncertainties remain. One important question is how the emerging market economies (EMEs) will fare as global monetary conditions normalize. In our intertwined world, prospects for these economies are a significant driver of prospects for the United States and other advanced economies. In my remarks today I will argue that, despite the risks and uncertainties, EMEs are likely to manage that normalization reasonably well.
As many observers have noted, EME economic prospects are strongly linked to the evolution of capital flows.1 Accordingly, I will first review the recent rebound in EME capital inflows and analyze the drivers of this rebound. Against this backdrop, I will then discuss how the prospects for EMEs depend on three factors: Vulnerabilities in the EMEs themselves; the evolution of advanced-economy monetary conditions, including those in the United States; and market responses to that evolution. As always, my comments here represent my own views.
The Rebound in Economic Growth and Capital Flows in Emerging Markets
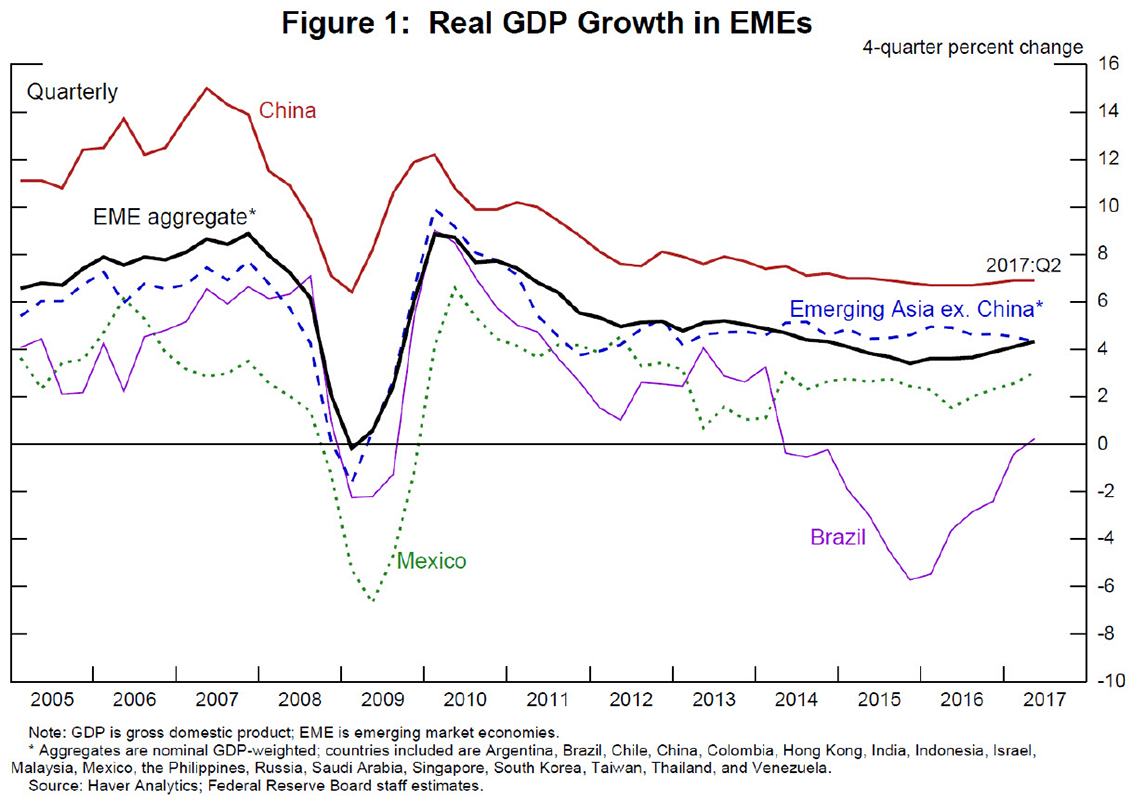
After real GDP growth plummeted in many EMEs during the Global Financial Crisis (GFC), economic activity rebounded sharply (slide 1). But that recovery proved to be short lived and was followed by a notable, widespread fall in EME growth as advanced economies remained sluggish, economic imbalances in China mounted, and commodity prices plunged. Lately, however, the streak of weak growth in the EMEs appears to have been broken: The downward trend in Chinese growth has flattened, growth in other EMEs has picked up some, and Brazil seems to be moving into recovery mode. The factors that underlie the pickup in EMEs to a large extent represent a reversal of developments that led to the slowing. The improvement in the performance of the advanced economies has become more widespread. Chinese authorities have bolstered their economy by providing more credit stimulus. And commodity prices have bounced back from their lows in early 2016, bolstering activity and allaying financial stability concerns in commodity-exporting economies. These developments have also contributed to a modest reversal of the slowdown in global trade seen in recent years.2
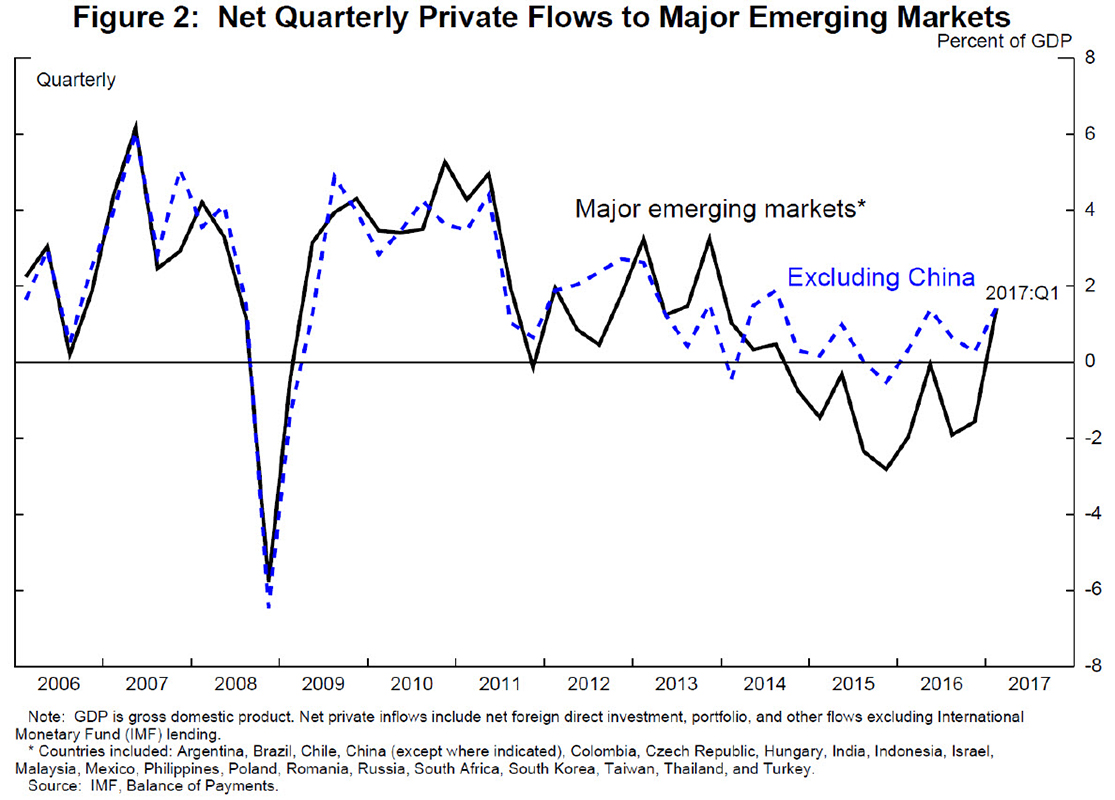
A rebound in capital flows has come along with the pickup in economic performance in the EMEs. Slide 2 shows net private capital flows to EMEs--the difference between gross private inflows and gross private outflows. These private net inflows are quite volatile, as the experience of the past 10 years shows. Strong pre-GFC net inflows to major emerging markets (the black line)--hovering in the neighborhood of 3 to 4 percent of EME gross domestic product (GDP)--were interrupted by a collapse during the crisis, but inflows quickly recovered and stayed strong through 2010. After that, net inflows trended down for several years and turned negative by 2015. Part of this retrenchment reflected Chinese net inflows turning into net outflows due to what might be considered special circumstances--notably, changes in expectations of Chinese exchange rate policy. But even taking China out of the picture, as shown by the dashed blue line, there was a clear downward trend in net inflows.
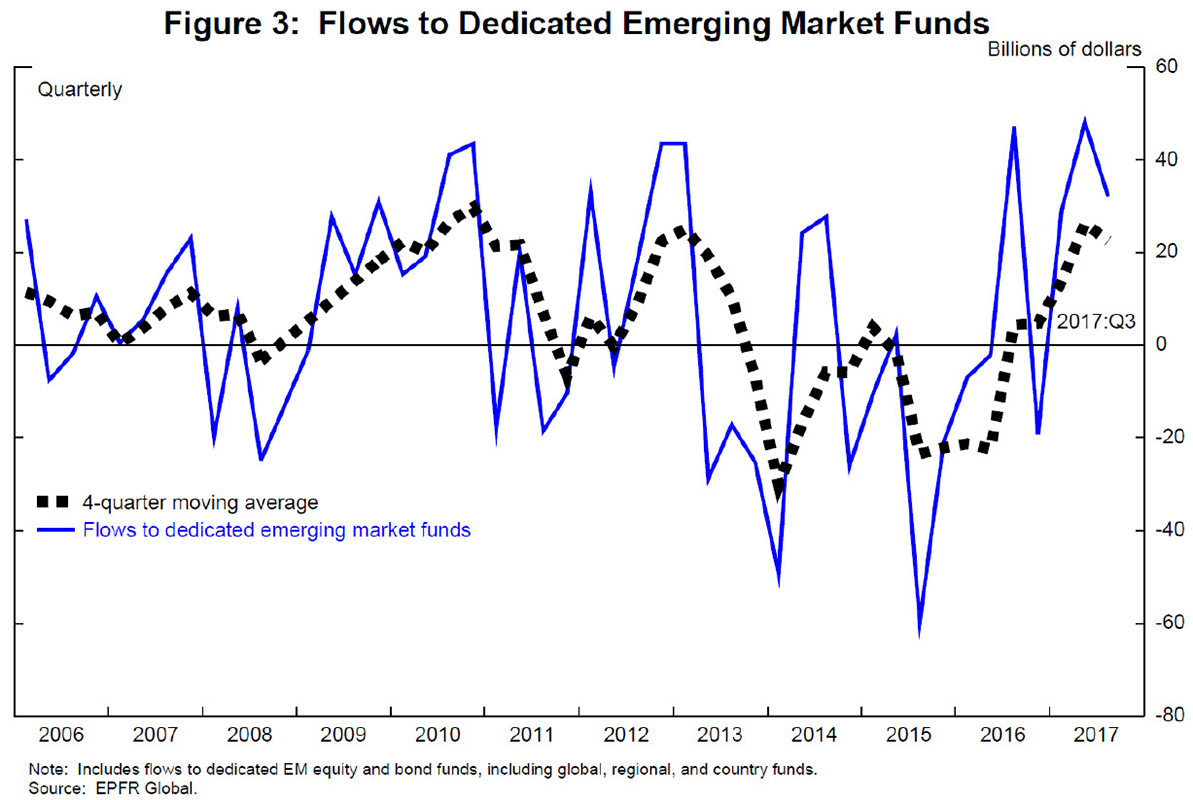
Over the past couple of years, however, net inflows have recovered and have averaged, if China is excluded, 0.7 percent of GDP in 2016 and about 1-1/2 percent of GDP in early 2017. As shown in slide 3, other measures of capital flows, such as flows into EME investment funds, show an even sharper rebound.
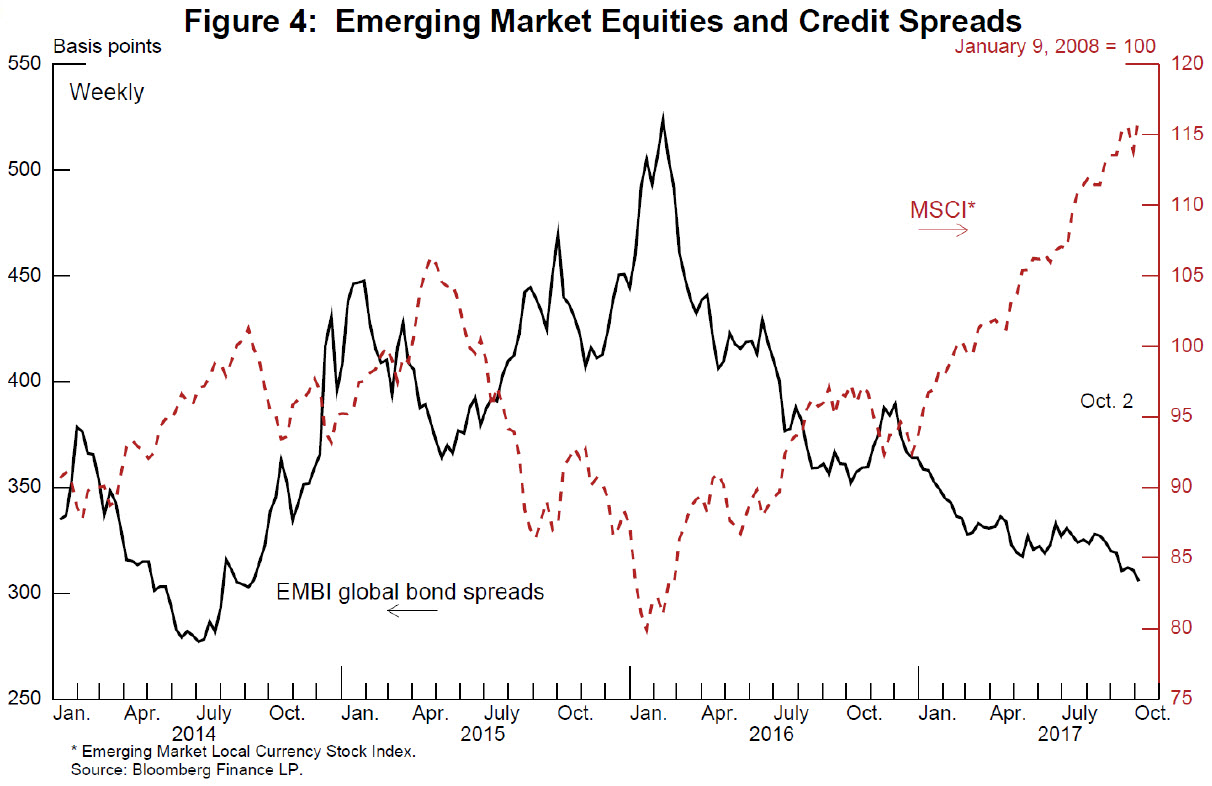
The recent recovery of investor appetite for EME exposure has shown up in asset prices as well. Emerging-market credit spreads have declined, and equity prices have risen (slide 4). These developments are not occurring in isolation, but in the context of a general improvement in the global outlook and in investor risk sentiment. The improvement in economic fundamentals raises the following question: To what extent can the recent recovery in EME capital flows be explained by these better economic fundamentals?
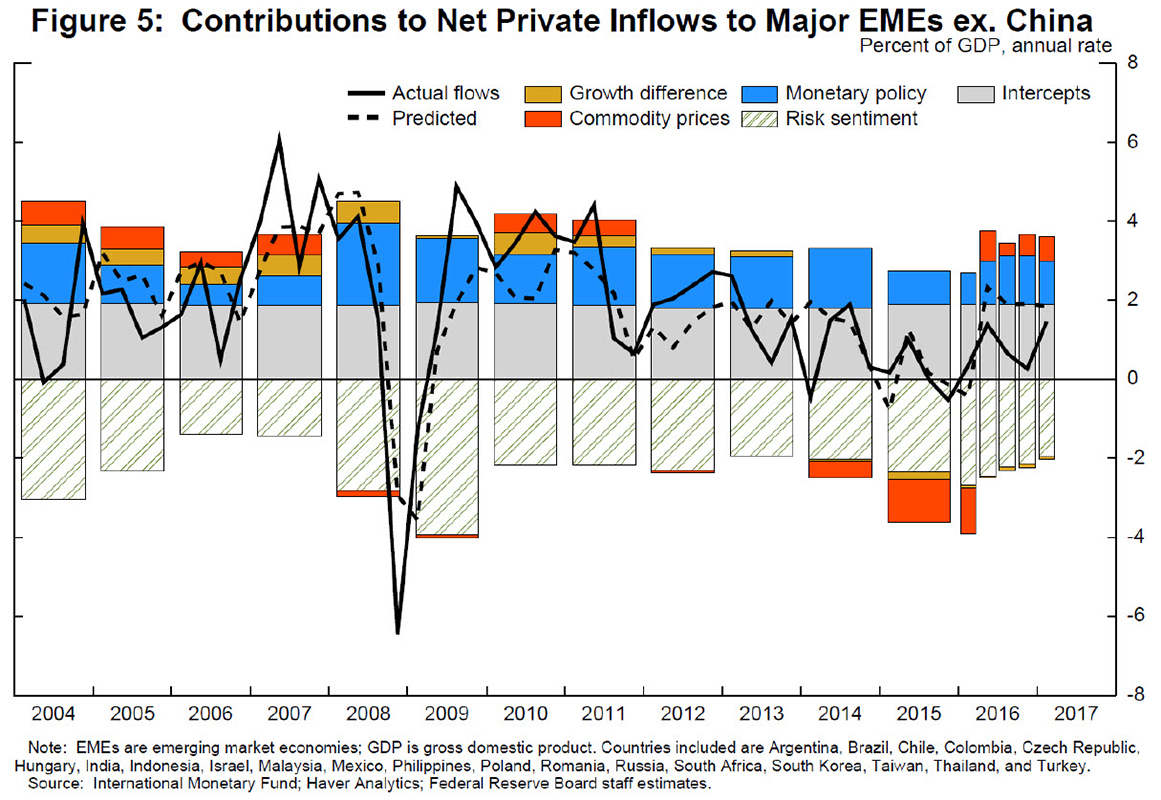
One way to shed light on this question is to compare the recent behavior of EME capital flows with what we might expect from a model of these flows based on historical data. In a recent study, Federal Reserve staff regressed net private capital inflows into several key EMEs on measures of investment opportunities in these economies, monetary policy variables, and risk sentiment variables.3 As can be seen in slide 5, by comparing the solid and dashed lines, the model does a fairly good job overall of fitting the data.
It is instructive to look at what the model tells us about the slowing of flows between 2010 and 2015. Note that the falloff in commodity prices (the red portion of the bars) was the largest contributor to the slowdown in flows. The decline in economic growth differentials between the EMEs and advanced economies (the yellow portions) was also a major contributor. In fact, growth differentials became a slightly negative contributor in 2015 after being substantially positive in 2010.4 Monetary policies (the blue portions) also became less of a factor in 2015 in driving flows to EMEs.
As for the recent rebound in flows, over the past year the model's predicted net inflows (the dashed line) have actually been significantly above actual net inflows (the solid line), suggesting that there is some room for flows to increase further without raising concerns. The model attributes the recovery of flows primarily to the turnaround in commodity prices and, to a substantially lesser extent, to improvements in risk sentiment (as seen by some waning of the negative contribution from the slashed green bars). The growth differential is not playing a major role because the rise in EME growth has been accompanied by a rise in advanced-economy growth.5
All in all, this evidence suggests that the recent pickup of capital flows to EMEs has not outrun its fundamental determinants, which provides some encouragement that these flows will not reverse themselves and endanger EME prospects, a situation that is also encouraging for U.S. prospects.
Risks to Emerging Market Economy Prospects from the Future Course of Monetary Policy
Some observers have noted that the risk of a reversal of EME capital flows may become more pronounced as U.S. and global interest rates return to more normal levels. These developments could encourage capital to return to the advanced economies and, by raising domestic interest rates and putting downward pressures on emerging market currencies, could also enlarge EME debt burdens. In assessing this risk, as I mentioned earlier, three elements are important: first, the vulnerabilities in the EMEs themselves; second, the evolution of advanced-economy monetary policies; and, third, how markets might respond to that evolution. Let me discuss each of these elements in turn.
Emerging Market Economy Vulnerabilities
There is clear empirical evidence that the response of EME financial markets to different shocks, including changes in U.S. interest rates, depends importantly on the state of economic fundamentals in the EMEs themselves. For example, Bowman and coauthors document in their study that a deterioration in a country's economic conditions significantly increases its vulnerability to adverse effects from changes in U.S. interest rates.6 A case in point is the so-called taper tantrum in 2013, when rises in sovereign bond spreads were significantly greater in those EMEs with greater relative vulnerabilities.
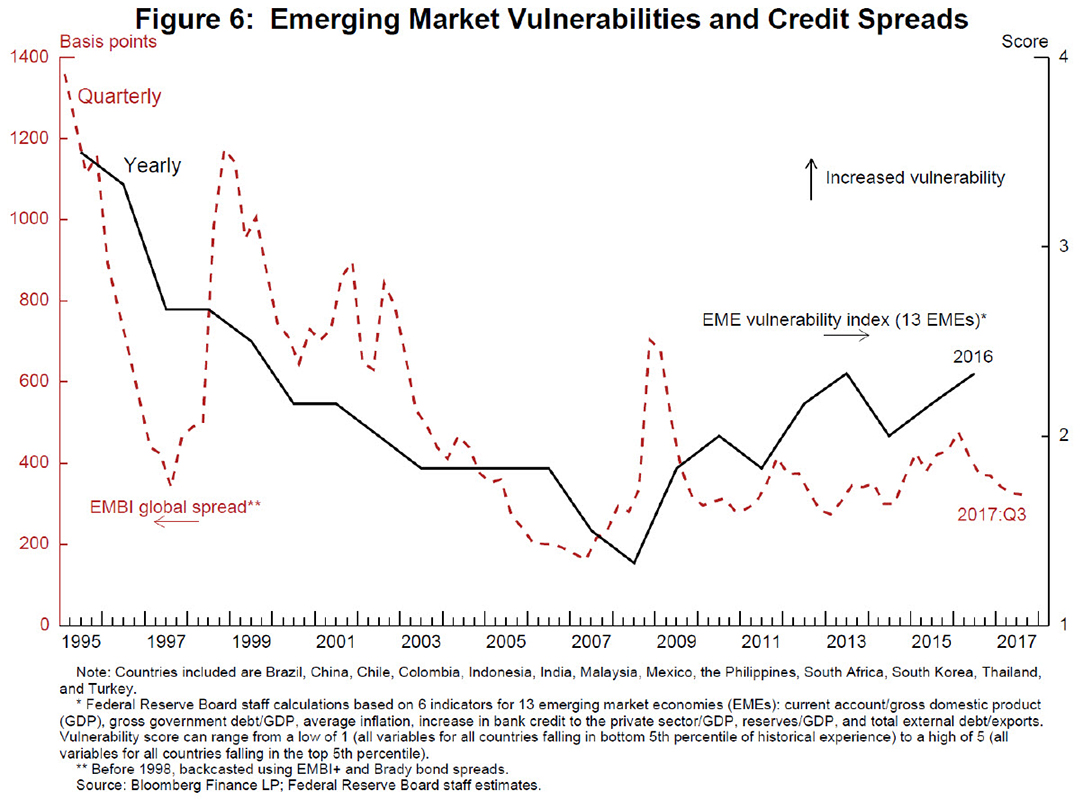
There is little doubt that over the past couple of decades, EME macroeconomic fundamentals and policy frameworks have improved substantially. One way you can see this improvement is through an index of aggregate EME vulnerability (the black line in slide 6), which is based economic data on a variety of variables from 13 major economies.7 According to this index, EME vulnerabilities today stand well below those in the 1990s--a period during which financial crises in EMEs were much more prevalent.
That said, the vulnerability index has been trending up since 2008. Part of this increase in the vulnerability index can be attributed to a run-up in bank credit to the private sector, which brings me to a key risk for EME prospects: the position of EME corporates. Observers have been expressing concerns about the mounting levels of corporate debt and the risk that a normalization of global conditions could exacerbate debt service burdens of EME corporations--particularly those with elevated levels of dollar-denominated debt--by raising global interest rates, boosting the value of the dollar, and perhaps damping economic activity. Given the prominence of this risk, I will discuss EME corporates in a bit more detail.
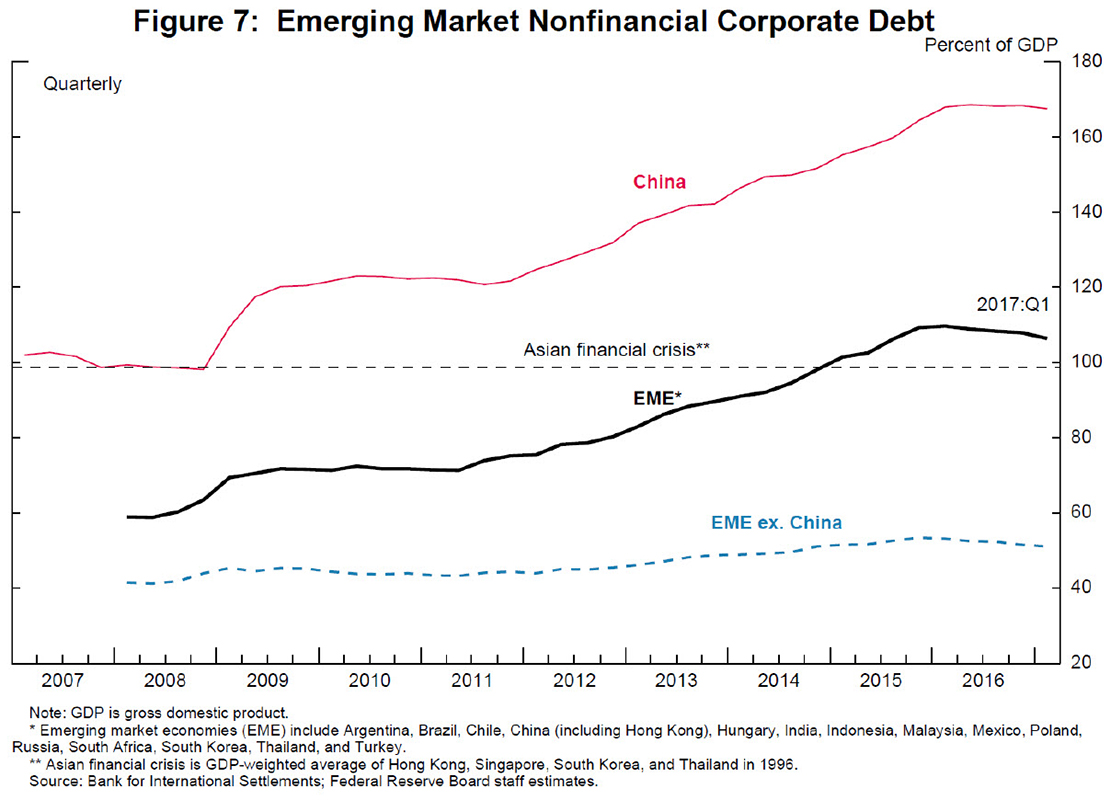
Since 2008, the debt of EME nonfinancial corporations has tripled in dollar value, reaching roughly $27 trillion in the first quarter of 2017. As a share of GDP, as shown by the black line in slide 7, it has nearly doubled, to over 100 percent of GDP. China's situation is distinct from many other EMEs. On the one hand, as can be seen by the red line, its corporate debt, at 170 percent of GDP now, is much higher than most other EMEs and substantially above the level we saw in East Asia before the Asian crisis. On the other hand, Chinese corporates are much less exposed to changes in exchange rates and global interest rates.
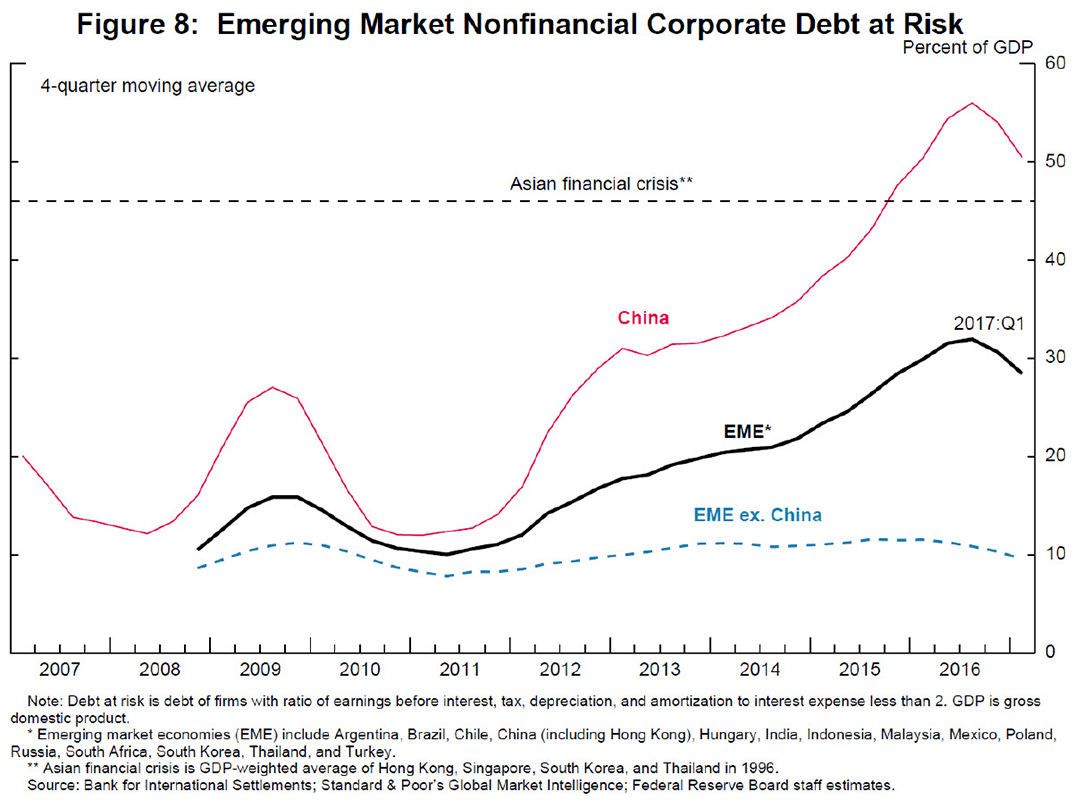
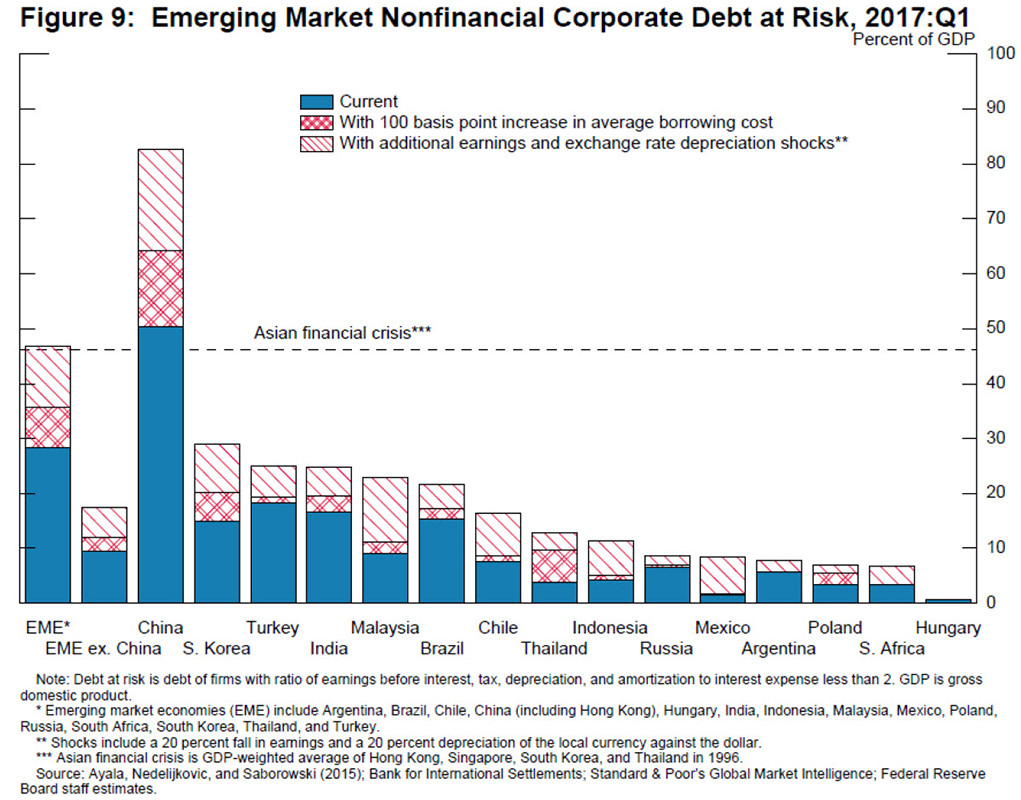
But the rising amount of debt by itself does not tell us whether this debt is excessive and how vulnerable EME corporates are to global monetary and market shocks. For that assessment we need to drill down deeper into the health of the corporate sector. In a recent study, Beltran and coauthors undertake such an analysis using a common metric of debt service capacity--the interest coverage ratio, or ICR, which is the ratio of earnings to interest expense.8 All else being equal, this ratio is lower for firms that are less profitable, more leveraged, and have a higher cost of borrowing. Using firm-level data, the authors classify the debt of those firms with an ICR of less than 2 as "debt-at-risk."9 They find, as shown by the black line in slide 8, that this measure of risky EME corporate debt has almost tripled since 2011 to about 30 percent of GDP. But this share is still considerably lower than the 46 percent of GDP debt-at-risk in East Asia on the eve of the Asian crisis (the horizontal dashed black line in the chart). For China, though, the debt-at-risk now exceeds what we saw in East Asia before the Asian crisis. Outside of China (the dashed blue line), EME debt-at-risk, at about 10 percent of GDP, seems much more manageable. However, as can be seen by the blue portions of the bars in slide 9, debt-at-risk in a number of EMEs, including South Korea, India, Turkey, and Brazil exceeds that average level.
How will EME corporate debt fare going forward as global normalization proceeds? The results of the study I just discussed imply that a 1 percentage point increase in EME corporate borrowing costs by itself would not be so problematic, at least outside of China.10 What this shock would do to debt-at-risk is shown by the red cross‑hatched portions of the bars in the chart. But it would be a bigger deal if the rise in borrowing costs was accompanied by a more generalized adverse turn of events in EMEs, modeled here as a 20 percent earnings reduction and a 20 percent hit to the value of EME currencies against the dollar. The estimated effects of these additional shocks on debt-at-risk are shown by the slashed red portions of the bars.11 In this case, aggregate EME debt-at-risk rises from about 30 percent of GDP to around the level seen prior to the Asian financial crisis.12 Notably, the increase comes mainly from China, where debt‑at‑risk jumps to about 85 percent of GDP. Outside of China, risky debt also rises substantially but seemingly not to levels that would be considered unmanageable.
Overall, based on this analysis, I would conclude that corporate debt represents a moderate degree of vulnerability for EME prospects. The situation is not alarming, but risks are significant and bear close watching, especially in China.
The Evolution of Federal Reserve Policy
What of the evolution of monetary conditions in the advanced economies? I will confine myself here to Fed policy. One factor that favors easier adjustment in EMEs is that U.S. monetary policy normalization has been and should continue to be gradual, as long as the U.S. economy evolves roughly as expected.
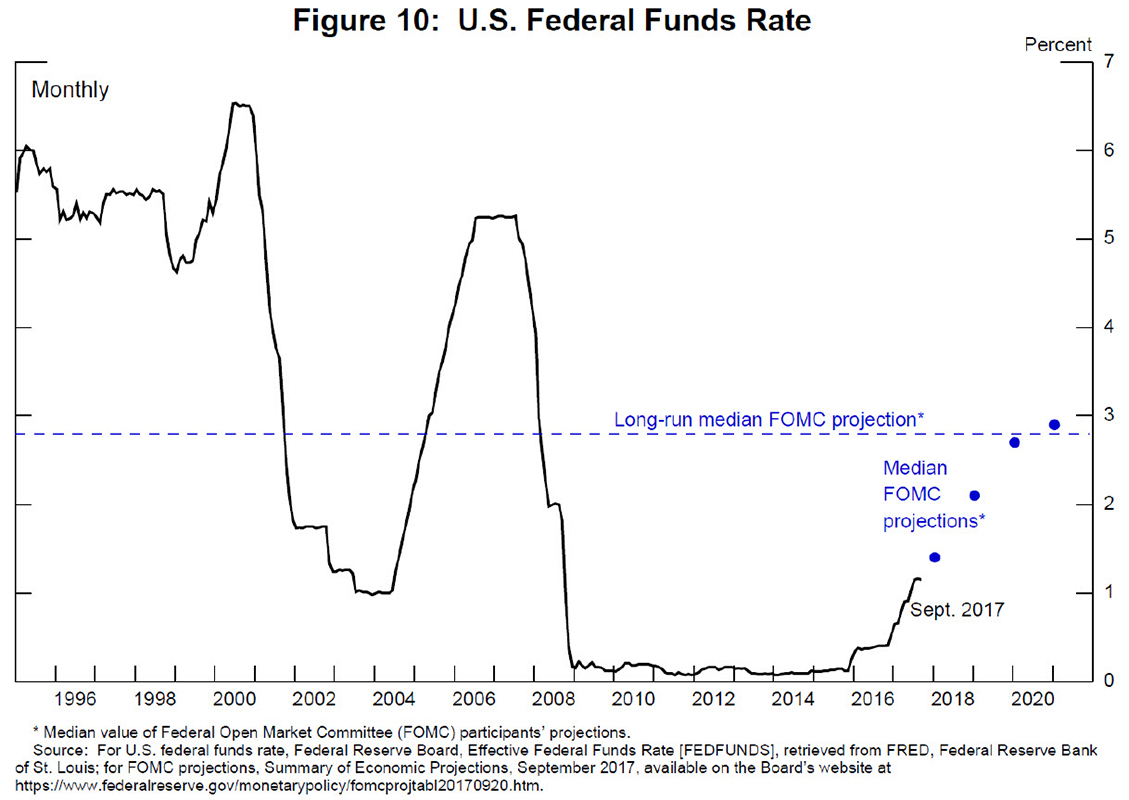
Since the start of normalization in December 2015, the federal funds rate has risen to about 1‑1/4 percent from its effective lower bound (slide 10). The median projections of Federal Open Market Committee (FOMC) participants (the blue dots) have it rising to 2.9 percent by the end of 2020, fairly close to what is regarded by the median participant as its long-run value and significantly below its average value in the years prior to the GFC. As reflected in the FOMC's recent communications, the shrinkage of the Fed's balance sheet is also expected to proceed quite gradually, with slowly phased-in increases in caps on the monthly reductions in the Federal Reserve's security holdings.
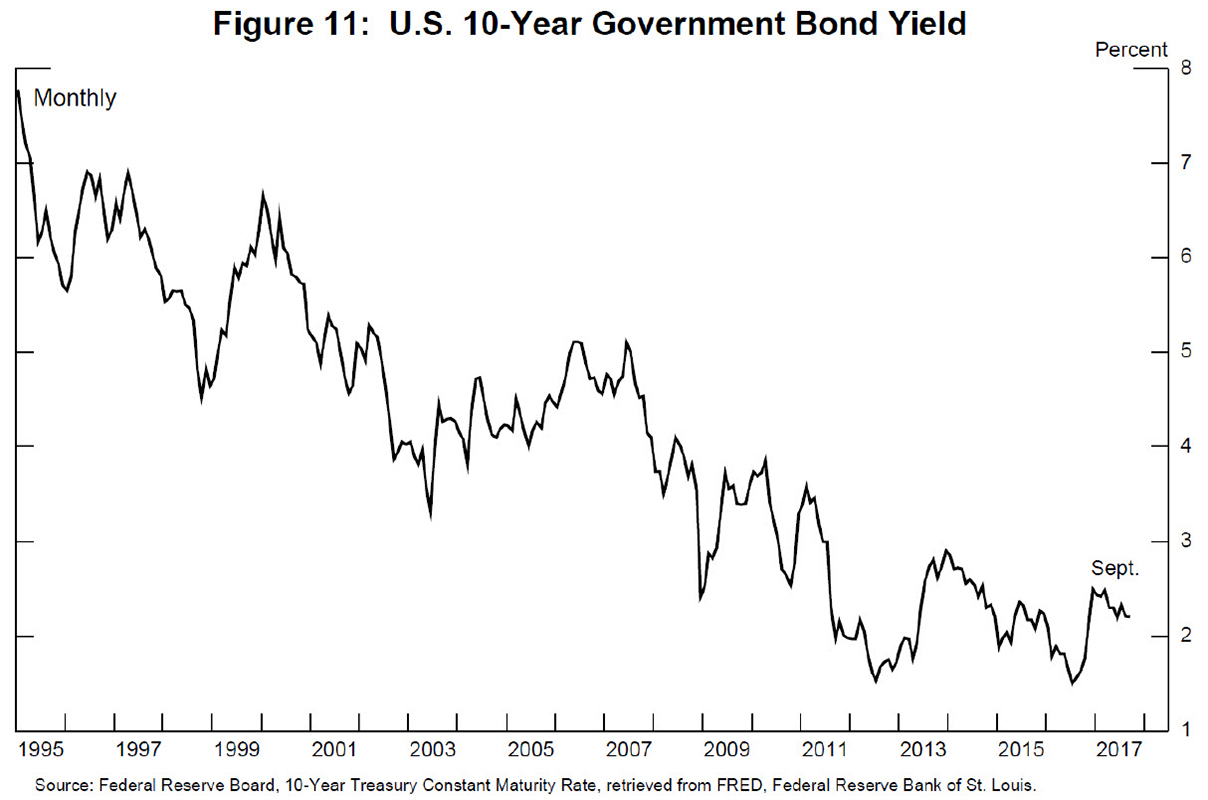
The expectation of gradual policy normalization should reduce the likelihood of outsized movements in interest rates. Indeed, even if we add, say, a 50 basis point term premium to the expected long-run federal funds rate, this value would still leave long-term U.S. interest rates (shown in slide 11) well below their pre-GFC averages. As long as global financial conditions normalize in an orderly fashion, EMEs should have sufficient time to adjust. And, as we saw earlier, interest rate changes of this magnitude should not lead to generalized corporate distress in EMEs, although undoubtedly some corporates are more exposed and could experience difficulties.
Market Response
All that said, market movements can be noisy, which brings me to what I believe is the most uncertain element--the potentially volatile behavior of markets even in an environment of relatively contained EME vulnerabilities and of gradual and clearly communicated advanced-economy monetary policies.
So far, markets have behaved in a manner consistent with a relatively benign scenario for EMEs: Risk sentiment is holding up, credit spreads in emerging markets have been declining, equities are up, long-term yields have hardly budged, and the dollar has been declining. Markets, however, can turn on a dime, and reactions can be outsized. This concern may be especially relevant at present, given the low level of volatility and elevated asset prices in global markets, which may increase the likelihood and severity of an adjustment.
Most of the time bouts of market turbulence lead to relatively quick corrections that leave markets more resilient without substantially depressing global growth. The taper tantrum of 2013 that I mentioned earlier is a good example. Ultimately, the policy adjustments made by some of the most affected economies, along with the more realistic appraisal of risks by global investors, likely left the global economy in a somewhat better position than before the episode. That said, however, market tantrums pose complex economic and financial challenges, and such episodes carry a significant risk of snowballing into something bigger that more substantially threatens the economic expansion.
Conclusion
To conclude, I have suggested that the most likely outcome is that the challenges posed to EMEs by the normalization of global financial conditions will be manageable.13 So far, capital flows have been moving in line with market fundamentals. Although, EME vulnerabilities have been rising, they are still well below the levels of the crisis-prone years of the 1980s and 1990s. Global monetary conditions are expected to normalize only gradually, as the Federal Reserve and other advanced-economy central banks continue to stress clear communication and transparency. And the reaction of EME financial markets so far has been benign. But significant risks of more adverse scenarios remain. The corporate debt situation in EMEs has been worsening, particularly in China, and market reactions to even small surprises can be unpredictable and outsized.
Even with these risks, however, the best thing the Federal Reserve can do--not just for the United States, but for the global economy at large--is to keep our house in order through the continued pursuit of our dual mandate. Finally, it bears remembering that Fed policy normalization is occurring not in isolation, but in the context of a solid U.S. economic recovery, which should benefit all economies around the world.
References
Ahmed, Shaghil, and Andrei Zlate (2014). "Capital Flows to Emerging Market Economies: A Brave New World?" Journal of International Money and Finance, vol. 48 (November), pp. 221-48.
Alfaro, Laura, Gonzalo Asis, Anusha Chari, and Ugo Panizza (2017). "Lessons Unlearned? Corporate Debt in Emerging Markets," NBER Working Paper 23407. Washington: National Bureau of Economic Research, May.
Ayala, Diana, Milan Nedelijkovic, and Christian Saborowski (2015). "What Slice of the Pie? The Corporate Bond Market Boom in Emerging Economies (PDF)," IMF Working Paper WP/15/148. Washington: International Monetary Fund, July.
Beltran, Daniel, Keshav Garud, and Aaron Rosenblum (2017). "Emerging Market Nonfinancial Corporate Debt: How Concerned Should We Be?" IFDP Notes. Washington: Board of Governors of the Federal Reserve System, June 1.
Bowman, David, Juan M. Londono, and Horacio Sapriza (2015). "U.S. Unconventional Monetary Policy and Transmission to Emerging Market Economies," Journal of International Money and Finance, vol. 55 (July), pp. 27-59.
Bruno, Valentina, and Hyun Song Shin (2015). "Capital Flows and the Risk-Taking Channel of Monetary Policy," Journal of Monetary Economics, vol. 71 (April), pp. 119‑32.
Cavallo, Eduardo, Andrew Powell, Mathieu Pedemonte, and Pilar Tavella (2015). "A New Taxonomy of Sudden Stops: Which Sudden Stops Should Countries Be Most Concerned About?" Journal of International Money and Finance, vol. 51 (March), pp. 47-70.
Chen, Jiaqian, Tommaso Mancini-Griffoli, and Ratna Sahay (2014). "Spillovers from United States Monetary Policy on Emerging Markets: Different This Time? (PDF)" IMF Working Paper WP/14/240. Washington: International Monetary Fund, December.
Chow, Julian T.S. (2015). "Stress Testing Corporate Balance Sheets in Emerging Economies," IMF Working Paper WP/15/216. Washington: International Monetary Fund, September, available at http://citeseerx.ist.psu.edu/viewdoc/download;jsessionid=8A054997E3FBA6EC30B9601BA692B9F4?doi=10.1.1.698.5498&rep=rep1&type=pdf (PDF).
Clark, John, Nathan Converse, Brahima Coulibaly, and Steve Kamin (2016). "Emerging Market Capital Flows and U.S. Monetary Policy," IFDP Notes. Washington: Board of Governors of the Federal Reserve System, October 18.
Fratzscher, Marcel (2012). "Capital Flows: Push Versus Pull Factors, and the Global Financial Crisis," Journal of International Economics, vol. 88 (November), pp. 341-56.
Fratzscher, Marcel, Marco Lo Duca, and Roland Straub (2013). "On the International Spillovers of U.S. Quantitative Easing," ECB Working Paper 1557. Frankfurt: European Central Bank, June.
Ghosh, Atish R., Jun Kim, Mahvash S. Qureshi, and Juan Zalduendo (2012). "Surges (PDF)," IMF Working Paper WP/12/22. Washington: International Monetary Fund, January.
Hausman, Joshua, and Jon Wongswan (2011). "Global Asset Prices and FOMC Announcements," Journal of International Money and Finance, vol. 30 (April), pp. 547-71.
International Monetary Fund (2014). "Moving from Liquidity to Growth-Driven Models," chapter 1 of Global Financial Stability Report. Washington: IMF, April, pp. 1-65.
--------- (2016a). "Financial Stability Challenges in a Low-Growth, Low-Rate Era," chapter 1 of Global Financial Stability Report. Washington: IMF, October, pp. 1-48.
--------- (2016b). "Understanding the Slowdown in Capital Flows to Emerging Markets," chapter 2 in World Economic Outlook: Too Slow for Too Long. Washington: IMF, April, pp. 63-99.
--------- (2017). "Is Growth at Risk?" chapter 1 of Global Financial Stability Report. Washington: IMF, October, pp.1-52.
Koepke, Robin (2015). "What Drives Capital Flows to Emerging Markets? A Survey of the Empirical Literature," IIF Working Paper. Washington: Institute of International Finance, April, available at https://www.iif.com/publication/capital-flows/what-drives-capital-flows-emerging-markets-2.
Pomerleano, Michael (1998). "Corporate Finance Lessons from the East Asian Crisis (PDF)," Note 155. Washington: World Bank Group, October.
Powell, Jerome H. (2013). "Advanced Economy Monetary Policy and Emerging Market Economies," speech delivered at "Prospects for Asia and the Global Economy," the 2013 Asia Economic Policy Conference sponsored by the Federal Reserve Bank of San Francisco, San Francisco, Calif., November 4.
--------- (2016). "The Global Trade Slowdown and Its Implications for Emerging Asia," speech delivered at "CPBS 2016 Pacific Basin Research Conference," sponsored by the Center for Pacific Basin Studies at the Federal Reserve Bank of San Francisco, San Francisco, Calif., November 18.
Tepper, Alexander, Jeffrey Moore, Myeongguk Suh, and Sunwoo Nam (2013). "Estimating the Impacts of U.S. LSAPs on Emerging Market Economies' Local Currency Bond Markets," Staff Report 595. New York: Federal Reserve Bank of New York, January.
1. For more on this linkage, see Powell (2013). Return to text
2. For more on the global trade slowdown, see Powell (2016). Return to text
3. The specific variables in the regression include the GDP growth differential between EMEs and advanced economies, commodity prices, EME interest rate differentials with advanced economies, measures of the Federal Reserve's quantitative easing, the VIX (which is the one-month-ahead option-implied volatility of the S&P 500 index), and country-specific emerging market credit spreads (see Clark and others, 2016). Note that, because of special factors driving its flows over the past few years, China is not included in this analysis. Other studies that have also examined determinants of EME capital flows include International Monetary Fund (2016b), Koepke (2015), Ahmed and Zlate (2014), Fratzscher (2012), and Ghosh and others (2012). Generally, these papers find that many factors, including both "pull" and "push," affect EME capital flows. Return to text
4. This negative contribution reflects that the average growth differential between the selected group of EMEs, which does not include China, and the advanced economies itself became negative. Return to text
5. Variants of the model applied to gross capital inflows, rather than net capital inflows, give qualitatively similar results. In particular, the model of gross flows also finds that the pickup in these flows has been less strong than predicted by the model. However, the relative contribution of the risk variables to the pickup in EME flows relative to the turnaround in commodity prices is somewhat larger with the gross flows model than the net inflows model. The consequences of net versus gross flows for the recipient economies can potentially differ as, for example, Cavallo and others (2015) have argued. Return to text
6. See Bowman, Londono, and Sapriza (2015). Other papers that have looked at the effects of U.S. monetary policies on EME asset prices and the channels through which these effects are transmitted include Bruno and Shin (2015); Chen, Mancini-Griffoli, and Sahay (2014); Fratzscher, Lo Duca, and Straub (2013); Tepper and others (2013); and Hausman and Wongswan (2011). Return to text
7. Variables used in creating the index include external debt, the current account position, foreign reserves, public debt, control of inflation, and bank credit to the private sector. Return to text
8. See Beltran, Garud, and Rosenblum (2017). Other studies that have recently investigated EME corporate vulnerabilities include Alfaro, Chari and Panizza (2017); International Monetary Fund (2014, 2016a); and Chow (2015). Return to text
9. An ICR of 2 or less is often associated with increased likelihood of distress. For example, just before the Asian financial crisis, firms in Indonesia, South Korea, and Thailand had an average ICR of 2 (see Pomerleano, 1998). Return to text
10. A 1 percentage point positive shock to the borrowing costs of EME corporates undoes about half of the decline in average borrowing costs from 2009 to 2016. Although on the face of it, this shock does not seem too large, as discussed in Beltran and others (2017), it is applied to the average interest rate on the entire existing debt, not just on new debt. Given that the average interest rate for EME firms is about 4‑3/4 percent, a 1 percentage point rise increases the interest expense by about a fifth. Return to text
11. The calibration of the shocks is the same as in Beltran and others (2017). A 20 percent earnings shock corresponds to about half of the decline in EME corporate earnings experienced after the global financial crisis. It is difficult to say how much emerging market currencies might depreciate under stress, but 20 percent currency depreciation seems well within the plausible range. While the calibration of the shocks is the same as the above-mentioned study, the effects have been updated to reflect a larger sample of firms that is now available. Qualitatively, the results and conclusions do not change from this update. Return to text
12. In computing the new debt-at-risk after exchange rate shocks, we need the share of debt that is foreign currency-denominated, which is taken from Ayala, Nedelijkovic, and Saborowski (2015). Return to text
13. The IMF's most recent Global Financial Stability Report, released October 11, (IMF, 2017), also concludes that EMEs should be able to handle any reduction in flows from global monetary policy normalization "in a relatively smooth manner, given their enhanced resilience and stronger growth outlook." Return to text