
IFDP Notes
 Print
PrintOctober 18, 2016
Emerging Market Capital Flows and U.S. Monetary Policy1 (PDF)
John Clark, Nathan Converse, Brahima Coulibaly, and Steve Kamin *
I. Introduction
The years 2009-2011, immediately following the global financial crisis (GFC), were marked by a surge in capital flows to emerging market economies (EMEs) coupled with the aggressive loosening of monetary policy in advanced economies. These simultaneous developments led many observers to conclude that the highly accommodative policies of the Federal Reserve and other advanced-economy central banks were what triggered the wave of capital flows toward EMEs. Observers expressed concerns that these flows were complicating economic policies for the recipient economies, contributing to excessive credit growth, creating the risk of asset price bubbles, and causing unwanted exchange rate appreciation. Some characterized the advanced-economy monetary policies as "currency wars," arguing that the policies targeted weaker exchange rates to gain a competitive advantage.2 Concerns were also raised that once monetary policy in the United States and other advanced economies began to normalize, these flows would reverse, slowing growth and creating additional complications and disruptions in EMEs.
But these developments must be put in perspective. As we document below, capital flows to EMEs had actually started their surge in the mid-2000s, well before the GFC and resultant loosening of advanced-economy monetary policies; the surge in capital flows during 2009-2011 in large part reflected a bounceback from the temporary collapse in these flows that occurred during the GFC. Even more importantly, many observers also failed to note or were voicing their concerns prior to the event that after 2010, capital flows to EMEs started to ratchet down, even as monetary policies in the United States and other advanced economies continued to loosen. These considerations raise the question of how large a role the accommodative monetary policies of the Federal Reserve and other advanced-economy central banks have played in the surge of capital flows to EMEs after the GFC. They also raise the question of why these capital flows started to decline in more recent years.
Accordingly, in this note we analyze the drivers of EME capital flows, focusing in particular on the role of U.S. monetary policy and other potential factors in the decline in capital flows to EMEs since 2010. Our findings suggest that this decline was mainly an endogenous response to waning EME output growth and weakening commodity prices.3 Anticipations of normalization of Federal Reserve policy, including during the taper tantrum when market participants shifted their expectations about the outlook for U.S. monetary policy, appear not to have played a predominant role. Increased concerns about EME creditworthiness, as might be evidenced in widening credit spreads, also appear to have played only a secondary role in the decline in capital flows. Consistent with this finding, there have been relatively few EME financial crises of late, which stands in stark contrast to the widespread surges in credit spreads and financial turbulence that brought previous EME credit and economic expansions to an end.
Our analysis suggests that declining capital inflows in recent years owed primarily to a decline in EME growth and to the drop in commodity prices. Therefore, once EME growth picks up again and commodity prices stabilize, expected returns to holding EME assets and capital flows to the region should revive, albeit probably not, at least for the time being, to the levels seen at the start of the decade.
II. Role of U.S. Monetary Policy
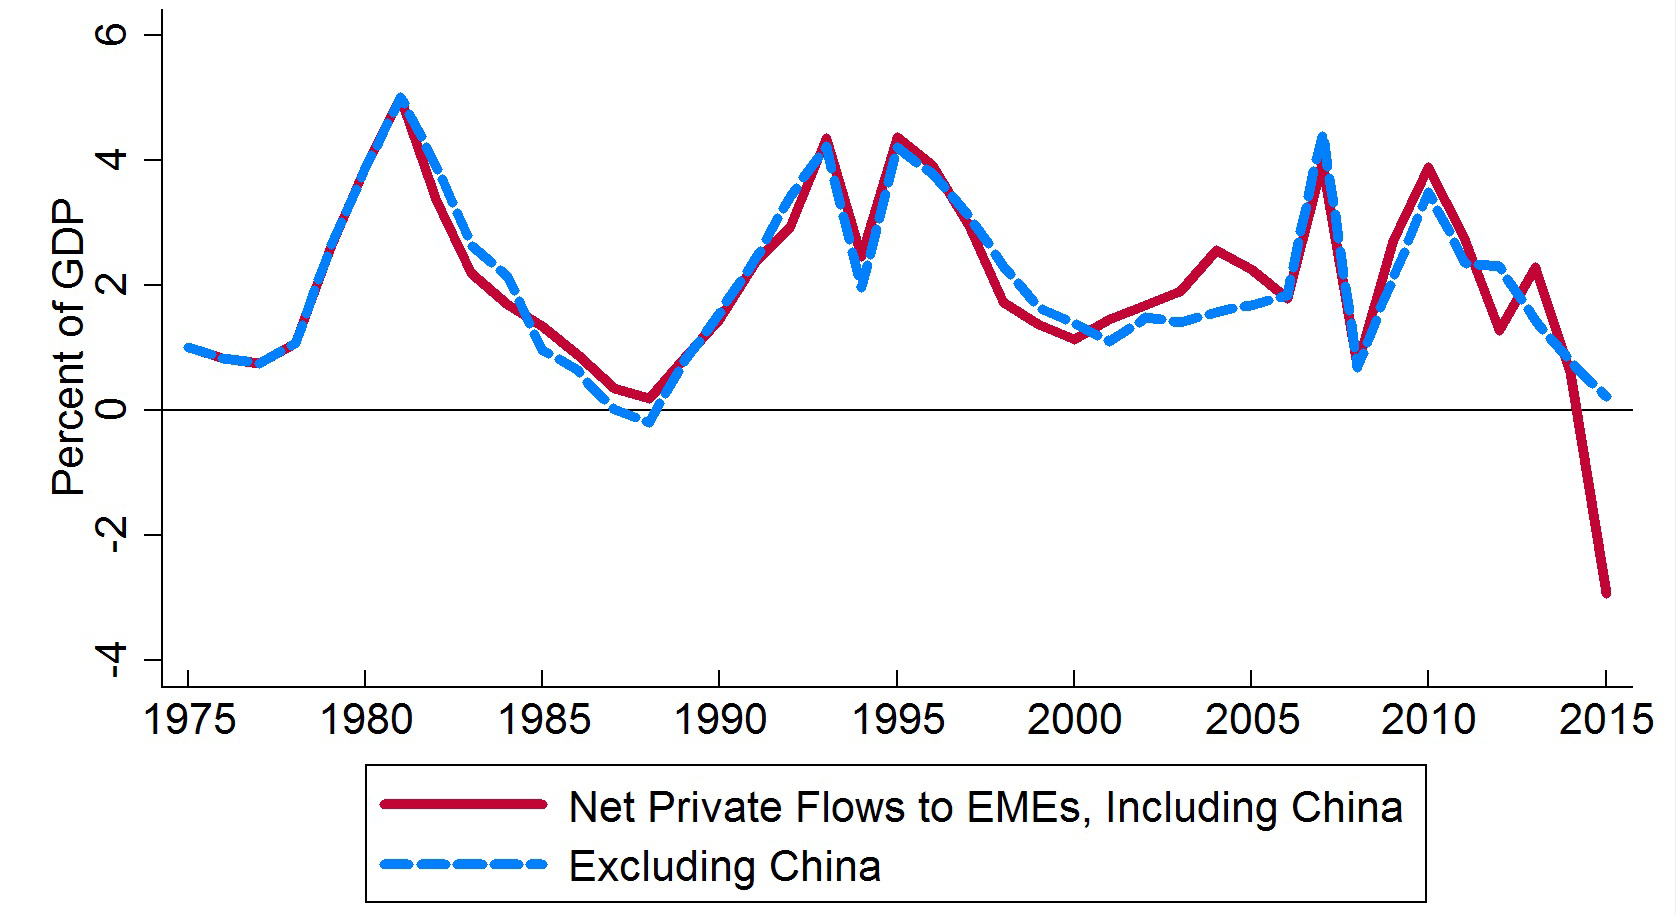
Chart 1 below puts capital flows to EMEs in historical perspective. Note that these are net private flows they do not include changes in official reserve holdings, which have been substantial in the past couple of decades.4 We also distinguish between total flows to EMEs and flows excluding China; as will be discussed shortly, those two series diverged significantly in the past year as capital flows out of China surged. Two main points emerge from the chart.
 |
|
Source: IMF BoPS annual data. Net private flows include net FDI, portfolio, & other flows excl. IMF lending.
Countries included: China (except where indicated), Indonesia, India, Korea, Malaysia, Philippines, Taiwan, Thailand, Argentina, Brazil, Chile, Colombia, Mexico, Czech Republic, Hungary, Poland, Romania, Russia, Israel, South Africa, Turkey
First, the surge and subsequent decline in net capital flows to EMEs in recent years is not unprecedented. It is the third such cycle in the past four decades, following on the Latin American debt buildup in the late 1970s and early 1980s and the emerging Asia-led boom of the mid-1990s.
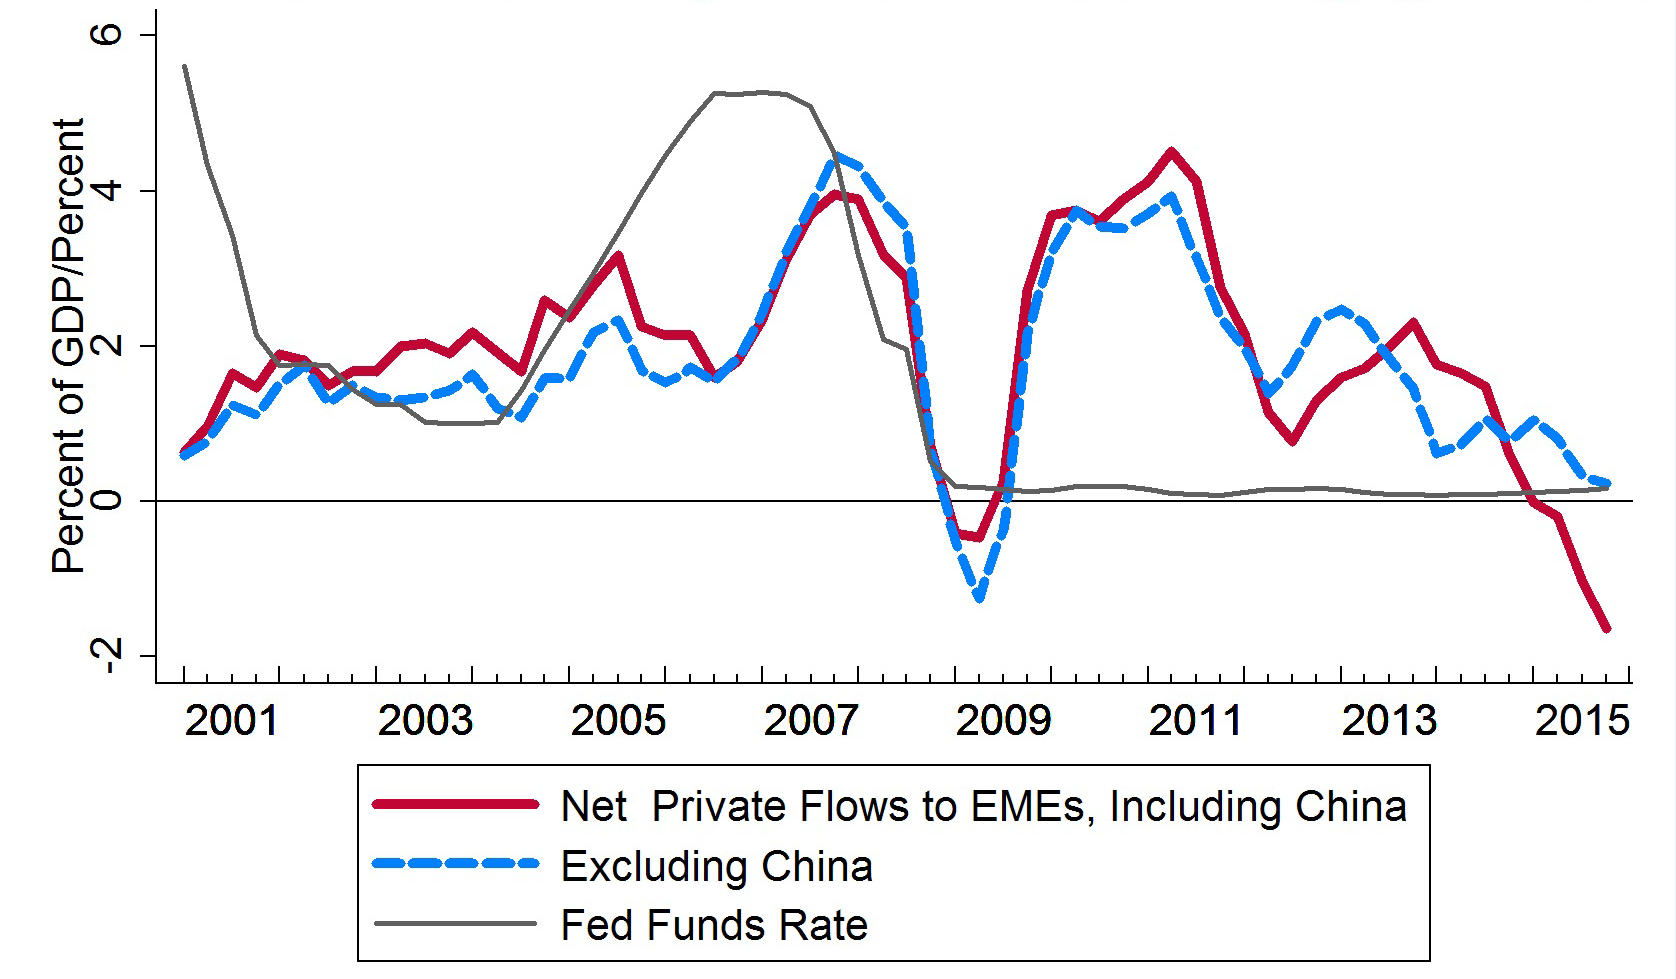
Second, the recent super-cycle in net capital flows started before the GFC and accompanying loosening of advanced-economy monetary policies (although this super-cycle was temporarily interrupted by the collapse in capital flows associated with the GFC). This can be seen more clearly in Chart 2, which shows EME capital flows accelerating in 2006, when the federal funds rate was at its recent peak of 5¼ percent. These capital flows were interrupted by the GFC, but subsequently rebounded to roughly their 2007 levels, even as the federal funds rate stayed near zero.
 |
|
Source: IMF BoPS, FRB. Net private inflows incl. net FDI, portfolio, & other flows excl. IMF lending; 4-quarter rolling ave.
Countries included: China (except where indicated), Indonesia, India, Korea, Malaysia, Philippines, Taiwan, Thailand, Argentina, Brazil, Chile, Colombia, Mexico, Czech Republic, Hungary, Poland, Romania, Russia, Israel, South Africa, Turkey
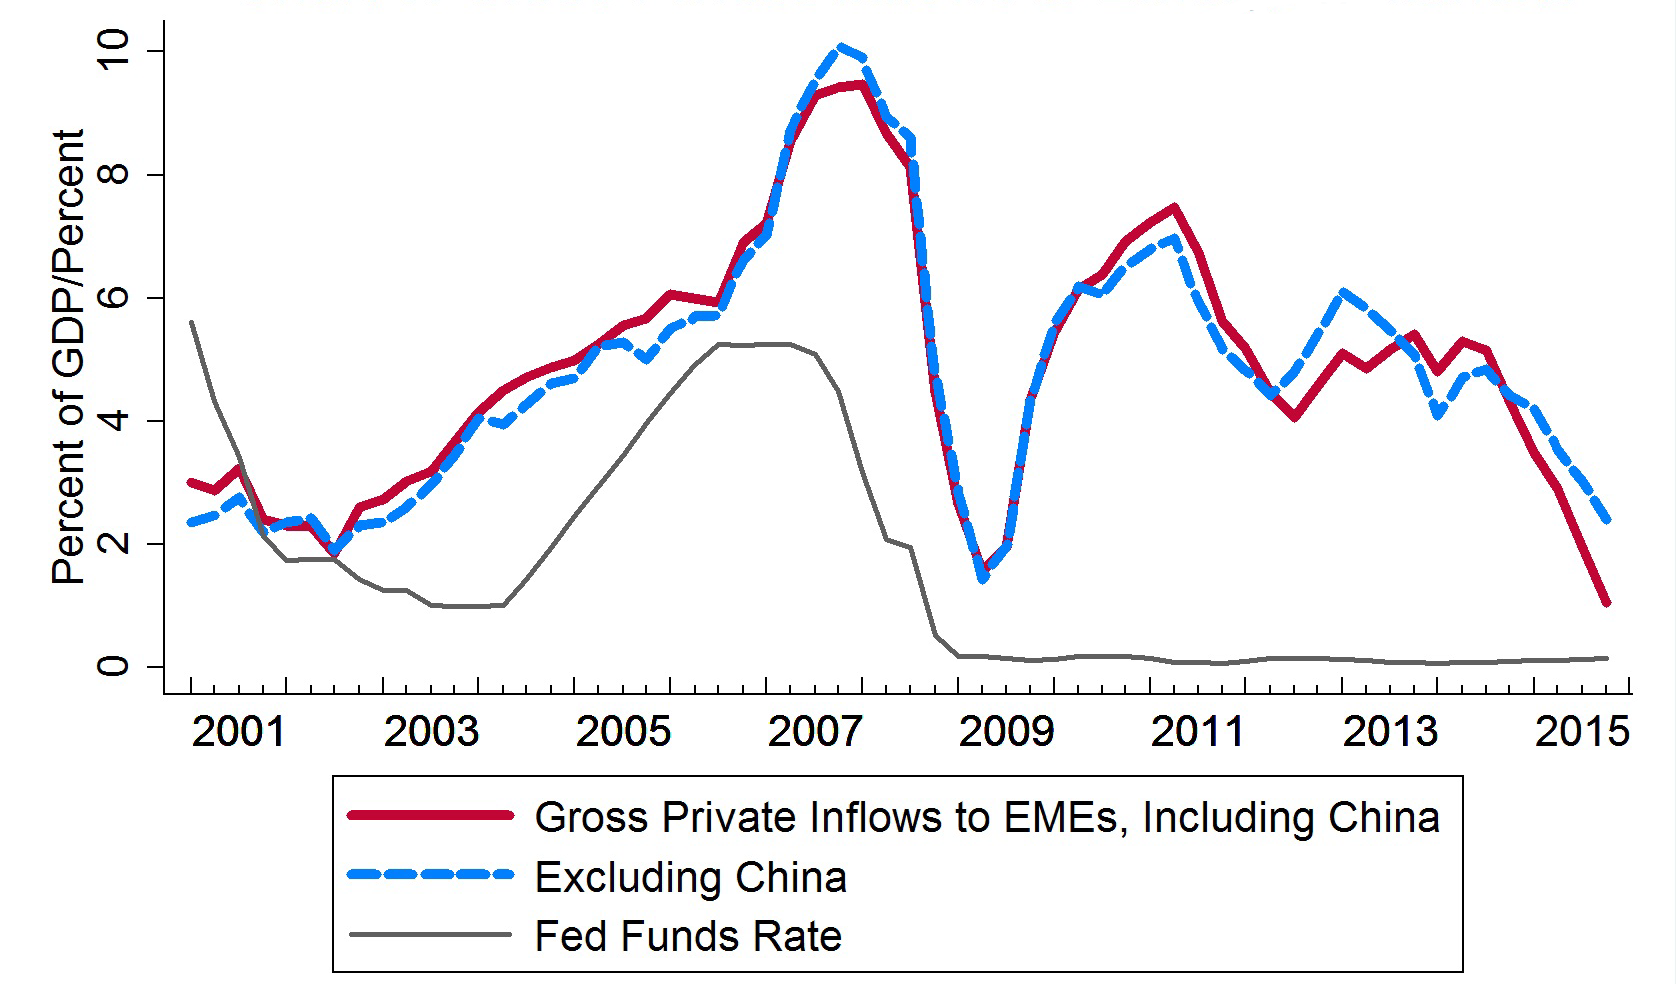
The net private capital inflows shown in Chart 2 represent gross private capital inflows to EMEs minus gross private capital outflows from EMEs.5 The distinction between gross and net flows can be important, in that perhaps factors such as U.S. monetary policy specifically affect only gross inflows into EMEs, rather than net. However, the trends shown in Chart 2 are not a statistical artifact of this subtraction of gross outflows. Chart 3 repeats the presentation in Chart 2, but using gross private inflows to EMEs rather than net private inflows. Interestingly, using gross flows, it is even clearer that capital flows to EMEs peaked before the loosening of advanced-economy monetary policies.
 |
|
Sources: IMF BoPS, FRB. Gross private inflows include net FDI, portfolio, & other flows excl. IMF lending, 4-quarter rolling ave.
Countries included: China (except where indicated), Indonesia, India, Korea, Malaysia, Philippines, Taiwan, Thailand, Argentina, Brazil, Chile, Colombia, Mexico, Czech Republic, Hungary, Poland, Romania, Russia, Israel, South Africa, Turkey
Note that in Charts 1 through 3, we show capital flows as a share of GDP, both including and excluding China. The two series follow each other fairly closely until the last couple of years, when the sharp reversal of Chinese inflows into outflows, combined with China's large GDP weight in the aggregate, leads to a much sharper decline in total net inflows than in inflows excluding China. China's recent capital outflows are generally believed to represent special circumstances, notably changes in expectations for RMB policy in a context of sustained large-scale currency intervention, that do not apply to most EMEs. Accordingly, in much of the analysis that follows, we focus on EME net capital inflows excluding China.
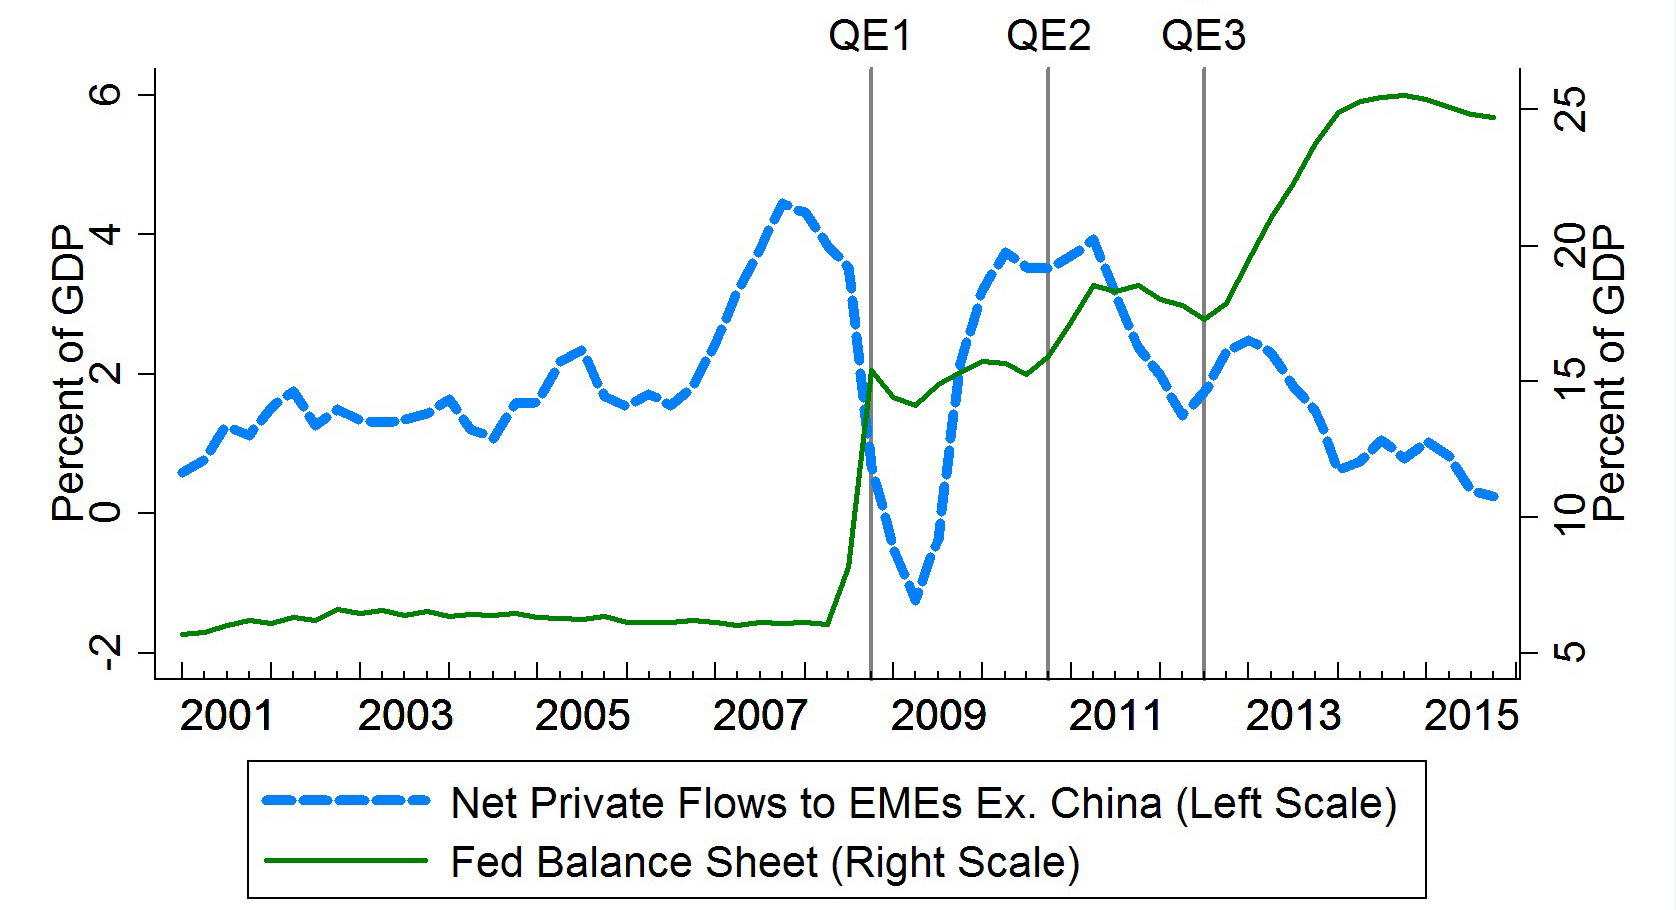
After the GFC, with the policy rate near zero, Federal Reserve monetary policy was primarily implemented through asset purchases and forward guidance rather than through interest rate changes. Chart 4 compares net private capital inflows to EMEs to the size of the balance sheet of the Federal Reserve, with the beginning of each of the quantitative easing (QE) periods marked by vertical lines. Clearly, net private capital flows to EMEs started declining soon after the expansion of the Federal Reserve's balance sheet under QE2, and continued to decline after the further expansion of the balance sheet under QE3.
 |
|
Sources: IMF BoPS, FRB. Net private inflows incl. net FDI, portfolio, & other flows excl. IMF lending; 4-quarter rolling ave.
Countries included: Indonesia, India, Korea, Malaysia, Philippines, Taiwan, Thailand, Argentina, Brazil, Chile, Colombia, Mexico, Czech Republic, Hungary, Poland, Romania, Russia, Israel, South Africa, Turkey
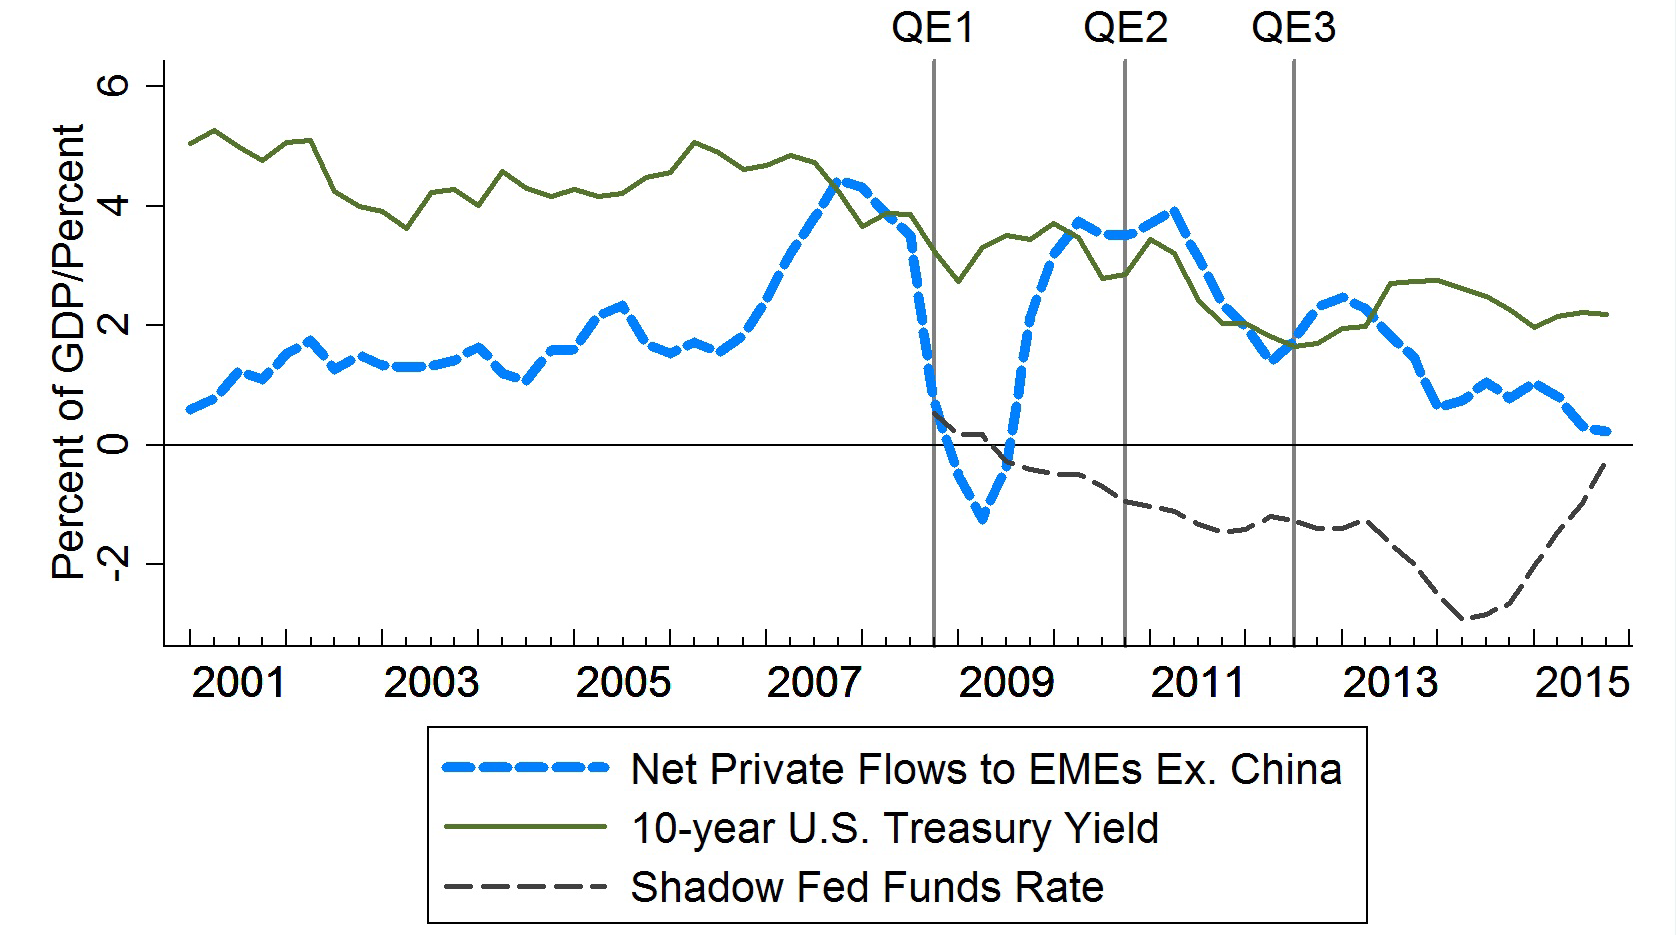
In Chart 5, we replace the balance sheet measure with the U.S. 10-year Treasury yield; this yield reflects many factors, including but not limited to monetary policy, but represents a useful indicator for funding conditions. Again, it is apparent that capital flows to EMEs were declining even as conditions in U.S. financial markets continued to loosen. Chart 5 also includes a measure of the so-called "shadow fed funds rate," which is intended to capture the impact of accommodative policies such as asset purchases during periods when the actual fed funds rate hits (or comes close to hitting) zero.6 This measure also shows that U.S. policy generally continued to move in an accommodative direction through late 2014, and thus does not explain the slowdown in capital inflows to that point.
 |
|
Sources: IMF BoPS, FRED, FRB Atlanta. Net private inflows incl. net FDI, portfolio, & other flows excl. IMF lending; 4-quarter rolling ave.
Countries included: Indonesia, India, Korea, Malaysia, Philippines, Taiwan, Thailand, Argentina, Brazil, Chile, Colombia, Mexico, Czech Republic, Hungary, Poland, Romania, Russia, Israel, South Africa, Turkey
This is not to say that the monetary policies of the United States and other advanced economies had no effect on capital flows to, and financial conditions in, EMEs. A host of research on this topic confirms that such spillovers can be significant, especially over windows of time immediately following U.S. policy surprises.7 However, as confirmed by several studies, this does not mean that advanced-economy monetary policies are the only (or even the most important) factor affecting capital flows to EMEs, nor that the effects of these monetary policies are always very long-lasting. For example, during the taper tantrum period in mid-2013, when investors shifted their expectations for the trajectory of U.S. monetary policy, EME asset prices and capital inflows did indeed fall. But the impact was short lived and concentrated among EMEs with heightened macroeconomic vulnerabilities. Likewise, ahead of the Fed's lifting the policy rate from the effective lower bound in December 2015, the shadow Fed Funds rate rose from negative levels, as shown in Chart 5, which may have contributed to the outflows in that year. But as has been discussed, most of the deceleration in net private inflows had already taken place prior to 2015.
 |
|
Sources: FRED, Bloomberg. EME 10-year yield is a GDP-weighted average of country-specific yields.
Countries included: Indonesia, India, Korea, Malaysia, Philippines, Taiwan, Thailand, Argentina, Brazil, Chile, Colombia, Mexico, Czech Republic, Hungary, Poland, Romania, Russia, Israel, South Africa, Turkey
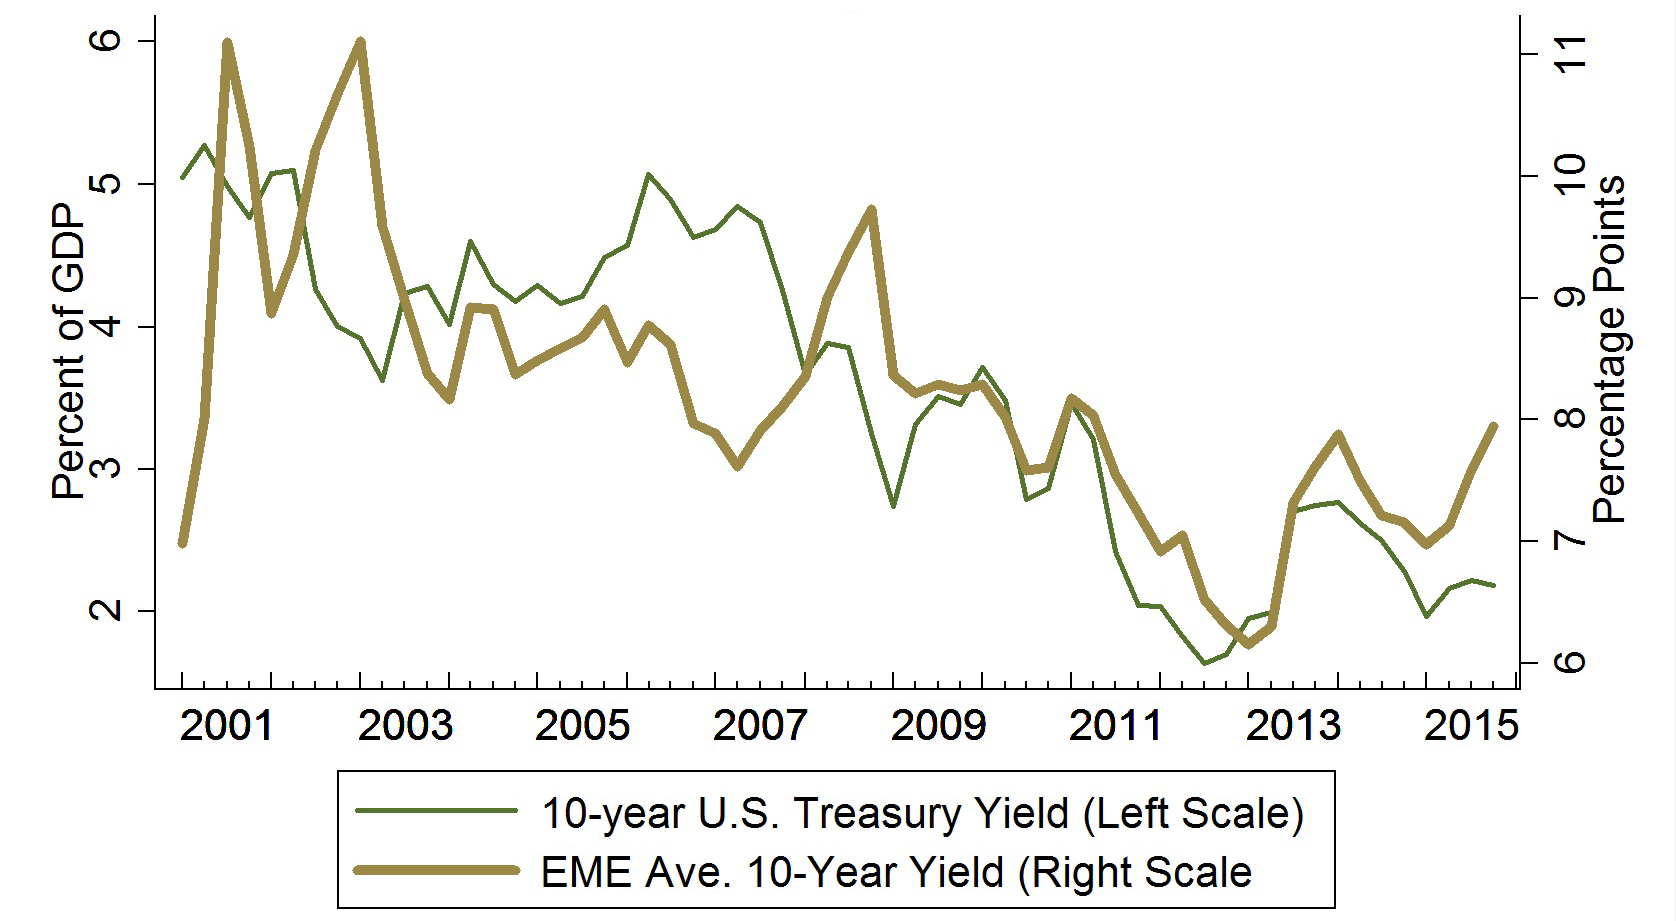
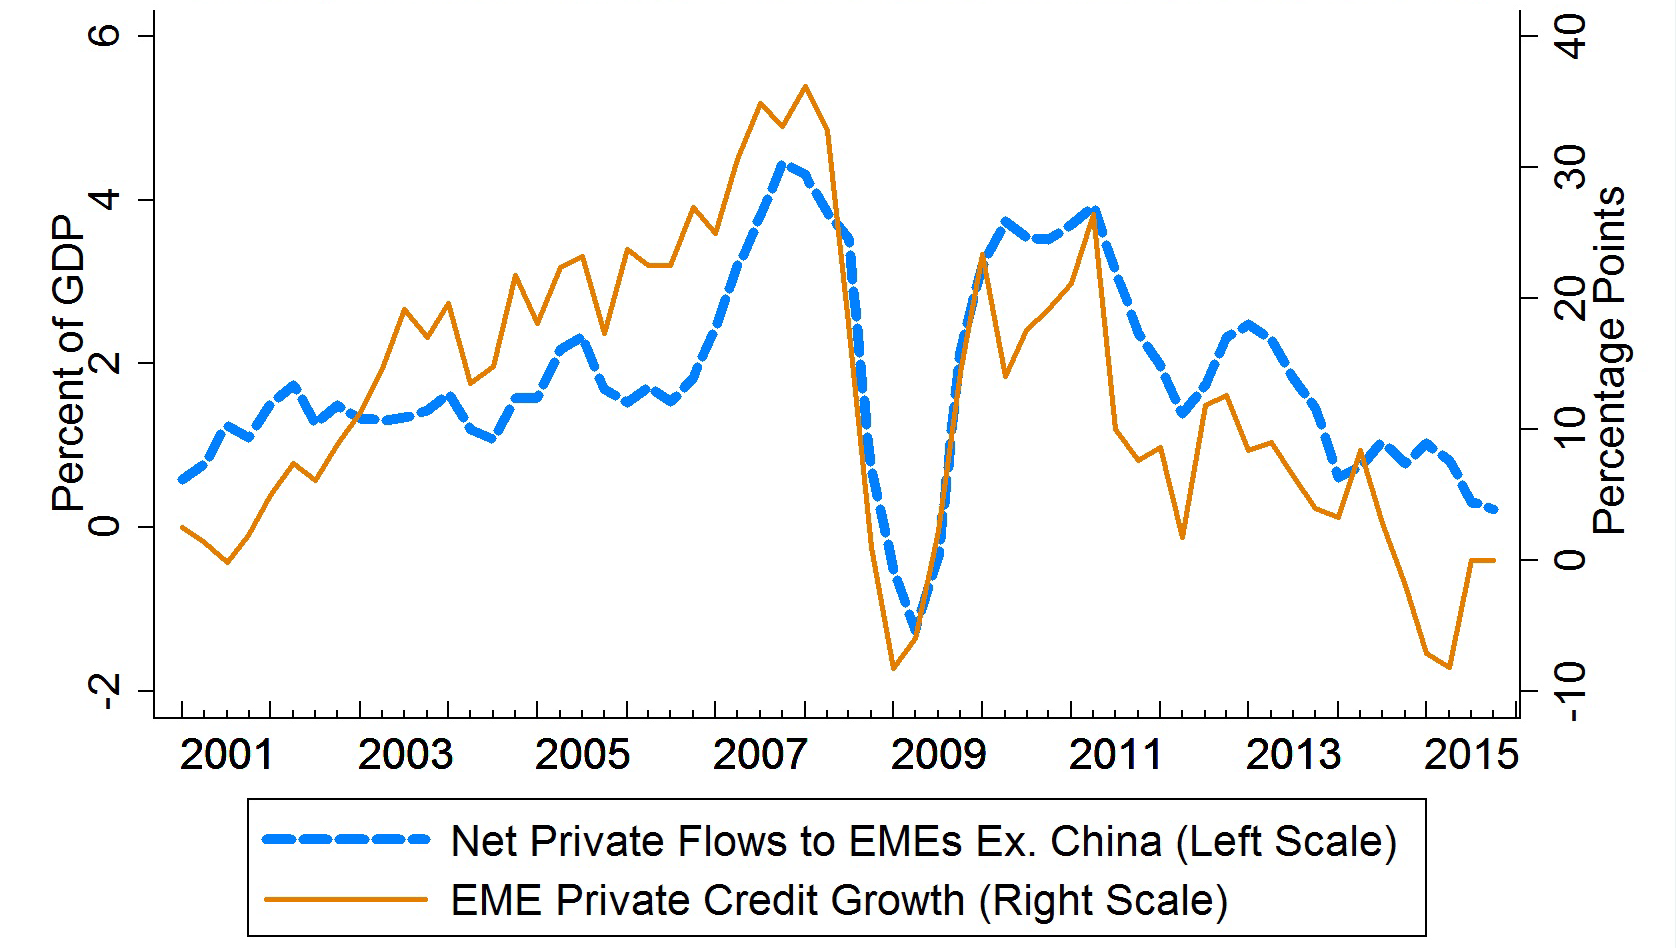
Other signs of spillover can be seen in the co-movement of EME local currency yields with US yields. As shown in Chart 6, domestic yields in EMEs followed U.S. yields downward in recent years, notwithstanding that capital inflows were waning. Even so, these declines in U.S. and EME yields do not appear to have led to pickups in EME domestic credit growth. Chart 7 shows that growth in credit to the non-financial private sector in selected EMEs has tended to move broadly in line with changes in net private capital inflows, and as such, has decelerated during the post-2010 period, notwithstanding accommodative U.S. financial policies and falling EME yields. These developments suggest that the impetus for declining net private capital flows to EMEs may be a slowdown in EME demand for credit more than a curtailment of credit supply, as will be explored further below.
 |
|
Sources: IMF BoPS, BIS credit statistics. Credit growth is a GDP-weighted ave. of change in credit to nonfinacial private sector. Net private inflows incl. net FDI, portfolio, & other flows excl. IMF lending; 4-quarter rolling ave.
Countries included: Indonesia, India, Korea, Malaysia, Philippines, Taiwan, Thailand, Argentina, Brazil, Chile, Colombia, Mexico, Czech Republic, Hungary, Poland, Romania, Russia, Israel, South Africa, Turkey
III. Role of Other Factors in the Deceleration of Net Capital inflows to EMEs
The fact that capital flows to EMEs started declining even as Federal Reserve monetary policy grew increasingly accommodative and financial conditions continued to loosen suggests that the decline in capital inflows cannot be attributed exclusively to the normalization of Fed policy. So what does account for the decline? The most worrisome possibility is that the slowdown reflected an external credit crunchthat is, a tight rationing of external credit to EME borrowers. Such a credit crunch could have been associated either with heightened concerns about EME creditworthiness, with heightened risk aversion on the part of global investors, or some combination of these two (often-intertwined) factors. Such credit crunches, combined with the unwinding of pronounced domestic imbalances, turned the earlier booms in Latin America and emerging Asia into busts, and led to severe macroeconomic and financial disruptions in both of those prior episodes.8
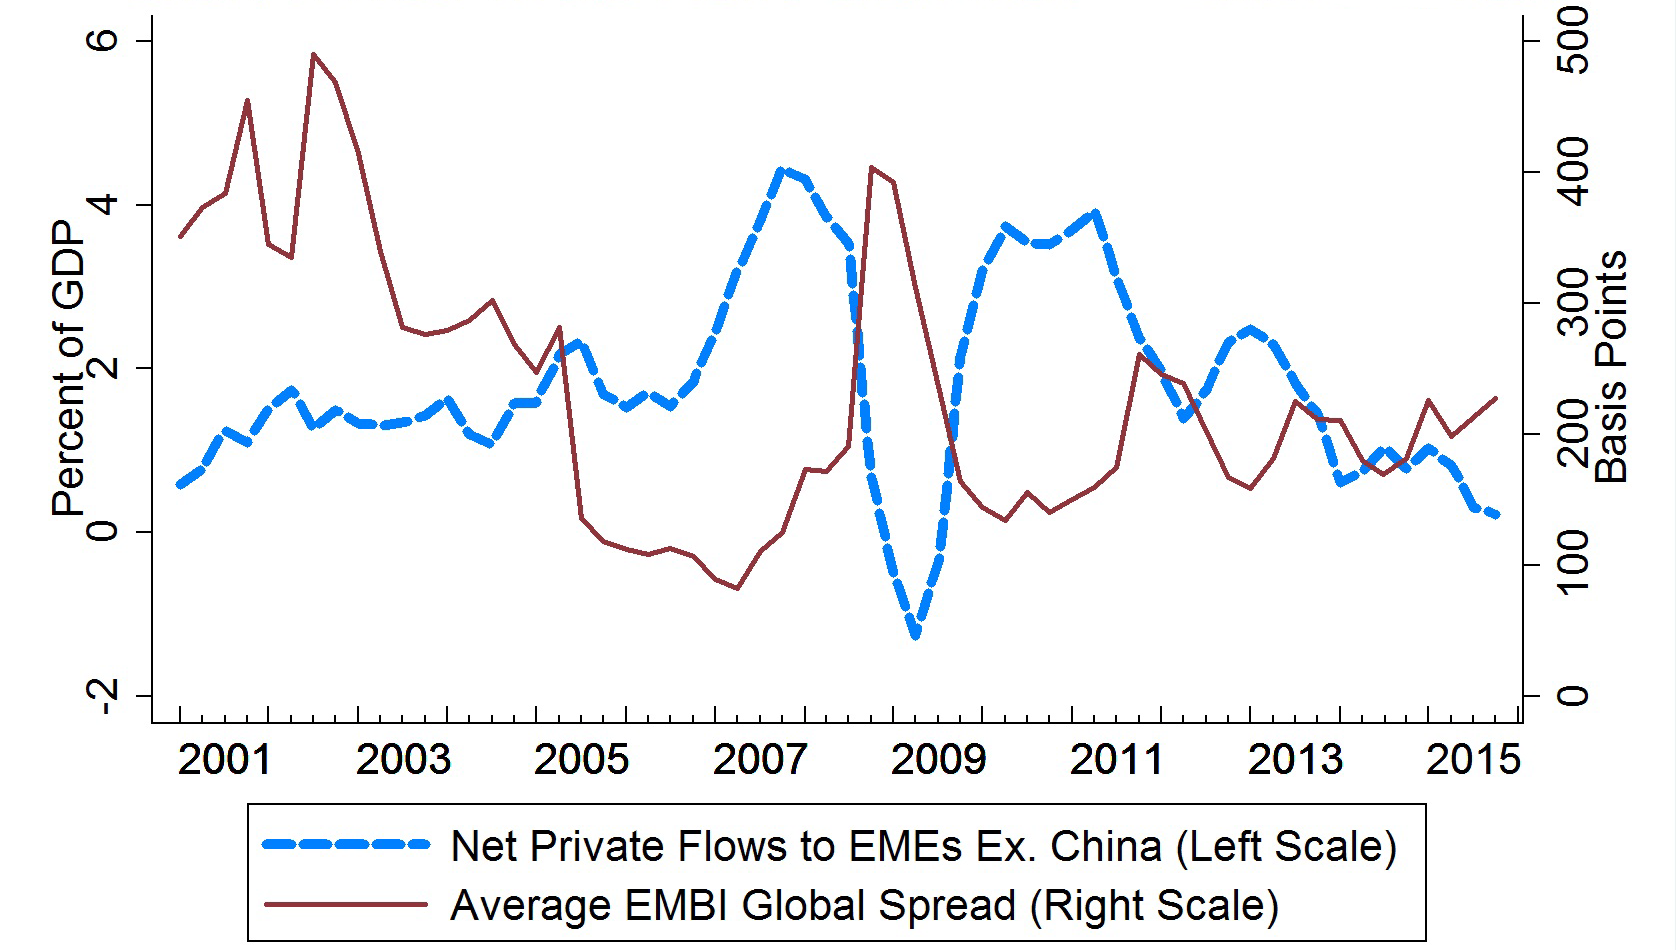
However, a sudden restriction of access to international credit markets seems much less evident in the most recent declines in EME flows than it did during the EME financial crises of the 1980s and 1990s. Chart 8 compares net private capital flows to a weighted average of EME EMBI Global spreadsa measure of the risk premia demanded by markets to compensate them for country risk. These spreads spiked during the GFC, and they showed smaller upticks in 2011 and 2013. But there was little sustained increase from 2011 to 2014 in the EME spreads, even as net capital inflows trended substantially downward. To be sure, these spreads are now at their highest level since the GFC. However, they are only a little higher than their average from 2010 to 2014, when capital inflows were well above recent levels, and they are considerably below their values at the beginning of the 2000s. The absence of a large run-up in spreads has been consistent with the low incidence of banking and external debt crises in the major EMEs over the past 5 years, compared to prior decades, thanks in part to the progress made by policymakers in EMEs to strengthen economic frameworks, as well as the EMEs' increased reliance on long-term funding through FDI and long-term bonds during the latest cycle.
 |
|
Sources: IMF BoPS, JPMorgan. EMBIG spread is a GDP-weighted average of country-specific spreads. Net private inflows incl. net FDI, portfolio, & other flows excl. IMF lending; 4-quarter rolling ave.
Countries included: Indonesia, India, Korea, Malaysia, Philippines, Taiwan, Thailand, Argentina, Brazil, Chile, Colombia, Mexico, Czech Republic, Hungary, Poland, Romania, Russia, Israel, South Africa, Turkey
Another potential explanation for the decline in net private capital flows to EMEs is that economic growth in these economies has been slowing relative to growth in the advanced economies. Slower EME growth reduces the rate of return on investments in EMEs, both absolutely and relative to advanced economies, and it reduces the demand for credit by EME households and firms. As shown in Chart 9, the difference between EME and advanced-economy growth seems well correlated with broad movements in EME net capital flows over the past 15 years, both on their way up, before and after the GFC, and on their way down subsequently.9
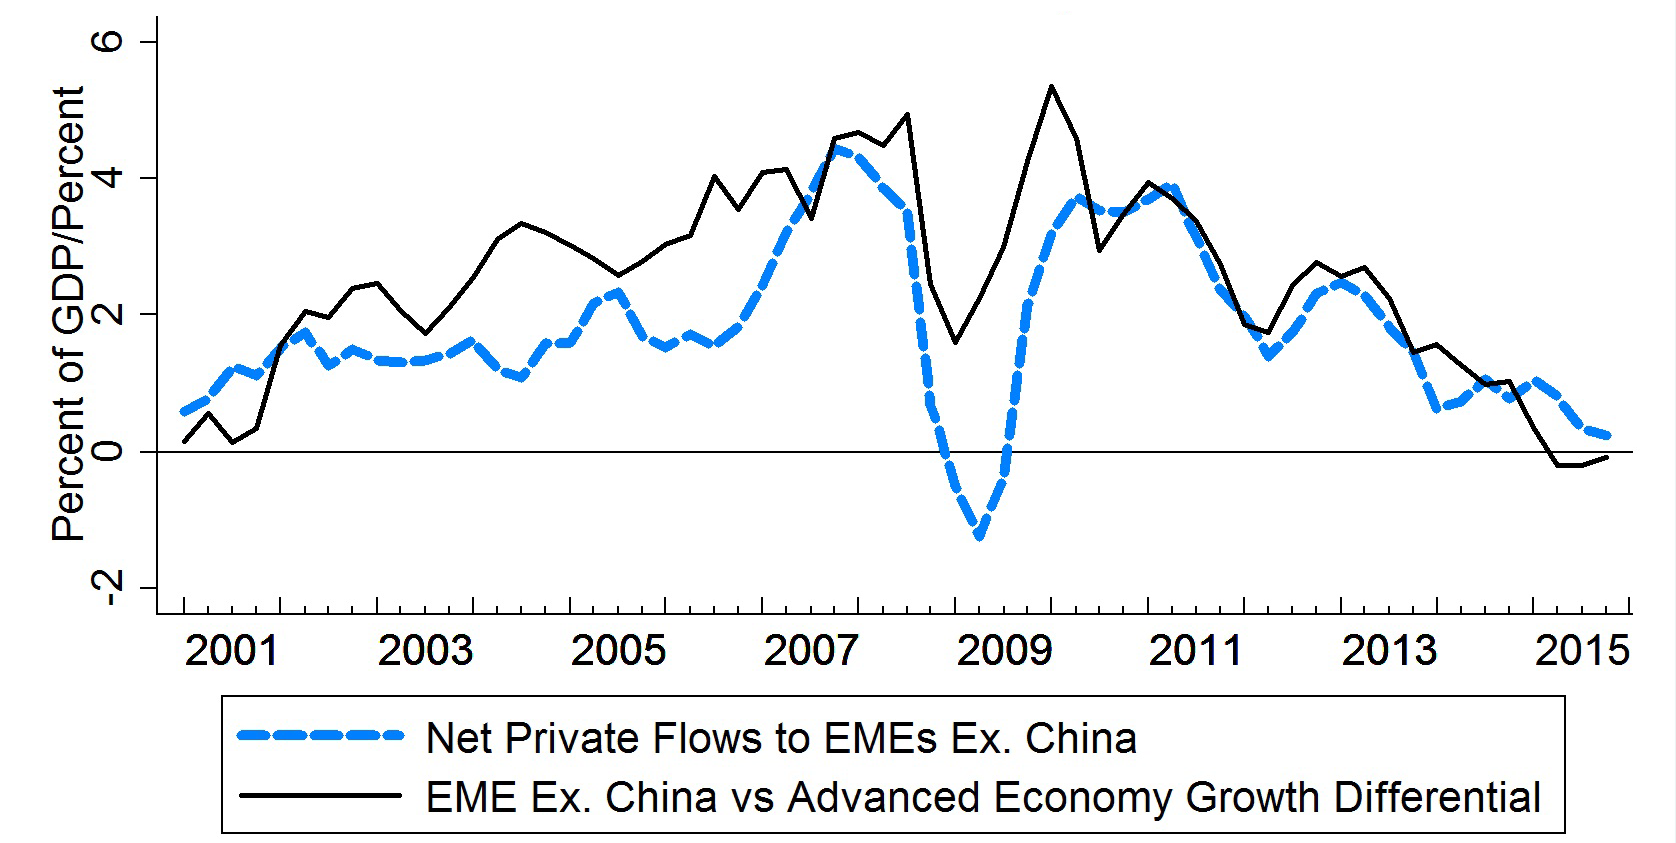 |
|
Sources: IMF BoPS, Haver. Net private inflows incl. net FDI, portfolio, & other flows excl. IMF lending; 4-quarter rolling ave. Growth differential is GDP-weighted average of EMEs' year-on-year growth less GDP-weighted average of advanced economy growth.
Countries included: Indonesia, India, Korea, Malaysia, Philippines, Taiwan, Thailand, Argentina, Brazil, Chile, Colombia, Mexico, Czech Republic, Hungary, Poland, Romania, Russia, Israel, South Africa, Turkey AE Countries included: Australia, Austria, Belgium, Canada, Finland, France, Germany, Greece, Ireland, Italy, Japan, Netherlands, Portugal, Spain, Sweden, Switzerland, UK, US
A related explanation for the decline in net private capital flows to EMEs is the fall in commodity prices. High commodity prices are associated with high domestic investment in commodity production, expectations of elevated future growth, and thus high capital inflows. As shown in chart 10, movements in commodity prices are well-correlated with movements in capital flows.
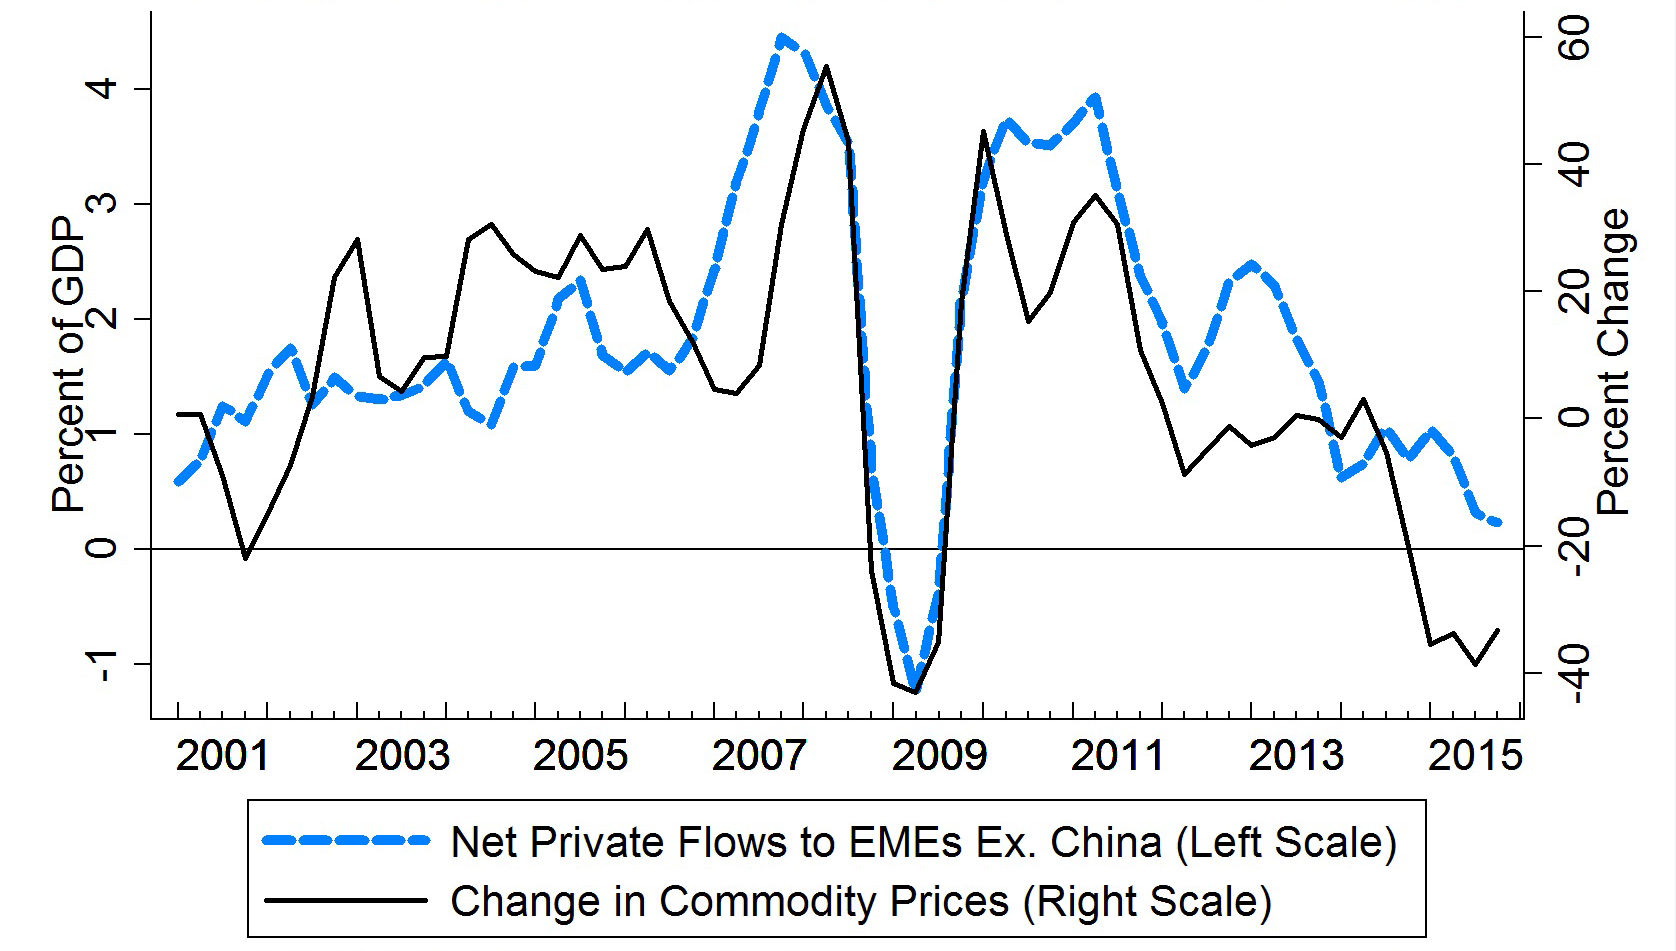 |
|
Sources: IMF BoPS, IMF IFS. Changes in commodity prices are quarter-on-quarter, weighted by share of world trade. Net private inflows incl. net FDI, portfolio, & other flows excl. IMF lending; 4-quarter rolling ave.
Countries included: Indonesia, India, Korea, Malaysia, Philippines, Taiwan, Thailand, Argentina, Brazil, Chile, Colombia, Mexico, Czech Republic, Hungary, Poland, Romania, Russia, Israel, South Africa, Turkey
IV. An Empirical Model of Net Private Capital Flows to EMEs
To assess the relative contributions of the factors discussed above to the deceleration in net private capital inflows to EMEs over the past five years, and to test whether the co-movements seen in the aggregate data also hold at the country level and across a broader time frame, we estimated a panel regression model, relating net private inflows to 19 major EMEs to a range of country-specific and global factors.10
The results of estimating the model are summarized in table 1, and discussed in further detail in the appendix to this note. As can be seen in the first row, we find that EME growth differentials vis-à-vis the advanced economies have an economically and statistically significant impact on net private capital flows to EMEs.11 Specifically, a sustained 1 percentage point increase in a country's growth differential raises net private inflows by 1/4 percent of GDP per year.12 And changes in commodity priceswhich can materially impact growth prospects for commodity exporting countriesalso matter significantly for capital flows to these countries.
Our model suggests increases in the differential between EME and U.S. policy interest rates13 tends to boost capital inflows, while a tightening of U.S. monetary policy, as measured by the Wu-Xia shadow federal funds rate discussed above, tends to lower these flows. The coefficients on these variables are not statistically significant, but their signs are consistent with economic theory and their magnitudes are plausible, so we retain them in the model.
Finally, our exercise confirms that increases in sovereign spreads, a measure of perceived country risk, lead to lower net capital flows. We include in our regression not only the EMBI Global spread but also the square of this spread, to control for nonlinear effects when spreads are extremely high.14 Surprisingly, swings in global risk appetite, as proxied by the VIX index, don't add much explanatory value, but this may reflect covariance between sovereign spreads and the VIX.
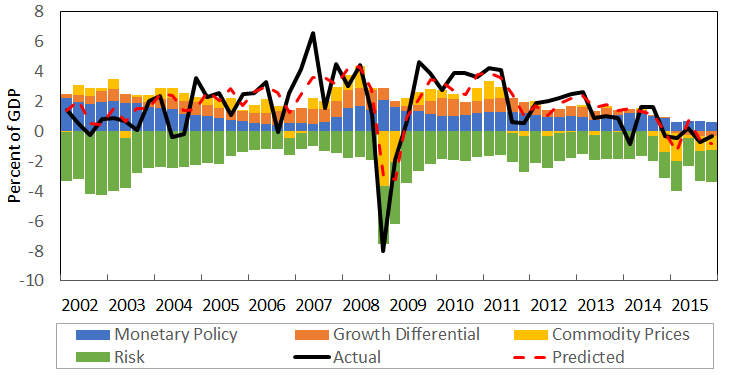
Chart 11 plots the contributions of each of the variables in our model to the aggregate capital inflows implied by our regression results.15 Overall, the in-sample model prediction (the dashed line) tracks reasonably well the actual inflowsthe solid black line. Looking at the contribution of different factors, according to our model capital inflows to EMEs received important support in 2010 and 2011 from EME growth differentials, higher commodity prices, and, to a lesser extent, monetary factors. From 2011 to 2014:Q3, the narrowing of the growth differential was the largest contributor to the slowdown in flows, making essentially a negative contribution to flows by the end of the period. From the last quarter of 2014 onward, however, the further drop in flows can be attributed largely to the fall off in commodity prices (the yellow bars).
 |
|
4-quarter rolling averages. Source: IMF BoPS, authors' calculations.
Countries included: Indonesia, India, Korea, Malaysia, Philippines, Taiwan, Thailand, Argentina, Brazil, Chile, Colombia, Mexico, Czech Republic, Hungary, Poland, Romania, Russia, Israel, South Africa, Turkey
The stance of monetary policy (the blue bars), as captured in our model by the shadow Fed Funds rate and the interest rate differential, has also contributed somewhat to the ebbing of flows, but mainly since mid-2014, by which time these flows had already fallen significantly. Risk factors (as measured by the VIX and EMBIG spreads) did play an important part in the dip in capital flows during the global financial crisis, but appear to have played a relatively minor role in the recent slowdown.
Dependent Variable: Net Private Flows (% GDP) |
|---|
| Coefficient | Robust Standard Errors | |
|---|---|---|
| Growth Prospects | ||
| Growth differential | 0.182 ** | (0.084) |
| Change in commodity prices | 0.069 *** | (0.023) |
| Monetary Factors | ||
| Change in (shadow) FFR | -0.554 | (0.330) |
| Interest rate differential | 0.105 | (0.076) |
| Risk Factors | ||
| VIX | -0.019 | (0.029) |
| EMBI Global spread | -0.492 ** | (0.212) |
| EMBI Global spread squared | 0.004 | (0.003) |
| Additional Controls: | ||
| Lagged dependent variable | 0.252 *** | (0.049) |
| Country fixed effects | Yes | |
| Observations | 1,276 | |
| R-squared | 0.386 | |
Statistically significant at *10%, **5%, and ***1%
Standard errors clustered at country level. See appendix for variable definitions.
As summarized in Table 2, the model suggests that changes in growth differentials and commodity prices together explain just over two-thirds of the 3.9 percent of GDP slowdown in capital flows to the EMEs (excluding China) between 2010 and 2015, while the approach of the Fed lift-off in 2015 lowered flows by about 0.4 percent of GDP over this period.
What does this model imply about the prospects for net capital flows to EMEs going forward? It suggests that the current slowdown in flows should abate, provided that EME growth and commodity prices firm in line with consensus and market forecasts, EME spreads don't widen materially, and Federal Reserve policy normalization proceeds gradually, consistent with FOMC members' communications and projections. Under these assumptions, the model suggests flows would recover to a pace similar to that observed early in the previous decade, butbarring unexpected surges in commodity prices or EME growthstill well below the peak seen at the beginning of this decade.
(percent of aggregate EME GDP excl. China) |
|---|
| 2010 | 2015 | Change | |
|---|---|---|---|
| Actual inflows | 3.54 | -0.32 | -3.86 |
| Predicted inflows | 3.05 | -0.55 | -3.60 |
| Contributions by: | |||
| Growth Factors | 1.43 | -1.27 | -2.69 |
| Growth differential | 0.99 | -0.26 | -1.26 |
| Commodity price change | 0.43 | -1.01 | -1.44 |
| Monetary Factors | 1.08 | 0.64 | -0.44 |
| Change in (shadow) FFR | 0.03 | -0.37 | -0.39 |
| Interest rate differential | 1.05 | 1.00 | -0.05 |
| Risk Factors | -1.88 | -2.02 | -0.14 |
| VIX | -0.60 | -0.44 | 0.17 |
| EMBI Global spread | -1.31 | -1.63 | -0.32 |
| EMBI Global spread squared | 0.03 | 0.05 | 0.02 |
Source: authors' calculations. See appendix for details on calculation of each variable's contribution to aggregate capital flows.
Appendix
We estimate a panel regression model using quarterly data on 19 major EMEs from 1994:Q1 to 2015:Q4. In particular, we model capital flows (measured as a share of GDP) as a function of domestic growth prospects, monetary policy variables, and investor attitudes towards or perceptions of the country's riskiness:
We capture the returns available to investors with two variables: $$Growth{\_Dif}_{i,t}$$, the difference between country i's annual growth rate in quarter t and average annual growth in the advanced economies,16 and the quarter on quarter percentage change in $$Commodity{\_Price}_{t}$$, a commodity price index constructed by the IMF. We include the latter variable since the majority of the EMEs in our sample are commodity exporters. We control for monetary conditions with the variable $$Rate{\_Diff}_{i,t}$$, the difference between policy rate in country i at time t and the U.S. Federal Funds Rate, as well as the change in $$USPolicy_{t}$$, which is the fed funds rate prior to the first quarter of 2009 and the shadow fed funds rate constructed by Wu and Xia (2016) through the end of 2015.17
To capture investor perceptions of risk, we use the country-specific EMBI Global spread for country i during the quarter, $$EMBIG_{i,t}$$, allowing this variable to enter the specification in a nonlinear way to account for the fact that fluctuations in spreads at low levels may have different effects than when spreads are elevated. We include the VIX index to capture investors' attitude towards risk. Specifically, the VIX measures the price of risk on U.S. equity markets using the implied volatility of S&P options. As additional controls, we include a lagged value of the dependent variable to capture dynamics as well as a set of country-specific intercepts $$\theta{}_{i}$$.
The data constitute an unbalanced panel, with some countries (Argentina, Korea, Mexico, and the Philippines) having data back to 1994 while others enter the sample more recently. The policy rate differential variable has some very extreme observations, for example values upwards of three hundred percent for countries in financial crisis. We therefore drop the largest five percent of our observations for the rate differential variable.
| Variable | Source | Description |
|---|---|---|
| Private Capital Inflows | IMF Balance of Payments Statistics | [net private flows]=[net FDI]+[net portfolio inflows]+[net other inflows]-[IMF net lending]-[other official exceptional financing] |
| Federal Funds Rate | Federal Reserve Board | Effective federal funds rate |
| Fed Balance Sheet | Federal Reserve Board | Total assets of Federal Reserve banks |
| U.S. 10-year Treasury Yield | Federal Reserve Economic Data (FRED) | |
| Long Term Yields | FRED, Bloomberg | Nominal yield on 10-year sovereign bond |
| EME Credit Growth | BIS | Change in total credit to the non-financial private sector |
| EMBI Global Spread | JPMorgan | Country-specific EMBI Global spread |
| Output Growth | Haver | Real GDP growth, year on year |
| Commodity Price Index | IMF, via FRED | IMF index of commodity prices |
| Policy Rates | Haver | Central bank policy rate |
| Shadow Federal Funds Rate | FRB Atlanta | Constructed by Xia (2015) |
| VIX | FRED | Implied volatility of S options |
| Country | Coverage Dates |
|---|---|
| Argentina | 1994:Q1 to 2015:Q4 |
| Brazil | 1995:Q1 to 2015:Q4 |
| Chile | 1999:Q1 to 2015:Q4 |
| China | 1998:Q1 to 2015:Q4 |
| Colombia | 2001:Q1 to 2015:Q4 |
| Czech Republic | 2004:Q1 to 2015:Q4 |
| Hungary | 1999:Q1 to 2015:Q4 |
| India | 2004:Q1 to 2015:Q4 |
| Indonesia | 2001:Q1 to 2015:Q4 |
| Israel | 2004:Q1 to 2015:Q4 |
| Korea | 1994:Q1 to 2015:Q4 |
| Malaysia | 1999:Q1 to 2015:Q4 |
| Mexico | 1994:Q1 to 2015:Q4 |
| Philippines | 1994:Q1 to 2015:Q4 |
| Poland | 2000:Q1 to 2015:Q4 |
| Russia | 1998:Q1 to 2015:Q4 |
| South Africa | 1995:Q1 to 2015:Q4 |
| Thailand | 1997:Q1 to 2015:Q4 |
| Turkey | 1996:Q1 to 2015:Q4 |
References
Ahmed, Shaghil, and Andrei Zlate (2014). "Capital Flows to Emerging Market Economies: A Brave New World?" Journal of International Money and Finance, vol. 48 (November), pp. 221-28.
Ahmed, Shaghil, Brahima Coulibaly, and Andrei Zlate (2015). "International Spillovers to Emerging Market Economies: How Important Are Economic Fundamentals?" International Finance Discussion Papers 1135. Washington, D.C. Federal Reserve Board. https://www.federalreserve.gov/econresdata/ifdp/2015/files/ifdp1135.pdf.
Bowman, David, Juan M. Londono, and Horacio Sapriza (2015). "U.S. Unconventional Monetary Policy and Transmission to Emerging Market Economies," Journal of International Money and Finance, vol. 55 (July), pp. 27-59.
Bruno, Valentina and Hyung Song Shin (2015). "Capital Flows and the Risk-Taking Channel of Monetary Policy", Journal of Monetary Economics, vol. 71, pp. 11932.
Calvo, G. A., Izquierdo, A., and Mejia, L.-F. (2004). On the empirics of sudden stops: The relevance of balance-sheet effects. Working Paper 10520, National Bureau of Economic Research.
Cavallo, Eduardo, Andrew Powell, Mathieu Pedemonte, Pilar Tavella. 2015. A new taxonomy of Sudden Stops: Which Sudden Stops should countries be most concerned about? Journal of International Money and Finance 51: 47-70.
Chen, Jiaqian, Tommaso Mancini-Griffoli, and Ratna Sahay (2014). "Spillovers from United States Monetary Policy on Emerging Markets: Different This Time?" IMF Working Paper Series WP/14/240. Washington, D.C.: International Monetary Fund, December, www.imf.org/external/pubs/ft/wp/2014/wp14240.pdf  .
.
Chen, Qianying, Andrew Filardo, Dong He, and Feng Zhu (2012). "International Spillovers of Central Bank Balance Sheet Policies," BIS Papers Series 66. Basel, Switzerland: Bank for International Settlements, October, www.bis.org/publ/bppdf/bispap66p.pdf .
Forbes, K. J. & Warnock, F. E. (2012), 'Capital flow waves: Surges, stops, flight, and retrenchment', Journal of International Economics 88(2): 235-251.
Fratzscher, M. (2012), Capital flows, push versus pull factors and the global financial crisis, Journal of International Economics 88(2): 341-356.
Fratzscher, Marcel, Marco Lo Duca, and Roland Straub (2013). "On the International Spillovers of U.S. Quantitative Easing," Working Paper Series 1557. Frankfurt: European Central Bank, June, www.ecb.europa.eu/pub/pdf/scpwps/ecbwp1557.pdf .
Gonzalez-Rozada, M. & Levy-Yeyati, E. (2008), `Global factors and emerging market spreads', The Economic Journal 118(533), 1917-1936.
IMF (2016). "Understanding the Slowdown in Capital Flows to Emerging Markets" World Economic Outlook, Chapter 2. Washington, D.C. International Monetary Fund, April.
Jotikasthira, Pab, Christian Lundblad, and Tarun Ramadorai. 2012. "Asset Fire Sales and Purchases and the International Transmission of Financial Shocks," Journal of Finance 67, 2015-2050
Koepke, Robin. 2015. "What Drives Capital Flows to Emerging Markets: A Survey of the Empirical Literature." IIF Working Paper. Washington D.C. Institute of International Finance, April.
Rogers, John H., Chiara Scotti, and Jonathan H. Wright (2014). "Evaluating Asset-Market Effects of Unconventional Monetary Policy: A Multi-Country Review," Economic Policy, vol. 29 (October), pp. 749-99.
Sahay, Ratna, Vivek Arora, Thanos Arvanitis, Hamid Faruqee, Papa N'Diaye, Tommaso Mancini-Griffoli, and an IMF Team. (2014). "Emerging Market Volatility: Lessons from the Taper Tantrum," IMF Staff Discussion Note SDN/14/09. Washington: International Monetary Fund, September, www.imf.org/external/pubs/ft/sdn/2014/sdn1409.pdf .
Wu, Jing Cynthia and Fan Dora Xia. 2016. Measuring the Macroeconomic Impact of Monetary Policy at the Zero Lower Bound. Journal of Money, Credit, and Banking. 48(2-3).
* John Clark is from the Federal Reserve Bank of New York and Nathan Converse, Brahima Coulibaly, and Steve Kamin are from the Federal Reserve Board in Washington D.C. Return to text
1. The note is based on the presentation by Steve Kamin of the authors' work at a conference, "The G20 Agenda under the Chinese Presidency" hosted by the Institute for International Finance, February 25, 2016. The authors thank Shaghil Ahmed, Stijn Claessens, and participants of the International Finance Division's Seminar for helpful comments and suggestions. We also thank Sarah Lord and Caleb Wroblewski for excellent research assistance. Return to text
2. In particular, Brazilian Finance Minister Guido Mantega captured headlines when he asserted that Brazil was caught "in the midst of an international currency war" in September 2010 (Financial Times, September 27, 2010). Brazilian President Dilma Rousseff expressed a similar sentiment in April 2012, saying that Brazil had been hit by a "monetary tsunami" (Bloomberg, April 9, 2012). Return to text
3. Chapter 2 of the IMF's April 2016 World Economic Outlook (IMF 2016) comes to a similar conclusion. Return to text
4. Thus, these flows are not merely the negative of the current account balance. We also exclude balance of payments support loans from the IMF or other official creditors. Specifically our measure of net private flows can be written as the following sum: Net FDI net portfolio inflows net other inflows IMF net lending other official exceptional financing. Alternately our measure of net private flows can be derived as current account balance change in official reserves holdings errors and omissions IMF net lending other official exceptional financing. Note that in this broad definition, net "private" capital inflows includes normal lending by public sector entities such as the World Bank and official bilateral lenders, but we refer to the aggregate as "private" flows, because lending and investing by private entities account for the bulk of the flows to the EMEs discussed in this note. Return to text
5. More precisely, gross private capital inflows represent the net acquisition of claims on EMEs by non-residents while gross private capital outflows represent the net acquisition of non-reserve claims on foreign economies by EME residents. Return to text
6. When the zero lower bound is binding, the shadow fed funds rate is defined as the negative short-term interest rate that the term structure of Treasury yields implies would prevail, if investors did not have the option to hold cash; the shadow rate is equivalent to the actual fed funds rate when the zero lower bound is not binding. While the shadow rate is not a rate at which entities actually borrow or invest, a more negative shadow rate is consistent with expectations that policy rates will remain at low levels for longer. There is some evidence that movements in shadow rates are associated with changes in US economic activity similar to those with actual fed funds rate changes (Wu and Xia 2016). Return to text
7. For example, see Didier et al. (2010); Jotikasthira et al. (2011); Fratzscher (2012); Forbes and Warnock (2012); Chen et al. (2012); Ahmed and Zlate (2014); Chen, Mancini-Griffoli, and Sahay (2014); Rogers, Scotti, and Wright (2014); Sahay et al. (2014); Ahmed, Coulibaly, and Zlate (2015); Bowman, Londono, and Sapriza (2015); Bruno and Shin (2015). Koepke (2015) provides a useful overview of the literature. Return to text
8. See for example Calvo, Izquierdo, and Mejia (2004) and Cavallo et al. (2015). Return to text
9. Ahmed and Zlate (2014) and IMF (2016) find similar results. Return to text
10. China is included in our empirical model discussed in Section IV. Including or omitting China does not materially change our estimated coefficients. Return to text
11. These differentials are measured as the GDP growth of individual EMEs minus the average growth rate of the advanced economies. Return to text
12. These are long-run effects and takes into account amplification through the lagged dependent variable, which is also included in the regressions to capture dynamics. Return to text
13. The differential for each EME is defined as the policy rate in that country minus the U.S. fed funds rate. Return to text
14. Although the coefficient on the squared EMBI Global spread is not statistically significant, when it was omitted from our specification, the coefficient on the level of the EMBI Global spread was implausibly small. It is also worth noting that the level and the square of the spread are jointly significant. Return to text
15. The contributions of each variable to aggregate capital flows as a share of GDP was calculated as a GDP-weighted cross-country average of each variable's contribution to country level capital flows (again measured as a share of GDP). For more details on this calculation, see the appendix. Return to text
16. Quarterly growth rates are four-quarter changes. Return to text
17. As discussed in the body of the text, Wu and Xia (2016) use a term structure model to calculate the negative rate that bond yields imply would prevail when the Fed Funds Rate is at the zero lower bound if investors did not have the option to hold cash. Return to text
Please cite as:
Clark, John, Nathan Converse, Brahima Coulibaly, and Steve Kamin (2016). "Emerging Market Capital Flows and U.S. Monetary Policy," IFDP Notes. Washington: Board of Governors of the Federal Reserve System, October 18, 2016. https://doi.org/10.17016/2573-2129.23
Disclaimer: IFDP Notes are articles in which Board economists offer their own views and present analysis on a range of topics in economics and finance. These articles are shorter and less technically oriented than IFDP Working Papers.