January 19, 2017
The Economic Outlook and the Conduct of Monetary Policy
Chair Janet L. Yellen
At the Stanford Institute for Economic Policy Research, Stanford University, Stanford, California
It is a privilege to be here today to discuss how the Federal Reserve is conducting monetary policy to promote a healthy economy. For more than 30 years, research from the Stanford Institute for Economic Policy Research has informed economic policy, and events such as this one have helped foster debate among scholars, policymakers, business leaders, and members of the public on critical economic issues facing our nation. I appreciate the opportunity to participate.
In my remarks today, I will review the considerable progress the economy has made toward the attainment of the two objectives that the Congress has assigned to the Federal Reserve--maximum employment and price stability. The upshot is that labor utilization is close to its estimated longer-run normal level, and we are closing in on our 2 percent inflation objective. I will then discuss the prospects for adjusting monetary policy in the manner needed to sustain a strong job market while maintaining low and stable inflation. Determining how best to adjust the federal funds rate over time to achieve these objectives will not be easy. For that reason, in the balance of my remarks, I will discuss some considerations that will help inform our decisions, including the guidance provided by simple policy rules. I will conclude by touching on some key uncertainties affecting the outlook.
Progress to Date
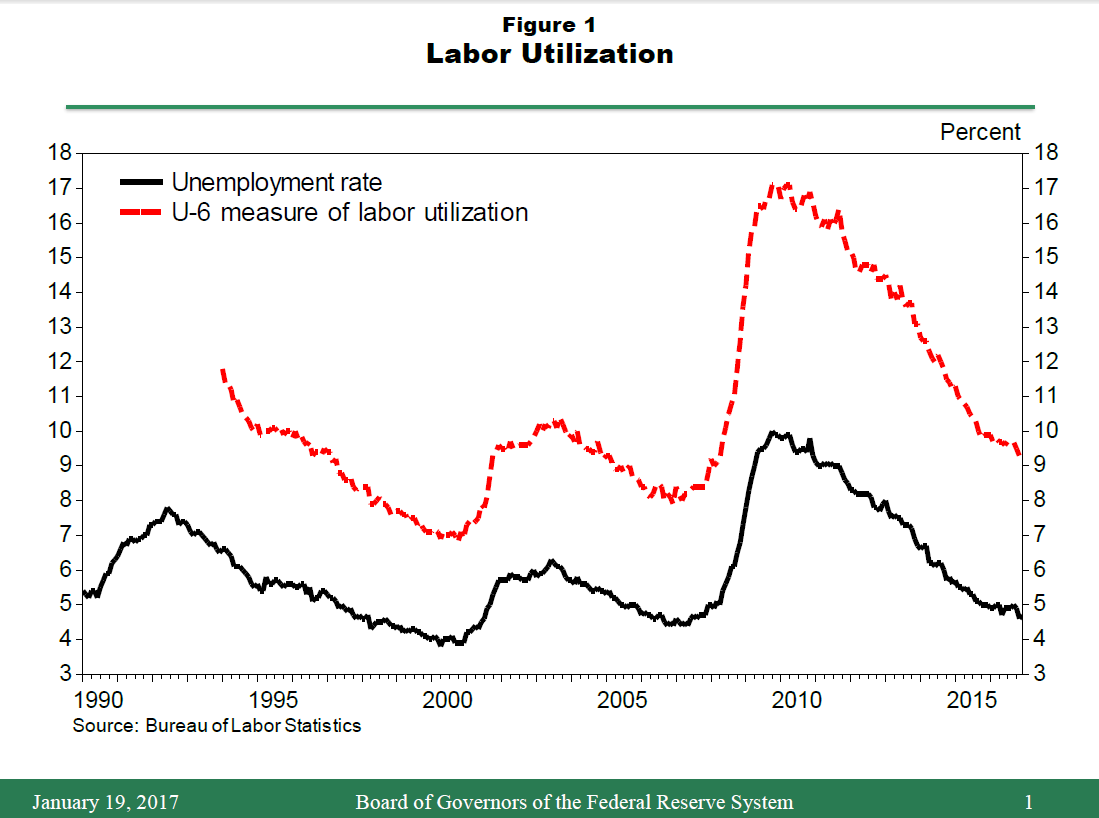
My assessment of progress to date will begin with the labor market. Since the depths of the Great Recession, about 15-1/2 million jobs have been added to the U.S. economy, on net. In 2016, job gains averaged about 180,000 per month, well above the pace of 75,000 to 125,000 per month that is probably consistent with keeping the unemployment rate stable over the longer run.1 The unemployment rate is now close to estimates of its longer-run normal level, and other measures of labor utilization have improved appreciably. As shown in figure 1, a broader measure of labor underutilization--the U-6 measure, which includes not only the unemployed but also people working part time who would like full-time employment and those who would like a job but are not actively looking--has retraced nearly all of the steep run-up that occurred as a result of the recession.2
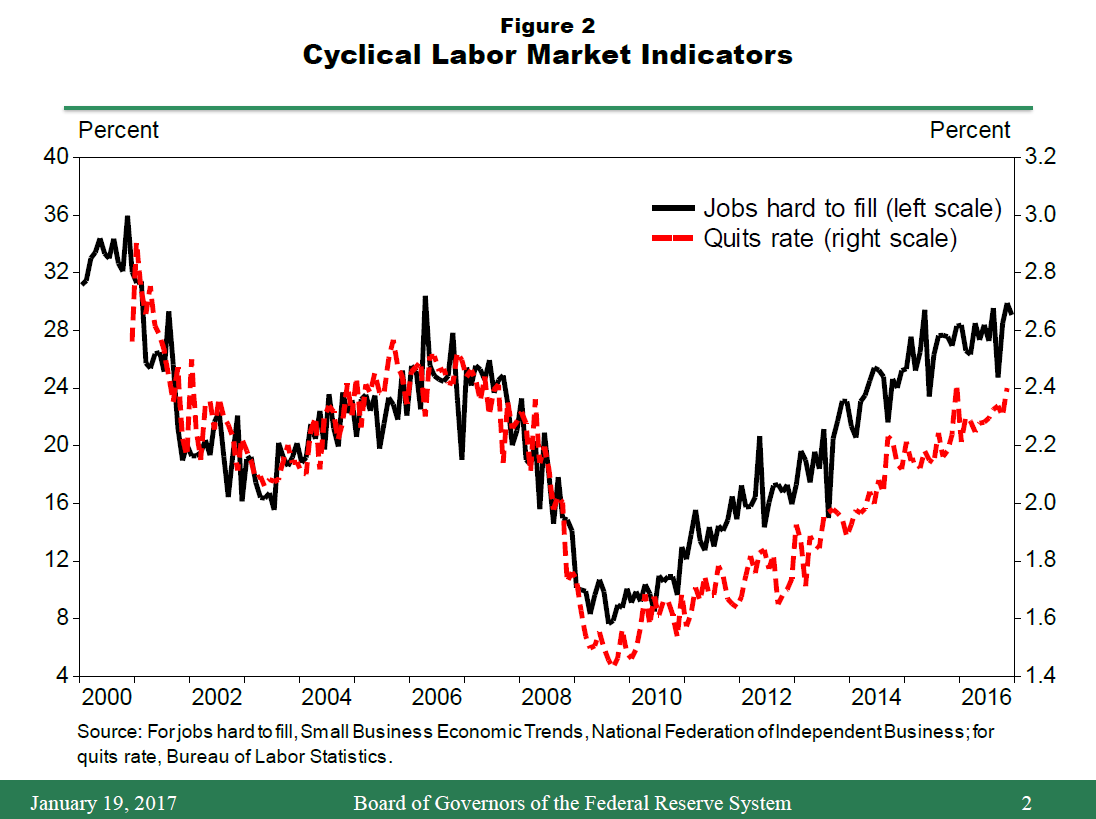
Other indicators also support the view that the labor market has largely recovered from the severe downturn that occurred in the wake of the financial crisis. As illustrated by the red dashed line in figure 2, the quits rate--an indicator of workers' confidence about leaving an existing job to pursue new opportunities--is nearly back to its pre-recession level. And some indicators, such as small businesses' assessments of the difficulty of hiring, shown by the solid black line, as well as the average length of time it takes firms to fill vacancies and the job openings rate, even suggest that the labor market is a bit tighter than before the financial crisis. Of course, both the labor force participation rate and the employment-to-population ratio are still much lower than they were a decade ago. But the cyclical element in these declines looks to have largely disappeared, and what is left seems to mostly reflect the aging of the population and other secular trends.3 Based on this array of labor market indicators, I judge labor utilization to be reasonably close to its normal longer-run level while also recognizing that estimates of the sustainable levels of the unemployment rate and the employment-to-population ratio are inherently imprecise.4
In the coming months, I expect some further strengthening in labor market conditions as the economy continues to expand at a moderate pace--a view that is shared by most of my colleagues on the Federal Open Market Committee (FOMC).5 Overall economic growth has been driven by consumer spending, which has been bolstered by substantial gains in household income and wealth. Business investment, in contrast, has been soft. But recent readings on business sentiment and new orders for equipment are consistent with the view that capital spending will likely strengthen modestly this year; another positive factor is that oil drilling, which plummeted after oil prices fell sharply back in late 2014, has recently begun to pick up. As we look to broader trends, gross domestic product (GDP) growth has been restrained in recent years by a variety of forces depressing both supply and demand, including slow labor force and productivity growth, weak growth abroad, and lingering headwinds from the financial crisis. Although I am cautiously optimistic that some of these forces will abate over time, I anticipate that they will continue to restrain overall growth over the medium term, likely holding down the level of interest rates consistent with stable labor market conditions.
Turning to inflation, we are now much closer to the FOMC's 2 percent objective than we were just a year ago. Prices, as measured by the index for personal consumption expenditures (PCE), rose nearly 1-1/2 percent in the 12 months ending in November, as compared with only 1/2 percent during 2015. Moreover, core PCE inflation--a better indicator of the underlying inflation trend--picked up 1/4 percentage point, to a little over 1-1/2 percent. This rise in inflation was anticipated and largely represents a fading of the effects of earlier declines in energy prices and the prices of non-energy imports. In addition, slack in labor and product markets is no longer placing downward pressure on inflation, in contrast to the situation only a few years ago when the unemployment rate was still quite elevated. Barring future major swings in oil prices and the foreign exchange value of the dollar, inflation is likely to move up to 2 percent over the next couple of years, aided by a strong labor market.
In light of the progress that has been achieved toward our employment and inflation objectives and the Committee's assessment of the outlook, the FOMC raised the target range for the federal funds rate at its December meeting by 25 basis points, to between 50 and 75 basis points. The Committee judges, however, that the stance of monetary policy remains modestly accommodative, and so policy should support some further strengthening in labor market conditions and thus the return of inflation to our 2 percent goal.
Maintaining Sustainable Growth in a Context of Price Stability
With the unemployment rate near its longer-run normal level and likely to move a bit lower this year, a natural question is whether monetary policy has fallen behind the curve. The short answer, I believe, is "no." It is true that many employers report difficulties in finding qualified workers in selected occupations, and that more workers are comfortable quitting jobs to take or look for better positions. But this is to be expected in a healthy labor market and not evidence that the economy as a whole is experiencing a serious worker shortage.
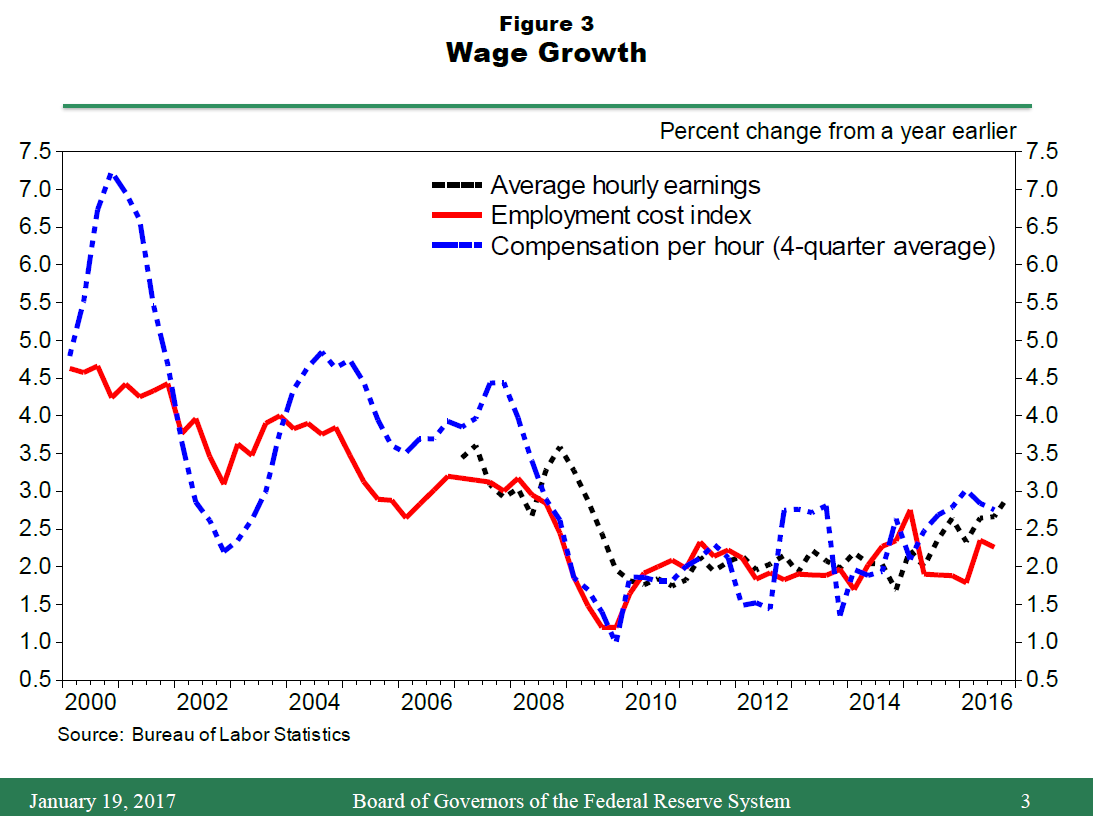
The recent behavior of wages provides additional evidence pertaining to the degree of labor market slack. As shown in figure 3, increases in average hourly earnings, the employment cost index, and compensation per hour remain subdued, picking up only modestly of late.6 Again, these data do not seem consistent with an overheated labor market. Moreover, signs of overheating in the broader economy are also scarce. For example, capacity utilization in the manufacturing sector is well below its historical average. Most importantly, although core inflation is rising gradually from a low level, this increase mainly reflects the waning of the effects of earlier movements in the dollar, not upward pressure from resource utilization.
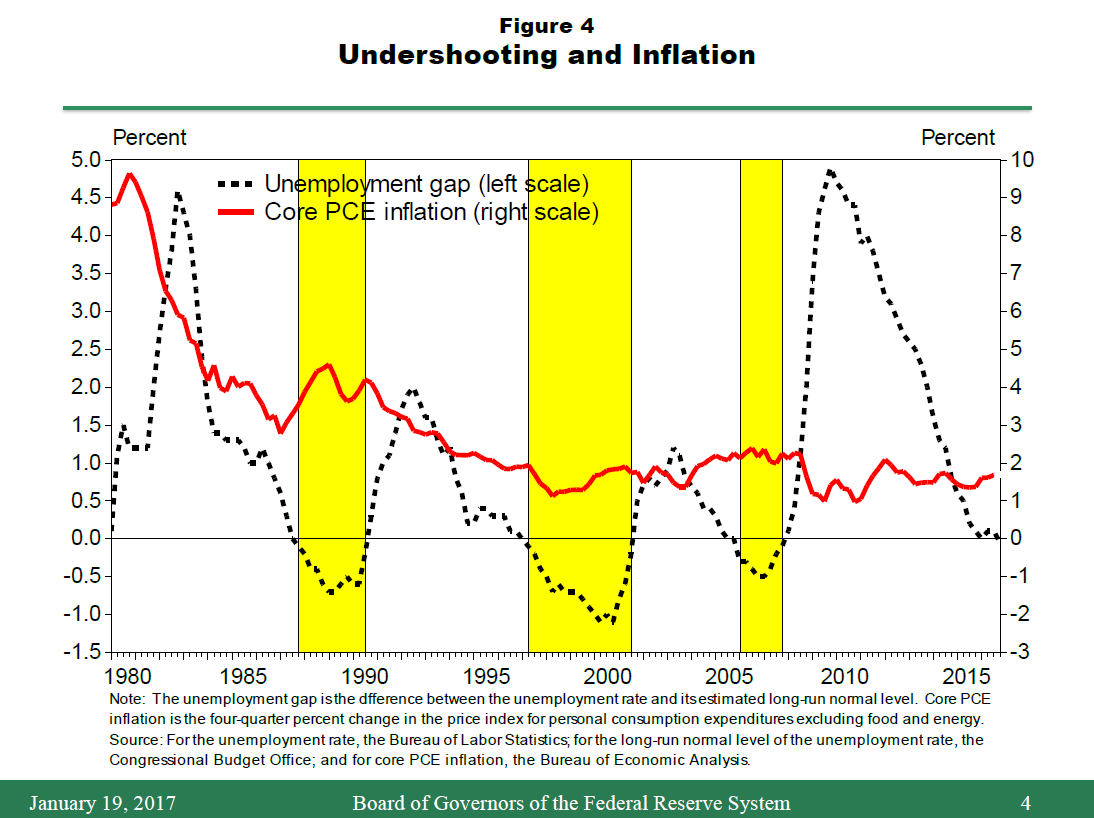
Of course, even if the labor market is not overheated currently, one might worry that overheating could rapidly emerge as labor market conditions strengthen further, causing inflation to surge. I consider this unlikely for several reasons. First, the pace of labor market improvement has slowed appreciably in the past couple of years: For example, average payroll gains moderated from 250,000 per month in 2014 to 180,000 last year, and the unemployment rate declined 1-3/4 percentage points cumulatively over 2014 and 2015, compared with only 1/4 percentage point last year.7 Second, economic growth more broadly seems unlikely to pick up markedly in the near term given the ongoing restraint from weak foreign demand and other factors that I mentioned, particularly in an environment in which monetary policy is likely to become gradually less accommodative. Finally, figure 4 illustrates the relationship over the past several decades between labor market pressures and core inflation. Note that during periods when the unemployment rate fell below the Congressional Budget Office's estimate of its normal long-run level, shown by the yellow shaded regions, core inflation, the solid red line, rose little, if at all. This stability is especially marked since inflation expectations became anchored during the mid-to-late 1990s.8
That said, I think that allowing the economy to run markedly and persistently "hot" would be risky and unwise. Waiting too long to remove accommodation could cause inflation expectations to begin ratcheting up, driving actual inflation higher and making it harder to control. The combination of persistently low interest rates and strong labor market conditions could lead to undesirable increases in leverage and other financial imbalances, although such risks would likely take time to emerge.9 Finally, waiting too long to tighten policy could require the FOMC to eventually raise interest rates rapidly, which could risk disrupting financial markets and pushing the economy into recession. For these reasons, I consider it prudent to adjust the stance of monetary policy gradually over time--a strategy that should improve the prospects that the economy will achieve sustainable growth with the labor market operating at full employment and inflation running at about 2 percent.
Evaluating the Appropriate Stance of Monetary Policy
Achieving these goals could prove challenging, however, even if the economy manages to avoid being hit with adverse shocks over the next few years. To sustain a strong job market with inflation at our 2 percent objective, policy must gradually shift toward a neutral stance, where "neutral" is defined as a level of the federal funds rate that is neither expansionary nor contractionary when the economy is operating near its potential. But what level of the federal funds rate is neutral at the present time? How quickly should the funds rate target move up to this neutral level? And how will the neutral rate itself evolve over time?
To help answer such questions, the FOMC considers a voluminous amount of information concerning many factors, including financial markets and credit availability, labor market conditions and overall economic activity, wages and prices, and foreign economic developments. The FOMC also evaluates forecasts from a range of economic models, assessments of key risks to the outlook, and detailed analyses of how different monetary policy strategies would affect projected outcomes and risks. Among the strategies routinely considered by the Committee are the recommendations of a variety of simple monetary policy rules. In addition, FOMC participants prepare individual projections on a quarterly basis of the most likely paths of key macroeconomic variables under their own assessments of "appropriate monetary policy," together with their estimates of the normal longer-run values of the federal funds rate, the unemployment rate, and GDP growth.10Armed with this wealth of information, the Committee as a whole then decides on the most appropriate policy action to adopt at each of its meetings. Such a comprehensive, forward-looking approach to policymaking is similar to that employed at other central banks.11
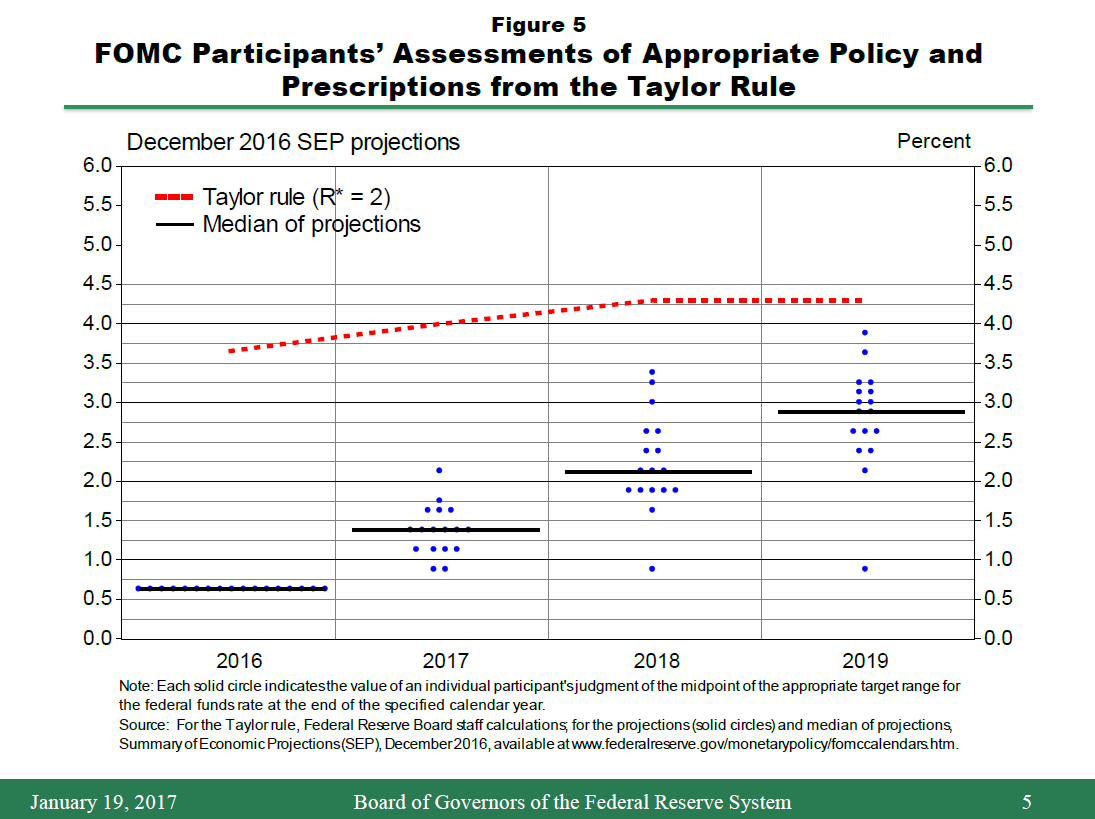
Figure 5 shows a plot of FOMC participants' most recent assessments of the appropriate path for the federal funds rate through 2019. The black solid lines show the median value of the federal funds rate at the end of each year. To understand the considerations that likely underlay these judgments, I will contrast participants' assessments with the recommendations of some simple policy rules commonly used to help gauge the appropriate stance of policy. As I noted, the Committee routinely reviews policy recommendations from a variety of benchmark rules, and I believe that their prescriptions can be helpful in providing broad guidance about how the federal funds rate should be adjusted over time in response to movements in real activity and inflation. That said, I will emphasize that the use and interpretation of such prescriptions require careful judgments about both the measurement of the inputs to these rules and the implications of the many considerations the rules do not take into account.
Consider first the well-known Taylor rule, which embodies key principles of good monetary policy. The rule calls for systematic adjustments in the federal funds rate relative to its expected longer-run neutral level in response to movements in inflation and the output gap, defined as the percentage difference between actual output and the economy's productive potential.12 To implement the rule, one must decide on the appropriate definition and measurement of its inputs. Should inflation be defined using the latest noisy quarterly reading on headline PCE inflation or a measure intended to smooth through transitory price movements? What technique should be used to approximate the output gap, given that different approaches often yield materially different estimates? And what assumption should be made about the neutral value of the federal funds rate in the longer run?
The Taylor rule is often implemented by assuming that the real, or inflation-adjusted, value of the longer-run neutral interest rate--which I will call R* for convenience--is equal to 2 percent, roughly the average historical value of the real federal funds rate prior to the financial crisis. For inflation, we can use the 12-month change in core PCE prices, a measure of the current underlying rate of inflation. And the output gap can be reasonably approximated as twice the difference between the estimated longer-run normal rate of unemployment and the actual unemployment rate.13 The dashed red line in figure 5 shows the resulting recommendations for policy over the medium term, based on the medians of the unemployment and inflation projections submitted by FOMC participants in December but assuming--in contrast to the median of participants' December assessments--that R* equals 2 percent. As figure 5 shows, this version of the Taylor rule prescribes a much higher path for the federal funds rate than the median of participants' assessments of appropriate policy.
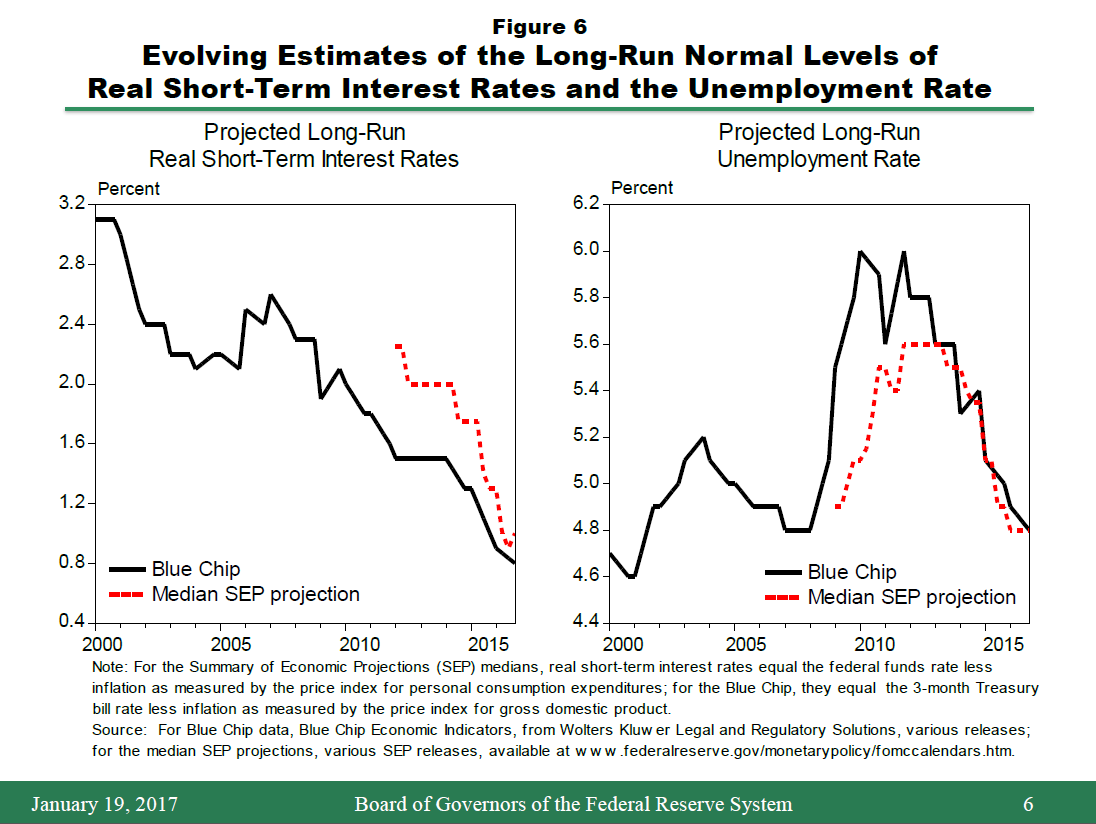
One important factor explaining this divergence is the FOMC's growing recognition that the longer-run neutral level of the real federal funds rate has likely declined below 2 percent, contrary to what is often assumed in implementations of the Taylor rule. As illustrated by the left-hand panel of figure 6, since 2000, both FOMC participants and respondents to the Blue Chip survey have markedly reduced their projections of the level of real short-term interest rates expected to prevail in the longer run. Presumably, these revisions were made in response to accumulating evidence that lower real interest rates than those seen on average in the past would be needed permanently to keep the economy operating on an even keel. In addition, the right-hand panel shows considerable changes over time in estimates of the normal longer-run rate of unemployment, with corresponding implications for estimates of the economy's productive potential and the output gap. Such revisions would imply shifts in the level of the Taylor rule's prescriptions by as much as 1-1/4 percentage points, holding other factors constant.14 Clearly, sensible implementation of policy rules requires adjustments to take such changes into account, as a failure to do so would result in poor monetary policy decisions and poor economic outcomes.15
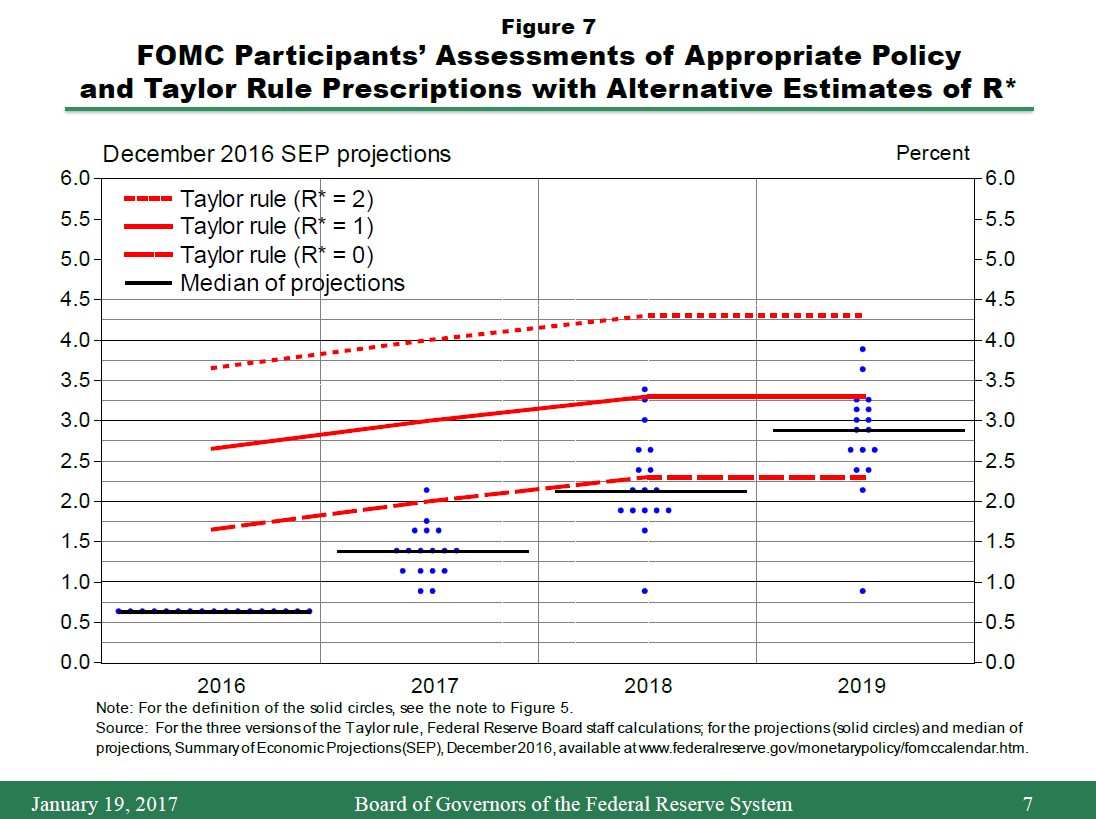
Figure 7 illustrates the policy implications of alternative revised assessments of the longer-run neutral real rate of interest. As before, the short-dashed red line shows the prescriptions of the Taylor rule using the standard 2 percent assumption for R*. The solid red line, however, shows the rule's prescriptions with R* equal to 1 percent, the median of the longer-run projections of the real federal funds rate made by FOMC participants last month. This adjustment appreciably reduces the rule's policy prescriptions.
Even with this downward adjustment of the longer-run neutral rate, however, the Taylor rule's prescriptions are arguably still too restrictive. The problem is that the rule ignores the likelihood that it will likely take many years before the forces now restraining the economy dissipate to the degree envisioned in participants' estimates of the longer-run normal level of the real federal funds rate. Because overall growth has been quite moderate over the past few years despite an accommodative stance of monetary policy, some recent estimates of the current value of the neutral real federal funds rate stand close to zero.16 If the neutral rate were to remain quite low over the medium term, as would be expected if the global economy does not materially strengthen and productivity growth remains anemic, then the appropriate setting for R* in the Taylor rule would arguably be zero, yielding a yet lower path for the federal funds rate, as shown by the long-dashed red line. These considerations illustrate that there is now no obvious "right" setting for R* because we do not know how rapidly the forces restraining the economy will abate, and there is a significant risk that it could be very slow. When the economy has been hit with unusually persistent shocks, the Taylor rule, for this reason, provides a problematic benchmark.
Simple policy rules also typically neglect information with potentially important implications for the economic outlook because they focus only on where conditions are today. For example, simple rules ignore such important factors as fiscal policy, trends affecting global growth, structural developments influencing the supply of credit, and overall financial conditions. One special factor at the moment pertains to the Federal Reserve's balance sheet. The downward pressure on longer-term interest rates that the Fed's asset holdings exert is expected to diminish over time--a development that amounts to a "passive" removal of monetary policy accommodation. Other things being equal, this factor argues for a more gradual approach to raising short-term rates.17
Lastly, simple rules ignore important risk-management considerations that have influenced the Committee's decisions in recent years. With the federal funds rate still near zero, the Committee recognizes that, should the economy unexpectedly weaken in the next year or two, there would likely be only limited scope to respond by lowering short-term rates. But if the economy instead began to overheat, threatening to push inflation to an undesirably high level, the FOMC would have ample scope to respond through tighter monetary policy. Such asymmetric risks arguably call for a more gradual path of rate increases than indicated by the prescriptions of a simple policy rule.
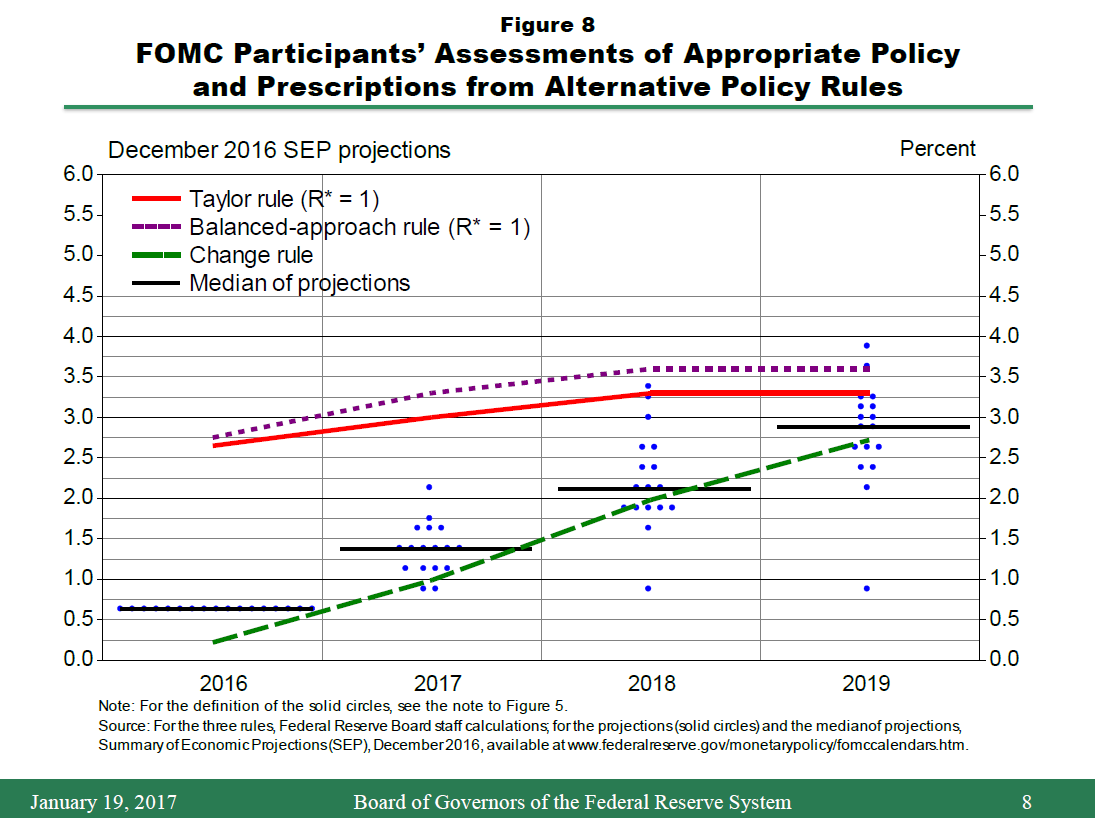
The academic literature on policy rules has studied many alternatives to the Taylor rule, and the FOMC regularly reviews a number of them.18 These rules embed differing but valuable perspectives, and there is no consensus among central bankers or academics about the relative utility of various rules. One such alternative is the "balanced approach" rule, illustrated by the purple short-dashed line in figure 8. This rule differs from the Taylor rule by being twice as responsive to movements in resource utilization.19 The prescriptions of the balanced-approach rule in this figure, as with the solid red Taylor-rule plot, assume that R* equals 1 percent, consistent with the medians of the latest FOMC projections. Because participants on average anticipate a modest undershooting of the unemployment rate below its estimated longer-run level, the balanced-approach rule calls for a slightly faster pace of tightening over the next several years than the Taylor rule.
Figure 8 also reports results for a "change" rule, shown as the green long-dashed line. As its name implies, this rule does not prescribe a particular level of the federal funds rate at a given time but rather how the existing rate should change from quarter to quarter based on two gaps--the difference between inflation and its desired level as well as the difference between the unemployment rate and its longer-run normal level.20 In contrast to the other two rules, the change rule does not take a stand on the value of the longer-run neutral level of the real federal funds rate, thus avoiding a potential source of error. Instead, it moves interest rates up and down until both gaps close, an approach that in theory enables it to perform well when the true value of R* is unknown. Because both gaps are relatively modest at the moment and are projected to remain so, the change rule calls for fairly gradual adjustments in the stance of monetary policy over the next few years given the current outlook.
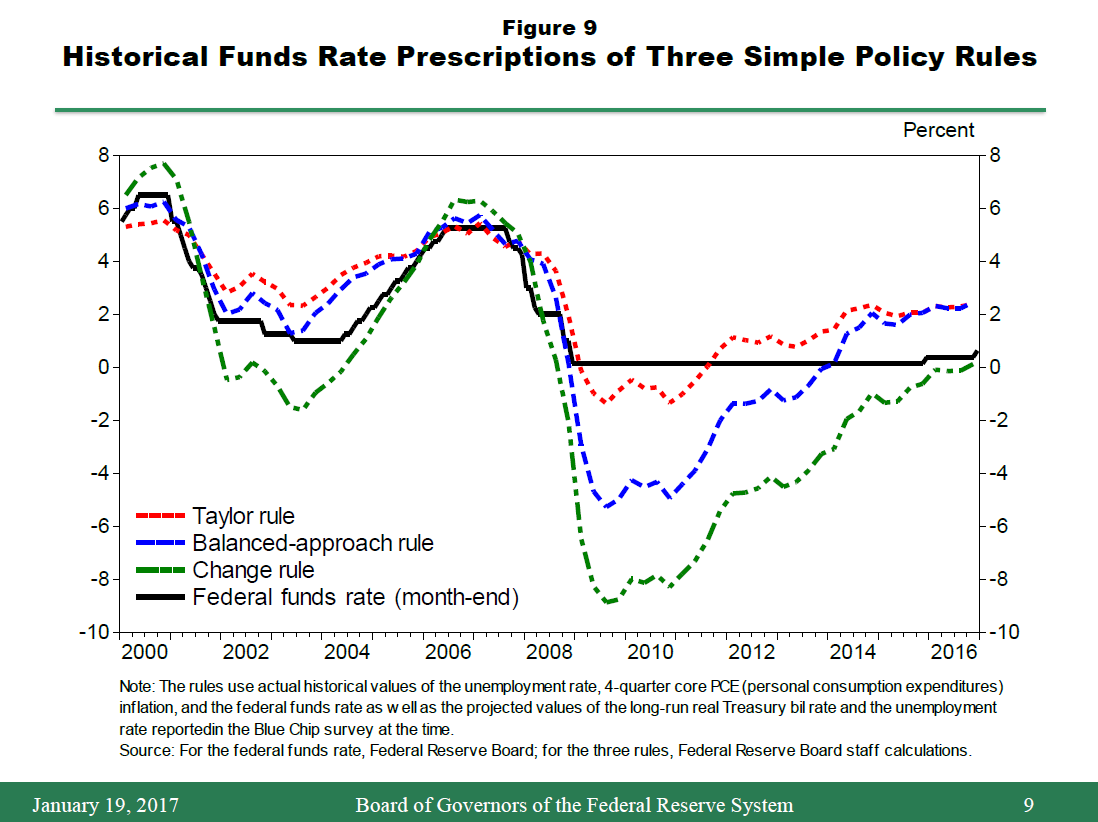
The FOMC, for reasons that I have discussed, does not base its decisions on the prescriptions of any specific policy rule. Nevertheless, the three benchmarks I have described--the Taylor rule, the balanced-approach rule, and the change rule, appropriately calibrated--have historically provided useful guidance about appropriate adjustments in the general direction of monetary policy over time. This guidance is illustrated by figure 9, which compares the path of the federal funds rate since 2000 with the prescriptions of the three rules, based on the actual rates of inflation and unemployment observed at each point in time, along with contemporaneous Blue Chip projections of the longer-run unemployment rate and R*.
As the figure shows, the rules clearly signaled that a major reduction in the federal funds rate was appropriate in 2008 given the marked deterioration in economic conditions. In addition, all three rules signaled that monetary policy needed to provide more stimulus during the recession and the subsequent recovery than could be provided by keeping short-term interest rates near zero. For this reason, the Committee turned to asset purchases to help make up for the shortfall by putting additional downward pressure on longer-term interest rates. The FOMC also sought to compensate for its inability to push the federal funds rate below zero by indicating that the funds rate would need to stay unusually low for longer than would otherwise be expected and simple policy rules would prescribe.21 Under this "make up" strategy, and taking into account the reasons for deviating from the Taylor rule that I discussed a moment ago, the Committee kept the federal funds rate near zero for longer than two of the rules would have prescribed. But as labor market conditions continued to improve over time, the rising trajectories for the federal funds rate prescribed by all three rules signaled that the time was drawing near to begin gradually reducing monetary accommodation. Consistent with this advice, the FOMC suspended its asset purchase program in mid-2014 and began raising the federal funds rate in late 2015.22
To sum up, simple policy rules can serve as useful benchmarks to help assess how monetary policy should be adjusted over time. However, their prescriptions must be interpreted carefully, both because estimates of some of their key inputs can vary significantly and because the rules often do not take into account important considerations and information pertaining to the outlook. For these reasons, the rules should not be followed mechanically, since doing so could have adverse consequences for the economy.
Conclusion
My remarks have focused on the policy trajectory that the Committee now considers likely to be appropriate to sustain the economic expansion while keeping inflation close to our 2 percent goal. In concluding, it is important to emphasize the considerable uncertainty that attaches to such assessments and the need to constantly update them.
In particular, the path of the neutral federal funds rate, which plays an important role in determining the appropriate policy path, is highly uncertain. For example, productivity growth is a key determinant of the neutral rate, and while most forecasters expect productivity growth to pick up from its recent unusually slow pace, the timing of such a pickup is highly uncertain. Indeed, there is little consensus among researchers about the causes of the recent slowdown in productivity growth that has occurred both at home and abroad.23 The strength of global growth will also have an important bearing on the neutral rate through both trade and financial channels, and here, too, the scope for surprises is considerable. Finally, I would mention the potential for changes in fiscal policy to affect the economic outlook and the appropriate policy path. At this point, however, the size, timing, and composition of such changes remain uncertain.24 However, as this discussion highlights, the course of monetary policy over the next few years will depend on many different factors, of which fiscal policy is just one.
References
Aaronson, Stephanie, Tomaz Cajner, Bruce Fallick, Felix Galbis-Reig, Christopher Smith, and William Wascher (2014). "Labor Force Participation: Recent Developments and Future Prospects (PDF)," Brookings Papers on Economic Activity, Fall, pp. 197-255.
Brynjolfsson, Erik, and Andrew McAfee (2014). The Second Machine Age: Work, Progress, and Prosperity in a Time of Brilliant Technologies. New York: W.W. Norton.
Decker, Ryan A., John Haltiwanger, Ron S. Jarmin, and Javier Miranda (2016). "Declining Business Dynamism: What We Know and the Way Forward," American Economic Review, vol. 106 (May), pp. 203-07.
--------- (forthcoming). "Where Has All the Skewness Gone? The Decline of High-Growth (Young) Firms in the U.S.," European Economic Review.
Engen, Eric M., Thomas Laubach, and David Reifschneider (2015). "The Macroeconomic Effects of the Federal Reserve's Unconventional Monetary Policies (PDF)," Finance and Economics Discussion Series 2015-005. Washington: Board of Governors of the Federal Reserve System, January.
Fernald, John, and Bing Wang (2015). "The Recent Rise and Fall of Rapid Productivity Growth (PDF)," FRBSF Economic Letter 2015-04. San Francisco: Federal Reserve Bank of San Francisco, February 9.
Golden, Lonnie (2016). Still Falling Short on Hours and Pay: Part-Time Work Becoming the New Normal (PDF), Economic Policy Institute. Washington: EPI, December.
Gordon, Robert J. (2016). The Rise and Fall of American Growth: The U.S. Standard of Living since the Civil War. Princeton, N.J.: Princeton University Press.
Holston, Kathryn, Thomas Laubach, and John C. Williams (2016). "Measuring the Natural Rate of Interest: International Trends and Determinants (PDF)," Finance and Economics Discussion Series 2016-073. Washington: Board of Governors of the Federal Reserve System, August.
Ihrig, Jane, Elizabeth Klee, Canlin Li, Brett Schulte, and Min Wei (2012). "Expectations about the Federal Reserve's Balance Sheet and the Term Structure of Interest Rates (PDF)," Finance and Economics Discussion Series 2012-57. Washington: Board of Governors of the Federal Reserve System, July.
Li, Canlin, and Min Wei (2013). "Term Structure Modeling with Supply Factors and the Federal Reserve's Large-Scale Asset Purchase Programs," International Journal of Central Banking, vol. 9 (March), pp. 3-39.
Nechio, Fernanda, and Glenn D. Rudebusch (2016). "Has the Fed Fallen behind the Curve This Year? (PDF)" FRBSF Economic Letter 2016-33. San Francisco: Federal Reserve Bank of San Francisco, November 7.
Reifschneider, David L., and John C. Williams (2000). "Three Lessons for Monetary Policy in a Low-Inflation Era," Journal of Money, Credit and Banking, vol. 32 (4), 936-66.
Svensson, Lars E.O. (2005). "Monetary Policy with Judgment: Forecast Targeting," International Journal of Central Banking, vol. 1 (May), pp. 1-54.
Taylor, John B. (1993). "Discretion versus Policy Rules in Practice," Carnegie-Rochester Conference Series on Public Policy, vol. 39, pp. 195-214.
--------- (1999). "A Historical Analysis of Monetary Policy Rules," in John B. Taylor, ed., Monetary Policy Rules. Chicago: University of Chicago Press, pp. 319-41.
Taylor, John B., and John C. Williams (2010). "Simple and Robust Rules for Monetary Policy," in Benjamin M. Friedman and Michael Woodford, eds., Handbook of Monetary Economics, vol. 3. Amsterdam: Elsevier, pp. 829-59.
Werning, Ivan (2012). "Managing a Liquidity Trap: Monetary and Fiscal Policy (PDF)," working paper, Massachusetts Institute of Technology, March.
Woodford, Michael (2012). "Methods of Policy Accommodation at the Interest-Rate Lower Bound (PDF)," paper presented at "The Changing Policy Landscape," a symposium sponsored by the Federal Reserve Bank of Kansas City, held in Jackson Hole, Wyo., August 30-September 1, pp. 185-288.
Yellen, Janet (2016). "The Federal Reserve's Monetary Policy Toolkit: Past, Present, and Future," speech delivered at "Designing Resilient Monetary Policy Frameworks for the Future," a symposium sponsored by the Federal Reserve Bank of Kansas City, held in Jackson Hole, Wyo., August 26.
1. The sustainable longer-run pace of payroll employment growth depends on a number of a factors, such as the growth rate of the working-age population, trend movements in labor force participation, and the prevalence of self-employment and multiple job holdings, so it cannot be predicted with precision. Return to text
2. The normal level of the U-6 measure may now be somewhat higher than it was prior to the financial crisis because of a trend toward greater reliance on part-time workers in many sectors. See Golden (2016). Return to text
3. See Aaronson and others (2014). Return to text
4. In addition, a persistently strong labor market could potentially lead some firms to rely less on part-time workers, or might encourage some people to rejoin the labor force who would otherwise sit on the sidelines. However, evidence on these sorts of endogenous supply-side effects is rather limited, as I noted in a recent speech (see Yellen, 2016). Return to text
5. A summary of the projections submitted by Committee participants for the December 2016 FOMC meeting can be found at www.federalreserve.gov/monetarypolicy/fomcprojtabl20161214.htm. Return to text
6. An exception to this pattern is the Atlanta Fed's Wage Growth Tracker (WGT), which does show a noticeable acceleration in hourly wages as self-reported in the Current Population Survey. Like average hourly earnings, the WGT excludes benefits costs and so is less comprehensive than the ECI or business-sector compensation per hour (CPH). In addition, the WGT is based on a smaller sample than the measures shown in Figure 3 and it only covers a sub-set of the workforce--specifically, employed individuals who were also employed a year ago, and whose earnings are less than $150,000 per year. Finally, because average hourly earnings and business-sector CPH are measured as total wages divided by total hours, an increase in wages for high earners has a larger effect in those measures than a similarly proportioned increase for lower-wage workers, and this is not so for the WGT. Return to text
7. Many other labor market indicators also improved more slowly in 2016 relative to the pace seen in the prior two years, including the U-6 measure of labor utilization, the rates of job openings, hiring and quits, survey readings on net hiring plans and the difficulty of filling vacancies, and the average duration of unemployment. A notable exception to this general pattern is the labor force participation rate, which declined fairly steadily from 2007 through 2015 but then flattened out last year despite continuing downward pressure from the aging of the population and other factors. However, improvements in labor market conditions along this dimension arguably reflect an increase in potential output, and so they are probably not a source of inflationary pressures. Return to text
8. During the late 1960s through the 1970s, however, inflation did rise noticeably whenever the unemployment rate moved below its longer-run normal level, primarily because the Federal Reserve did not adequately check persistent movements in inflation by tightening monetary policy, thereby allowing inflation expectations to drift. This experience illustrates the importance of keeping inflation expectations anchored through systematic policy actions. Return to text
9. The Federal Reserve closely monitors a wide range of indicators of financial stability, which currently provide little evidence of significant increases in leverage or rapid growth in credit. However, some asset valuations, particularly for commercial real estate, are high. With regard to the linkages between labor utilization and financial stability, my interpretation of the historical evidence is that undesirable increases in leverage or the emergence of asset bubbles are not the inevitable consequence of tight labor markets per se. Return to text
10. These individual projections are published quarterly in the Summary of Economic Projections that accompanies the release of the minutes from the March, June, September and December meetings of the FOMC. Return to text
11. The FOMC's procedures share many of the features of forecast targeting, an approach to monetary policymaking advocated by Svensson (2005), among others. However, while the Committee publishes participants' projections--including policy paths--in the SEP, it does not publish a "consensus" forecast, in contrast to some other central banks. Return to text
12. Formally, the rule originally published by Taylor (1993) can be written as $$ R_{t} = R^{*} + \pi_{t} + 0.5\left(\pi_{t}-\pi^{*}\right) + 0.5Y_{t}$$, where $$ R$$ is the federal funds rate, $$ R^{*}$$ is the level of the real federal funds rate that on average is expected to be consistent with sustaining maximum employment and stable inflation in the longer run, $$ \pi$$ is current inflation, $$ \pi^{*}$$ is the central bank's inflation objective (2 percent, in the case of the Federal Reserve), and $$ Y$$ is the output gap, defined as the difference between the current level of real GDP and what it would be if the economy was operating at maximum employment. Importantly, the rule embodies three key principles that central banks take into account when setting policy to stabilize inflation and the overall economy. First, a persistent movement in inflation requires a more than one-for-one response of the policy rate to stabilize inflation. Second, monetary policy should raise real interest rates above their normal longer-run level whenever inflation is above its desired level and resource utilization is higher than normal, and lower them when the opposite holds. (Note that implementing this latter principle requires estimates of both the economy's productive potential and the longer-run level of the real policy rate that would be consistent with keeping the economy operating on an even keel.) And, finally, policymakers should respond in a systematic manner to changes in economic conditions in order to help financial market participants and others better understand how policy is likely to respond over time to current and future events, thereby influencing expectations in a way that promotes economic stability. Return to text
13. Historically, percent deviations of real GDP from statistical estimates of its long-run trend are roughly twice as large on average as deviations of the unemployment rate from its estimated long-run value--a relationship known as Okun's law. Return to text
14. Additional complications arise in the measurement of economic slack because the difference between the unemployment rate and its estimated normal level is not always a complete gauge of overall labor utilization. Such was the case in the current expansion until recently because the labor force participation rate was unusually low and involuntary part-time employment unusually high, given the level of the unemployment rate. Moreover, although movements in resource utilization for the economy as a whole are generally proportional to changes in labor utilization, the relationship varies somewhat over time. Partly as a result, contemporaneous estimates of the output gap can deviate markedly from subsequent estimates for the same period calculated using revised data. For example, in early 2010, the Congressional Budget Office (CBO) estimated that the output gap in 2009:Q2 was negative 7.7 percent, but the CBO has since lowered it to negative 6.3 percent--a large revision with important implications for assessments of the deviation of actual policy from the prescriptions of simple policy rules. Return to text
15. If monetary policy persistently followed the prescriptions of a Taylor rule that assumed that R* was 2 percent when it was in fact 1 percent, then employment would run persistently below its maximum sustainable level and inflation would run persistently below 2 percent. Under such circumstances, inflation expectations might begin to fall, creating a risk of deflation. Return to text
16. For example, see Holston, Laubach, and Williams (2016). Return to text
17. Based on estimates generated using the term-structure model developed by Li and Wei (2013) and the procedure discussed in Ihrig and others (2012) and extended by Engen, Laubach, and Reifschneider (2015), the Federal Reserve's holdings of Treasury securities and agency mortgage-backed securities continue to put considerable downward pressure on longer-term interest rates. However, this pressure is estimated to be gradually easing as the average maturity of the portfolio declines and the end-date for reinvestment draws closer. Over the course of 2017, this easing could increase the yield on the 10-year Treasury note by about 15 basis points, all else being equal. Based on the estimated co-movement of short-term and long-term interest rates, such a change in longer-term yields would be similar to that which, on average, has historically accompanied two 25 basis point hikes in the federal funds rate. Return to text
18. For example, prescriptions from seven different rules, calculated using forecasts of economic activity and inflation from different sources, are regularly posted by the Federal Reserve Bank of Cleveland at https://www.clevelandfed.org/our-research/indicators-and-data/simple-monetary-policy-rules.aspx. Return to text
19. The balanced-approach rule is $$ R_{t} = R^{*} + \pi_{t} + 0.5\left(\pi_{t}-\pi^{*}\right) + 1.0Y_{t}$$, where all terms are defined as in the Taylor rule. (See note 12 for details.) As noted by Taylor (1999), research suggests that this rule may do a better job than the Taylor rule in stabilizing real activity and inflation. Return to text
20. The change rule is $$ R_{t} = R_{t-1} + 1.2\left(\pi_{t}-2\right) + 2.0\left(U^{*}-U_{t}\right)$$, where $$ R$$ is the federal funds rate, $$ \pi$$ is four-quarter rate of core PCE inflation, $$ U^{*}$$ is the projected longer-run unemployment rate, and $$ U$$ is the current unemployment rate. In computing the prescriptions for the change rule shown in figure 8, the midpoint of the target range for the federal funds rate prior to the December 2016 FOMC meeting, 0.38 percent, is used as the starting point. For a discussion of this rule (and of policy rules in general), see Taylor and Williams (2010). Return to text
21. For example, the FOMC advised in the statement released after its December 2012 meeting that conditions would likely warrant keeping the funds rate near zero at least as long as the unemployment rate was above 6-1/2 percent--a threshold that was not passed until mid-2014. As discussed by Reifschneider and Williams (2000), Werning (2012), and Woodford (2012), this type of lower-for-longer guidance can help compensate for the constraint on monetary policy created by the zero lower bound on nominal interest rates. Engen, Laubach, and Reifschneider (2015) find that the FOMC's guidance, together with its asset purchases, provided significant economic stimulus in the years following the financial crisis. Return to text
22. For a closer look at the FOMC's policy actions in 2016 and their relationship to previous forecasts and subsequent changes in economic conditions, see Nechio and Rudebusch (2016). Return to text
23. To sample some of the different views about the sources of the recent slowdown in productivity growth and the prospects for faster growth in the future, see Gordon (2016), Fernald and Wang (2015), Brynjolfsson and McAfee (2014), and Decker and others (2016, forthcoming). Return to text
24. A related source of uncertainty is the limited ability of economists to predict the effects of specific changes in tax policy or government spending on the overall economy. In part, this uncertainty arises because the net effect depends to some extent on the response of financial markets; in addition, estimates vary considerably on the economic effects of changes in marginal tax rates or different types of spending. Return to text