
Dodd-Frank Act Stress Test 2014: Supervisory Stress Test Methodology and Results
 Print
Print- Supervisory Stress Test Framework and Model Methodology
- Revised Capital Framework
- Supervisory Stress Test Results
- Appendix A: Supervisory Scenarios
Supervisory Stress Test Framework and Model Methodology
Analytical Framework
In this Section:
The effect of the supervisory scenarios on the regulatory capital ratios of the 30 BHCs is estimated by projecting the balance sheet, RWAs, and net income for each BHC over a nine-quarter planning horizon ending in the fourth quarter of 2015.
Projected net income is combined with the capital action assumptions prescribed in the Federal Reserve's Dodd-Frank Act stress test rules to project changes in equity capital. Changes in equity capital drive changes in regulatory capital, which combined with projected RWAs and assets, determine changes in regulatory capital ratios. This approach is consistent with U.S. generally accepted accounting principles (GAAP) and regulatory capital rules and provides a perspective on the capital of the BHCs and on the primary determinants of the projected changes in capital over time (earnings and capital actions).
Projected net income for the 30 BHCs is generated from individual projections of revenue, expenses, and various types of losses and provisions that flow into pre-tax net income, including:
- loan losses and changes in the allowance for loan and lease losses (ALLL);
- losses on loans held for sale (HFS) and measured under the fair-value option (FVO);
- other-than-temporary impairment (OTTI) losses on investment securities;
- expenses related to operational-risk events, including potential costs from unfavorable litigation outcomes;
- expenses related to the disposition of foreclosed properties;
- expenses related to demands by mortgage investors to repurchase loans deemed to have breached representations and warranties or related to litigation (mortgage repurchase/put-back losses);
- for BHCs with large trading and private equity exposures, losses on those exposures resulting from a global market shock; and,
- for BHCs with substantial trading or custodial operations, losses from the default of their largest counterparty.
Projected pre-tax net income, in turn, flows into a calculation of regulatory capital measures that accounts for taxes and deductions that limit the recognition of certain intangible assets and impose other restrictions, as specified in U.S. regulatory capital guidelines.21 The projections incorporate changes in the calculation of regulatory capital over the planning horizon as phased in under the Board's revised regulatory capital framework. Figure 8 illustrates the framework used to calculate changes in net income and regulatory capital.
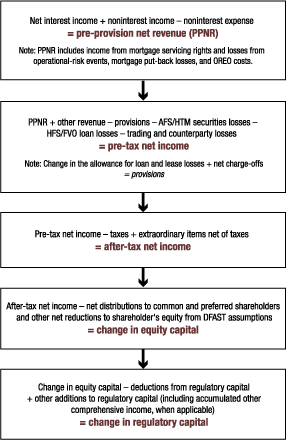
The framework begins with a projection of PPNR, which equals projected net interest income plus non-interest income minus noninterest expense. Consistent with U.S. GAAP, the PPNR projection incorporates projected losses generated by operational-risk events such as fraud, computer system or other operating disruptions, and litigation-related costs; mortgage repurchase losses; and expenses related to the disposition of foreclosed properties (other real estate owned (OREO) expenses).
The PPNR projection flows into the projection of pre-tax net income, which equals the PPNR projection, plus other revenue, minus provisions to the ALLL, OTTI losses on securities, losses on trading and counterparty positions from the global market shock, losses from the largest counterparty default, and losses on loans held for sale and measured under the fair-value option. Net income projections also incorporate extraordinary items.
Provisions for loan and lease losses equal projected loan losses for the quarter plus the amount needed for the ALLL to be at an appropriate level at the end of the quarter, which is a function of projected future loan losses. The amount of provisions over and above loan losses may be negative--representing a drawdown of the ALLL (an ALLL release, increasing net income)--or positive-- representing a need to build the ALLL (an additional provision, decreasing net income) during the quarter.
Projected loan losses for the quarter are estimated separately for different categories of loans, based on the type of obligor (e.g., consumer or commercial and industrial), collateral (e.g., residential real estate, commercial real estate), loan structure (e.g., revolving credit lines), and accounting treatment (accrual or fair value). These categories generally follow the major regulatory report classifications, though some loss projections are made for more granular loan categories than those included on BHC regulatory reports.22
Because the loss projections follow U.S. GAAP and regulatory guidelines, they incorporate any differences in the way these guidelines recognize income and losses based upon where assets are held on the BHCs' balance sheets. As a result, losses projected for similar or identical assets held in different portfolios can sometimes differ. For example, losses on loans held in accrual portfolios equal credit losses due to failure to pay obligations (cash flow losses resulting in net charge-offs). For similar loans that are held for sale, projected losses represent the change in the market value on the underlying asset under the supervisory scenarios.
Both changes in the fair value of AFS securities and OTTI losses on securities are projected over the nine-quarter planning horizon. Under U.S. GAAP, changes in the fair value of AFS securities are reflected in changes in AOCI but do not flow through net income. For DFAST, AOCI is gradually phased into the calculation of tier 1 capital for advanced approaches BHCs starting in 2014, consistent with the revised regulatory capital rules (for more information on OCI and AOCI in DFAST 2014, see box 1). In addition, if a security becomes OTTI then all or a portion of the difference between the fair value and amortized cost of the security must be recognized in earnings.23 Consistent with U.S. GAAP, OTTI projections incorporate other-than-temporary differences between book value and fair value due to credit impairment. The projections, however, do not incorporate differences reflecting changes in liquidity or market conditions. As with the accrual loan portfolio, loss projections for different categories of securities are made based on obligor, collateral or underlying cash flow, and security structure. These categories include various types of securitized obligations (e.g., commercial and residential mortgage-backed securities), corporate bonds, municipal bonds, and sovereign bonds.
For the six BHCs with large trading and private-equity exposures, losses on trading and private equity positions, and from credit valuation adjustment (CVA) are projected assuming an instantaneous re-pricing of positions under the global market shock. Losses related to the global market shock are assumed to occur in the first quarter of the planning horizon. No subsequent recoveries on these positions are assumed, nor are there offsetting changes such as reductions in compensation or other expenses in reaction to the global market shock. In addition, losses from potential defaults of obligors underlying BHCs' trading positions are projected over the nine-quarter planning horizon, and the incremental losses above mark-to-market losses are projected.
In addition, the losses associated with the instantaneous and unexpected default of the largest counterparty across their derivatives and securities financing transaction (SFT) activities are projected for each of eight BHCs with substantial trading or custodial operations.24 Similar to the global market shock component, the counterparty default component is treated as an add-on to the macroeconomic conditions and financial market environment specified in the adverse and severely adverse scenarios. All losses and any assumed recoveries are assumed to occur in the first quarter of the planning horizon. The recovery value equals the value at the time of default as reflected in market prices.
The projections of revenues, expenses, and losses are based on the Federal Reserve's projections of the balance sheet for each BHC over the planning horizon. These balance sheet projections are derived using a common framework for determining the impact of the scenarios on balance sheet growth, and incorporate assumptions about credit supply that limit aggregate credit contraction (see box 2). Any new loan balances implied by the balance sheet projections are generally assumed to have the same risk characteristics as loans held by the BHC at the start of the planning period.
Balance sheet projections incorporated expected changes to a BHC's business plan, such as mergers, acquisition, and divestitures, that are likely to have a material impact on the its capital adequacy and funding profile. BHC-submitted data were used to adjust the projected balance sheet in the quarter when the change was expected to occur. Once adjusted, assets were assumed to grow at the same rate as the pre-adjusted balance sheet. Only divestitures that were either completed or contractually agreed upon before January 6, 2014, were incorporated. The inclusion of the effects of such expected changes to a BHC's business plan does not--and is not intended to--express a view on the merits of such proposals and is not an approval or non-objection to such plans.
After-tax net income (or loss) is calculated by applying a consistent tax rate to pre-tax net income (or loss) for all BHCs.25 Along with each BHC's assumed capital actions under the Federal Reserve's Dodd-Frank Act stress test rules, after-tax net income is the primary determinant of projected changes in equity capital which, in turn, determines projected changes in the regulatory capital measures. Capital ratios are calculated using assets and RWAs projected by the Federal Reserve.
Box 1. Accumulated Other Comprehensive Income in Regulatory Capital
BHCs with total consolidated assets of $250 billion or more or on-balance-sheet foreign exposures of $10 billion or more (advanced approaches BHCs) must include a percentage of certain accumulated other comprehensive income (AOCI) items in their regulatory capital beginning in the second quarter of the planning horizon (the first quarter of 2014). Under the transition provisions of the revised capital framework, regulatory capital for advanced approaches BHCs must include 20 percent of eligible AOCI in 2014 and 40 percent in 2015. Non-advanced approaches BHCs may elect to opt out of including AOCI in capital. For the purpose of DFAST 2014, the Federal Reserve assumed that all non-advanced approaches BHCs would opt out of including AOCI.
The AOCI eligible for inclusion in capital is composed of four elements (1) actuarial gain and losses on defined contribution pension plans, (2) unrealized gains and losses on qualifying cash flow hedges, 1 (3) foreign currency translation adjustments, and (4) unrealized gains and losses on AFS securities and also on HTM securities that have experienced OTTI. The value of AOCI at the beginning of the planning horizon for each of these elements is reported on the FR Y-9C. For DFAST 2014, AOCI over the planning horizon is assumed to be constant for the first three elements, while AOCI due to unrealized gains and losses on securities is assumed to move over the planning horizon with the supervisory scenarios. Specifically, unrealized gains and losses equals the difference between the fair value of the securities, as estimated by the AFS fair value model, and the amortized cost of the securities, which has been adjusted for OTTI using the OTTI models.2 Quarterly changes in unrealized gains and losses are recognized net of taxes as other comprehensive income (OCI), which contributes directly to changes in AOCI.
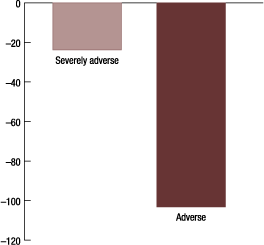
Over the planning horizon, unrealized gains and losses at the advanced approaches BHCs move with the path of Treasury yields. Five-year Treasury yields in the severely adverse scenario decline about 1 percentage point to 0.6 percent, but due to an assumed aversion to long-term debt instruments, yields in the adverse scenario increase about 3 percentage points to 4.6 percent by Q4 2014. As a result, OCI estimated for advanced approaches BHCs is projected to be -$24 billion under the severely adverse scenario and -$103 billion under the adverse scenario.
1. Unrealized gains and losses on cash flow hedges for items not recognized at fair value on the balance sheet are excluded from capital. Return to text
2. Detailed descriptions of the AFS fair value model and the OTTI models are available in appendix B. Return to text
Box 2. Federal Reserve Balance Sheet and RWA Projections
For DFAST 2014, the Federal Reserve independently projected bank holding company (BHC) balance sheets and risk-weighted assets (RWAs) under the supervisory scenarios. Independent balance projections permit a more consistent analysis across BHCs, one that features common assumptions regarding total borrowing by households and businesses and firms' market shares. In particular, making independent balance sheet projections allows the Federal Reserve to conduct the stress tests under the assumption that BHCs continue to serve as credit intermediaries, even under severely adverse conditions.
The Federal Reserve projection of BHC balance sheets begins with a set of models that relate total assets in the banking industry and important subcomponents, such as total loans and non-loan assets, to nominal GDP and other macroeconomic factors, including a measure of loan supply. These relationships are estimated using aggregate data and are used to project the growth in industry assets and its subcomponents over the planning horizon under each of the supervisory scenarios (See figure A). In the adverse and severely adverse scenarios, the measure of loan supply is assumed to remain at its long-run historical average over the planning horizon. This assumption ensures that loan supply does not contract during the stress period; relaxing this assumption would significantly reduce the projection of loan growth over the planning horizon in the severely adverse scenario.
Industry assets, loans, and trading assets are allocated to each BHC based on its shares of these positions at the beginning of the planning horizon. All types of loans at all BHCs are assumed to grow at the same rate, which means that the mix of loans at each BHC is constant over the planning horizon. This assumption ensures that each BHC's loan risk profile throughout the planning horizon is driven primarily by its outstanding business mix on the stress test as-of date. Trading assets are assumed to grow at the growth rate of total assets, adjusted for changes in mark-to-market values reflecting industrywide trading asset composition, while non-loan assets other than trading assets and securities grow at the same rate for all BHCs. Securities growth at each BHC is set so that total asset growth equals the projected rate given the growth of other types of assets at that firm.
The Federal Reserve's projection of BHCs' balance sheets also affects regulatory capital ratios through the denominator of these ratios--RWAs and average total assets. Based on the projection of BHC balance sheets, two components of RWAs were estimated: market RWAs and credit RWAs. Market RWAs reflect the market and credit risk exposures in the BHCs' portfolios of trading assets, while credit RWAs primarily reflect credit risk exposures in the BHCs' loan, derivatives, and other portfolios. Credit RWAs was calculated both under the capital framework that was in effect as of October 1, 2013, (general approach RWAs) and under the revised capital framework implementing the Basel III regulatory capital regime in the United States (standardized approach RWAs). The weights used to calculate credit RWAs were held fixed throughout the planning horizon to reflect an assumption that the credit portfolio's underlying risk features remain constant throughout the horizon; as a result, changes in credit RWAs over the planning horizon primarily reflect the balance sheet asset growth projections for loans, securities, and other assets.
Market RWAs can be broken down into components that are cyclical and, therefore, are expected to evolve over the planning horizon according to financial market conditions and those that are not. The first group, which includes value at risk and the incremental risk charge, are projected based on the volatility of the trading portfolio of the BHCs. The second group, which includes stressed value at risk, the specific risk charge, and the comprehensive risk charge, are assumed to evolve according to projections of the BHCs' trading assets.

Modeling Design and Implementation
The Federal Reserve's projections of revenue, expenses, and various types of losses and provisions that flow into pre-tax net income are based on data provided by the 30 BHCs participating in DFAST 2014 and on models developed or selected by Federal Reserve staff and reviewed by an independent group of Federal Reserve economists and analysts.26 The models are intended to capture how the balance sheet, RWAs, and net income of each BHC are affected by the macroeconomic and financial conditions described in the supervisory scenarios and by characteristics of the BHCs' loans and securities portfolios; trading, private equity, and counterparty exposures from derivatives and SFTs; business activities; and other relevant factors.27
The FR Y-14 Report
The Federal Reserve collects detailed data on PPNR, loans, securities, trading and counterparty risk, and losses related to operational-risk events on the FR Y-14 report, which includes a set of schedules (the FR Y-14M, FR Y-14Q, and FR Y-14A) collected monthly, quarterly, or annually.28 Over the past year, several changes have been made to the FR Y-14 report. Most of the changes affected the FR Y-14A, which was revised to reflect the Federal Reserve's revised regulatory capital framework. Also, additional counterparty items were added related to SFTs and repurchase agreements to support loss estimation for the counterparty default component of the supervisory scenarios.
Each of the 30 BHCs participating in DFAST 2014 submitted FR Y-14M and FR Y-14Q schedules (as of September 30, 2013) in October and November of 2013 and submitted FR Y-14A schedules on January 6, 2014.29 These data--along with data collected in other regulatory reports and gathered from other proprietary third-party data sources--were used in the supervisory models of revenues, expenses, and losses. Balance sheets and RWAs were projected based on historical data from the Federal Reserve's Z.1 statistical release (Financial Accounts of the United States), FR Y-9C report, and FR Y-14
schedules.30
Quarterly loan losses are projected using information collected on the FR Y-14 about the BHCs' loan portfolios, including borrower characteristics, collateral characteristics, characteristics of the loans or credit facilities, amounts outstanding and yet to be drawn down (for credit lines), payment history, and current payment status. Loan portfolio data are reported either monthly (for domestic retail credit card and residential mortgages) or quarterly (all other retail and wholesale portfolios). Data are collected on individual loans or credit facilities for wholesale loan, domestic retail credit card, and residential mortgage portfolios and are collected on segments of the loan portfolios for other domestic and international retail portfolios (for example, segments defined by loan-to-value (LTV) ratio, geographic location, and borrower credit score).
Losses on securities held in the AFS and held to maturity (HTM) portfolios are estimated using securities data collected quarterly at the individual security (CUSIP) level, including the amortized cost, market value, and any OTTI taken on the security to date.
BHCs were required to submit detailed loan and securities information for all material portfolios, where the portfolio is deemed to be "material" if the size of the portfolio exceeds either 5 percent of the BHC's tier 1 capital or $5 billion. The portfolio categories are defined in the FR Y-14M and Y-14Q instructions. For portfolios falling below these thresholds, the BHCs had the option to submit or not submit the detailed data. Portfolios for which the Federal Reserve did not receive detailed data were assigned a loss rate equal to a high percentile of the loss rates projected for BHCs that did submit data for that category of loan or security.
The Federal Reserve made considerable efforts to validate BHC-reported data, and requested resubmissions of data as needed. However, in certain instances, BHC-reported data remained insufficient or were deemed unreliable to produce supervisory estimates. In such instances, loans with insufficient or unreliable data received a loss rate at or near the 90th percentile of the loss rates projected for the relevant loan segment at the BHCs that did provide reliable data. In some instances where certain data elements were reported as missing values, these missing data were assigned conservative values (e.g., high LTV values or low credit scores).31 These assumptions are intended to reflect a conservative view of the risk characteristics of the portfolios, given insufficient information to make more risk-sensitive projections.
Losses related to the global market shock and the counterparty default components are projected using information on trading, derivatives and SFT exposures, private equity holdings, and certain other assets subject to fair-value accounting held by BHCs with large trading operations. The FR Y-14 schedules collect BHC-estimated sensitivities of trading positions, private equity, and other fair-value assets held in the trading book to the set of risk factors specified by the Federal Reserve. These risk factors include changes in a wide range of U.S. and global market rates and asset prices as well as volatilities of those rates and prices. The specific risk factors are those judged to be most relevant to the positions held by the BHCs. The schedules also collect information on the BHC's counterparty exposures, revalued with respect to these risk factors both for segments of counterparties and for individual counterparties. Additionally, supplementary schedules were used to collect information specific to the counterparty default component as well as eurozone holdings and exposures. These data, which are collected for positions in the trading and private-equity portfolios held by the BHCs and counterparty exposures, are as of market close October 16, 2013.
Most components of PPNR are projected using data on historical revenues and operating and other non-credit-related expenses reported on the FR Y-9C report, which contains consolidated income statement and balance sheet information for each BHC (including components of interest income, non-interest income, and noninterest expenses).32 Separate data are collected on the FR Y-14 about mortgage loans that were sold or securitized and the BHCs' historical losses related to operational-risk events to project losses from mortgage repurchase and operational-risk events under the supervisory scenarios.
Finally, changes in regulatory capital ratios over the planning horizon are calculated incorporating Federal Reserve projections of RWA and balance-sheet composition.
Balance Sheet, Loss, Revenue, and Expense Models
The data collected from the BHCs, along with data collected in other regulatory reports; proprietary industry data; and the variables defining the supervisory scenarios, are inputs into a series of models used to project the balance sheet, losses, revenues, and expenses for each BHC over the planning horizon. These models were either developed by Federal Reserve analysts and economists or are third-party models used by Federal Reserve staff.33 In some cases, the projections of certain types of losses made by the Federal Reserve use as an input sensitivities generated by the BHCs using their internal risk-measurement models.
In general, the models were developed using pooled historical data from many financial institutions, either supervisory data collected by the Federal Reserve or proprietary industry data. As a result, the estimated parameters reflect the typical or industry-average response to variation in the macroeconomic and financial market variables and portfolio-specific and instrument-specific characteristics.
This industrywide modeling approach reflects the challenge of estimating separate, statistically robust models for each of the 30 BHCs. This approach also reflects the desire of the Federal Reserve not to assume that historical BHC-specific results will prevail in the future if those results cannot be explained by consistently observable variables incorporated into a robust statistical model. Thus, BHC-specific factors are incorporated through detailed portfolio and business-activity data, such as that provided on the FR Y-14, that are inputs to the models, but the estimated relationships between these variables, the macroeconomic and financial market factors defined in the supervisory scenarios, and revenue or losses are the same for all BHCs. This means that the projections made by the Federal Reserve will not necessarily match or mirror similar projections made by individual BHCs, which will incorporate diverse approaches that capture the effect of portfolio characteristics and other economic factors.
The Federal Reserve deviated from the industrywide modeling approach only in a very limited number of cases, in which the historical data used to estimate the model were not sufficiently granular to reliably capture cross-firm differences in loss, expense, or revenue-generating characteristics. In these cases, BHC-specific indicator variables (fixed effects) were included in the models.
The models developed internally by the Federal Reserve draw on economic research and analysis and industry practice in modeling the impact of borrower, instrument, collateral characteristics, and macroeconomic factors on revenue, expenses, and losses. The modeling approaches build on work done by the Federal Reserve in previous stress tests, but in some cases, the models represent significant refinement and advancement of earlier work, reflecting advances in modeling technique, richer and more detailed data over which to estimate the models, and longer histories of performance in both adverse and more benign economic settings.
In a few cases, these efforts resulted in new models that were implemented in DFAST 2014. These new models and other models used are described in greater detail in appendix B. Overall, the Federal Reserve continues to move toward an overall modeling framework that is increasingly independent of BHC projections.
The models were reviewed by an independent model validation team composed of economists and analysts from across the Federal Reserve System, with a focus on the design, estimation, and implementation of the models. Model reviewers were primarily Federal Reserve subject matter experts who were not involved in model development and who reported to a different oversight group than model developers. In addition, Federal Reserve analysts developed industrywide loss and PPNR projections--capturing the potential revenue and losses of the banking industry as a whole in a stressed macroeconomic environment--for use as reference points in assessing model outputs across the 30 BHCs.
References
21. See generally 12 CFR part 225, appendix A; 12 CFR part 217. Return to text
22. See Consolidated Financial Statements for Bank Holding Companies (FR Y-9C).www.federalreserve.gov/apps/reportforms/default.aspx. Return to text
23. A security is considered impaired when the fair value of the security falls below its amortized cost. Return to text
24. For six BHCs with large trading and private equity exposures, losses from the large counterparty default component replace losses in DFAST 2013 and CCAR 2013 associated with the incremental default risk of their counterparties. Return to text
25. For a discussion of the effect of changing this tax rate assumption on the post stress tier 1 common ratio, see box 2 of Board of Governors of the Federal Reserve System (2013), "Dodd-Frank Act Stress Test 2013: Supervisory Stress Test Methodology and Results," available at www.federalreserve.gov/newsevents/press/bcreg/20130307a.htm. Return to text
26. For more information, see www.federalreserve.gov/aboutthefed/mvc.htm. Return to text
27. In some cases, the loss models estimated the effect of local-level macroeconomic data, which were projected based on their historical covariance with national variables included in the supervisory scenarios. Return to text
28. The FR Y-14 schedules are available at www.federalreserve.gov/apps/reportforms/default.aspx. Return to text
29. In preparation for DFAST 2014, the 12 BHCs that did not previously participate in DFAST began submitting the FR Y-14M and FR Y-14Q schedules in late 2012. Return to text
30. Financial Accounts of the United States (Z.1)is available at www.federalreserve.gov/releases/z1/. Return to text
31. The method of applying conservative assumptions to certain risk segments was used only in cases in which the data-related issues were isolated in such a way that the remainder of the portfolio could be readily modeled using the existing supervisory framework. Return to text
32. The FR Y-9C report is available at www.federalreserve.gov/apps/reportforms/default.aspx. Return to text
33. A list of providers of the proprietary models and data used by the Federal Reserve in connection with DFAST 2014 is available in appendix B. Return to text
