
Insights into the Financial Experiences of Older Adults: A Forum Briefing Paper
 Print
Print- Preface
- Executive Summary
- Introduction
- Use of Financial Products and Services by Older Adults
- Financial Decisionmaking of Older Adults
- Financial Stress and Well-Being of Older Adults
Use of Financial Products and Services by Older Adults
This section reviews key findings from the Older Adult Survey regarding a wide range of financial products and services utilized by older adults, including mortgages, routine banking and bill payment practices, credit cards and other debt products, and student loans. Where possible, findings from the survey are compared with other recent surveys and research.
Mortgages
Respondents in the survey are predominantly homeowners (71 percent), consistent with Census findings for the population age 40 and above.9 One in four respondents indicate that they are renters (25 percent) and a smaller share report that they have some other type of living arrangement (4 percent). About one-third (35 percent) of homeowners in the survey report they have no mortgages or loans on their homes. Six in 10 (59 percent) report they "have a mortgage and/or home equity loan" and 13 percent have a home equity line of credit.
The share of older adult households with mortgages or home loans decreases by age: 85 percent of homeowners in their 40s have mortgages or loans outstanding, declining to three-quarters (76 percent) of those in their 50s, to six in 10 (59 percent) of those in their 60s, and 38 percent of those age 70 and older. Even among those respondents who describe their work status as primarily "retired," nearly one-half (47 percent) also say they have mortgage debt or other home loans outstanding.
Figure 1. Many respondents carry home-secured debt late in life
Percent of survey respondents reporting ownership of a mortgage, home equity loan, or home equity line of credit, by age
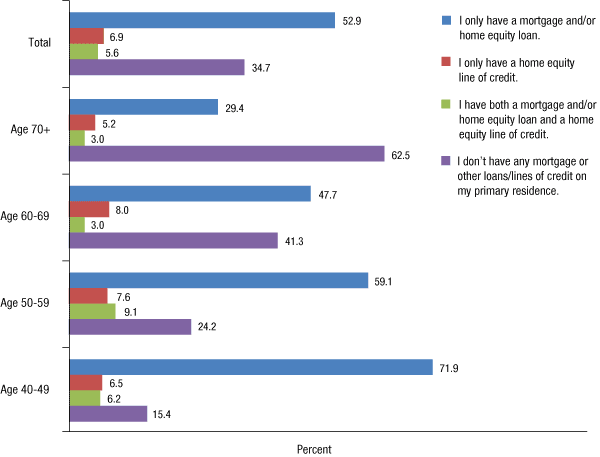
Note: See Table B.2 in Appendix B; number of respondents was 1,234.
For figures 1-10, the horizontal bars in the figures are presented in the same top-down order as the figures key.
Consistent with these results are other data suggesting prolonged mortgage indebtedness is part of a larger trend. The 2010 SCF data show that almost two-thirds (65 percent) of families age 40 and older had debt secured by their primary residence, up from 59 percent in 2001. Among families in their 60s, the share with mortgage indebtedness rose from about one-half (49 percent) in 2001 to six in 10 (60 percent) in 2010. For those age 70 and older, the share rose from one in five (20 percent) in 2001 to one-third (34 percent) over the same period.10
Home values fell and unemployment rates rose in many markets across the country during the housing crisis. Some homeowners (about 30 percent) sought to refinance their mortgages during the recent period of low interest rates. The Home Mortgage Disclosure Act (HMDA) data for 2010 and 2011 report more than 9 million refinancings during those years.11 The Mortgage Bankers Association (MBA) estimates the value of refinancings in the first three quarters of 2012 rose by 48 percent, suggesting that more than 6 million refinancings occurred in 2012.12 These approximately 15 million refinancings that took place over the three-year period from 2010 to 2012 occurred at a time when there were about 50 million owner-occupied homes with mortgages.13 The survey similarly found that about one-third (32 percent) of respondents with mortgage debt reported they had refinanced in the preceding three years. Among those who did not, some did not believe refinancing would be beneficial. One in five said they believed they would not save enough money by doing so (20 percent) and 12 percent said they are close to paying off their mortgage. Other reasons cited for not refinancing included being underwater on a mortgage (i.e., owing more on their mortgage than their home is worth) (13 percent). About one in five reported that they "never thought about [refinancing their mortgage]" (19 percent).
Respondents also reported low use of reverse mortgages, products designed explicitly for older adults to convert home equity to income flows. Reverse mortgage borrowers must be 62 years of age or older, have substantial equity in their home or own their property outright, and participate in mandatory counseling. Among homeowners in the survey age 62 and older, just 2 percent report they have a reverse mortgage, a figure that mirrors the take-up rate inferred from other data sources.14 More than nine in 10 respondents who were homeowners age 62 and older indicated that they "did not consider" obtaining a reverse mortgage. Similarly, a MetLife survey of the oldest baby boomers on the cusp of retirement--those who turned age 65 in 2011--found that only about 2 percent say they either have used or plan to use a reverse mortgage in the future.15
The financial circumstances of renters in the survey, who comprise about one-quarter of the respondents, may differ from those of homeowners. Fifty percent of lower-income households in the survey--those with less than $30,000 in income--are renters.
Among both homeowners and renters, housing costs tend to consume an increasing share of their income as they age. In addition to mortgage debt, homeowners also must pay utilities, property taxes, insurance, maintenance, and other costs. Renters also, directly or indirectly, bear these costs. According to the U.S. Department of Housing and Urban Development, households that spend more than 30 percent of their income on housing are considered "cost burdened" while those spending more than one-half of their income on housing are considered "severely cost burdened."16 The Center for Housing Policy estimates that 36 percent of households younger than age 65 fall into one of these cost burden categories. The share rises to 39 percent of those age 65 to 74, 41 percent of those age 75 to 84, and 46 percent of those age 85 and older.17
Bank Accounts
The vast majority of respondents (94 percent) report at the time of participating in the Older Adult Survey that they are "banked," that is, they have at least one checking or savings account, while 6 percent are "unbanked." This survey's unbanked rate is consistent with data from the Federal Deposit Insurance Corporation's (FDIC's) 2011 National Survey of Unbanked and Underbanked Households, which found that 6.2 percent of households age 40 and above are unbanked.18 As a number of studies have documented, unbanked households are not a static group but, rather, flow in and out of the formal banking system as their needs or circumstances change.19
The share of respondents in the Older Adult Survey who are unbanked declines with age: from 10 percent of those in their 40s and 9 percent of those in their 50s to 3 percent of those in their 60s and less than 1 percent of those age 70 and above. Data from the FDIC survey also show the share of unbanked is highest for those in their 40s (9 percent) and declines with age: 7 percent of those in their 50s are unbanked, 5 percent of those in their 60s, and 4 percent of those age 70 and older.20 The shares of unbanked respondents in the FDIC survey are lower than in the Older Adult Survey for the middle-aged group and higher for the oldest age groups.
Banking Methods
Older adults across all age cohorts employ a variety of methods to conduct everyday financial transactions such as checking their account balances and making deposits or withdrawals. About half (51 percent) carry out transactions in person at a bank, 40 percent use an automated teller machine (ATM), 67 percent use online banking, 21 percent use the telephone, and 10 percent use a bank application on a mobile phone.
Figure 2. Banking in person is common across all age groups; ATMs and online banking also are widely used, but favored by those in their 40s
Percent of survey respondents using each method to check account balances and make deposits/withdrawals, by age
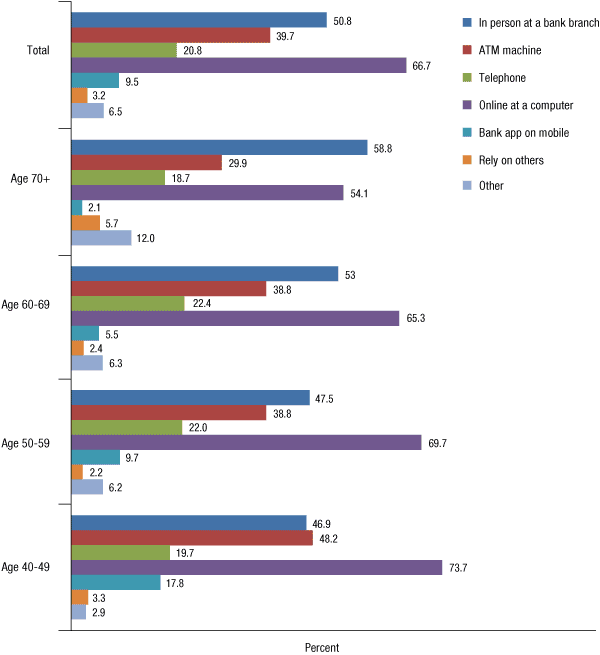
Note: See Table B.12 in Appendix B; number of respondents was 1,735.
However, different banking methods are favored by different age cohorts. For example, while less than one-half (47 percent) of respondents in their 40s bank in person, nearly six in 10 (59 percent) of those age 70 and older do. In contrast, nearly one-half (48 percent) of those in their 40s use an ATM, but only about one-third (30 percent) of those age 70 and older do. Nearly three-quarters (74 percent) of respondents in their 40s go online to do their banking, and this diminishes only somewhat by age; the survey found that more than one-half (54 percent) of respondents age 70 and older also bank online. However, the high usage of online banking reported among the older respondents may be partly attributable to the type of individuals age 70 and older who participated in this online panel. For comparison, the 2010 SCF, which is conducted primarily in person, found that only around one-quarter of respondents age 70 and above said they used a computer or e-mail to interact with a financial institution, though this figure has been rising, as reflected in recent waves of the SCF.21
A Pew study on Internet use among adults indicates that younger adults are early adopters of technologies that eventually are used by older groups.22 This trend appears to be borne out in usage of the newest banking technology, mobile apps. In the Older Adult Survey, 18 percent of those in their 40s use their banks' mobile apps, while only 2 percent of those age 70 and older do so, in part due to younger adults' higher levels of adoption of smartphones.
Several reasons were cited by respondents for why they do not use online banking, including: they prefer banking in person (52 percent), their needs are being met without online banking (50 percent), they have security concerns (42 percent), and they have general concerns about the technology (22 percent). One-half (51 percent) of those who do not bank online selected multiple reasons. About four in 10 (38 percent) of respondents in their 40s say their needs are being met without online banking as compared to more than six in 10 (62 percent) of respondents age 70 and older.
The survey found that older adults of all ages pay their bills in a variety of ways, both with and without technology. Overall, some 62 percent of respondents pay at least some bills using their computer, including nearly one-half (49 percent) of adults age 70 and older. Middle-aged households are more likely than older adults in their 60s and 70s to use the phone to pay bills. It also is the case that in-person payment is more common among those in their 40s and 50s (29 percent each) than among older respondents (25 percent of those in their 60s and 21 percent of those age 70 and older). Nearly one in 10 (9 percent) of all respondents pay at stores that accept bill payments for other companies.
Figure 3. Respondents in all age groups pay bills using a variety of methods and technologies
Percent of survey respondents using each method to pay bills, by age
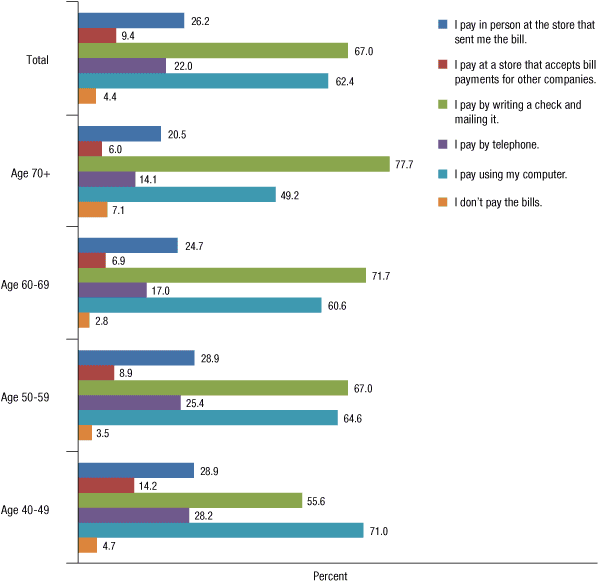
Note: See Table B.17 in Appendix B; number of respondents was 1,731.
Writing and mailing paper checks is still a widely used method of bill-paying across all age groups, although it is more prevalent among the oldest groups. More than three-quarters (78 percent) of those age 70 and above, seven in 10 (72 percent) of those in their 60s, and two-thirds (67 percent) of those in their 50s use paper checks. Just over one-half of those in their 40s (56 percent) pay bills in this manner.
The Federal Reserve Bank of Boston's 2010 Survey of Consumer Payment Choice (SCPC) similarly found that using checks to pay bills is a method most common among the oldest respondents (92 percent of those age 70 and older), but also highly used by the middle-aged (nearly 80 percent of those in their 40s and 50s).23 The SCPC also found that middle-aged respondents are more likely to use payment cards and electronic methods to make online bill payments (about three-quarters do); 57 percent of respondents age 70 and older reported using these payment methods.24
Use of automatic payments also is common among older adults. Among Older Adult Survey respondents who indicated they use the phone or computer to pay bills, almost three-quarters of respondents (73 percent) use automatic payment to pay at least a few of their bills. This includes one in five (21 percent) who say that they use automatic payment for most of their bills and 6 percent who use it for all of their bills. Those who use automatic bill payment rarely or not at all indicated that their reasons for not doing so included: the varying amounts of monthly bills (39 percent), prefer to pay the bills by check (36 percent) or in person (14 percent), concerns about security (23 percent), and lack of trust in technology (15 percent).
Credit Card Balances
In the Older Adult Survey, almost one in four respondents (24 percent) say they have not used a credit card in the last three years. This is generally consistent with data from the 2010 SCF, which indicate that 28 percent of households headed by someone age 40 or older reported that they do not have a credit or charge card. Among respondents in the survey who use credit cards, 48 percent carry balances: 36 percent pay more than the minimum monthly payment, but less than the full amount; 9 percent pay the minimum each month; and 1 percent describes themselves as "typically behind." Only about one-half (52 percent) report they pay their balance in full every month. Overall figures generally are consistent with data in the 2010 SCF showing that 41 percent of families age 40 and older "hardly ever" (23 percent) or just "sometimes" (17 percent) pay off their credit card balance each month, while nearly six in 10 (59 percent) report they "always or almost always" pay off their monthly balances.25
Middle-aged adults in the survey are more likely than older respondents to carry credit card balances each month. Six in 10 of those in their 60s (60 percent) and two-thirds of those age 70 and older (68 percent) pay their balances in full each month, compared to four in 10 of those in their 40s and 50s (41 percent and 42 percent, respectively). These middle-aged respondents also are about twice as likely to pay only the minimum. Again, these findings are consistent with SCF data showing that the older they are, the more likely adults are to "always or almost always" pay off their monthly balances.26 While 44 percent of adults in their 40s say they do so, this rises to more than one-half (55 percent) of those in their 50s, almost two-thirds (66 percent) of those in their 60s, and three-quarters (77 percent) of those age 70 and older.
Figure 4. Middle-aged respondents are more likely than older groups to carry credit card balances
Percent of survey respondents reporting typical credit card payment activity, by age
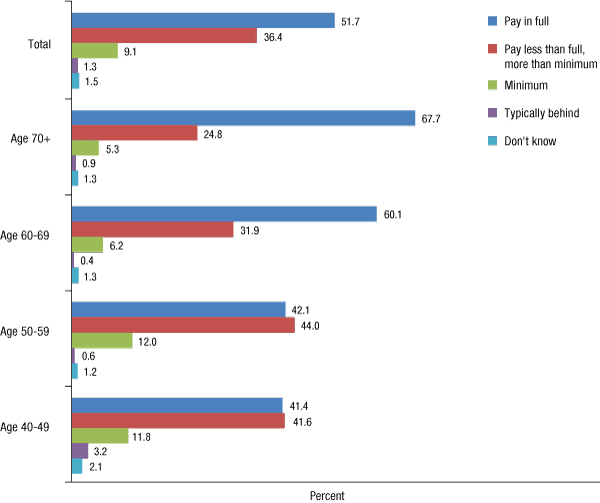
Note: See Table B.22 in Appendix B; number of respondents was 1,456.
Among those with credit cards, almost one in five (17 percent) report having more credit card debt now than they did three years ago, while about one-quarter (26 percent) say they are carrying about the same level of debt, and one-third (31 percent) report less credit card debt. Middle-aged respondents were more likely than the oldest adults to say they had incurred more debt. The 2010 SCF data show that median credit card balances for families age 35 to 44 and 45 to 54 is $3,500 for both age groups, while the median balance for those age 55 to 64 was $2,800; $2,200 for those age 65 to 74; and $1,800 for those age 75 and older.27
Use of Alternative Financial Services
Use of cash advances on credit cards by older adults is relatively limited. Cash advances are loans made against an open line of credit on a credit card and often have interest rates that are significantly higher than on card purchases or balance transfers. About one in 10 (11 percent) respondents indicated they have taken a cash advance on one of their credit cards in the last three years, a rate that does not vary appreciably by age group. Similarly, in a study of financial capability in the United States conducted by the Financial Industry Regulatory Authority (FINRA) Investor Education Foundation, 11 percent of survey respondents noted that in some months they use their cards for a cash advance.28
Use of payday and deposit advance products among older adults appears to be modest. Although not strictly the same, payday loans and bank deposit advances are potentially high-cost methods of borrowing that share similar characteristics. Both generally are used to borrow amounts up to $500 and both typically are secured by an anticipated deposit in a borrower's checking account. Some 4 percent of respondents in the Older Adult Survey say they currently have a payday loan or deposit advance and an additional 5 percent say they have used these products in the past. The survey also finds that middle-aged respondents use these products at higher rates than older respondents--those in their 40s are twice as likely to use these products as those in their 60s. Usage also is higher among those with incomes below $60,000 as compared to higher-income households, and among minority respondents as compared to white respondents (6 percent as compared to 3 percent).
In comparison, use of payday loans by respondents age 40 and older is lower in the 2010 SCF and 2011 FDIC survey of the banked and unbanked. Just 3 percent of families age 40 and older in the SCF say they have used a payday loan in the past year, while 4 percent of respondents age 40 and older in the FDIC survey say they have "ever" used a payday loan. However, these comparison figures do not include deposit advance products.29
Student Loan Debt
According to a recent analysis of the Federal Reserve Bank of New York's Consumer Credit Panel, student debt is the only class of household debt whose aggregate amount continued to rise through the financial crisis.30 Education debt now represents the second largest household debt class, more than credit card and auto loan debt combined. The Consumer Credit Panel data also indicate this type of debt is increasing across all age groups. Younger households carry the largest debt burdens from student loans, but the share of student loan debt owed by households 40 and older is about one-third of the nearly $1 trillion total student loan debt outstanding in 2012, a substantial increase from about one-fifth of the total $330 billion in 2004. The share of borrowers 90-days delinquent has also been growing across all age groups since 2004, with delinquencies among borrowers age 50 and older doubling from about 7 percent to 14 percent in 2012.
The Older Adult Survey also found that, for some older adults, payment on student loan debt persists well into middle age. The survey asked for whom the education debt was acquired. Overall, 14 percent of respondents report carrying student loan debt for themselves or their children. Of respondents in their 40s with education debt, most are paying off loans for themselves. Of respondents in their 50s and 60s with education debt, most are paying off loans for their children. Specifically, 14 percent of respondents in their 40s reported having an outstanding student loan for themselves, while just 5 percent had loans outstanding for children. Conversely, while just 7 percent of respondents in their 50s reported having an outstanding student loan for themselves, 12 percent had loans outstanding for children. Further, just 2 percent of those in their 60s had student loans for their own education, but 6 percent had student loans for the education of their children.
Figure 5. One in five middle-aged respondents carries student loan debt for themselves or their children
Percent of survey respondents reporting student loan debt for themselves, their child, or both, by age
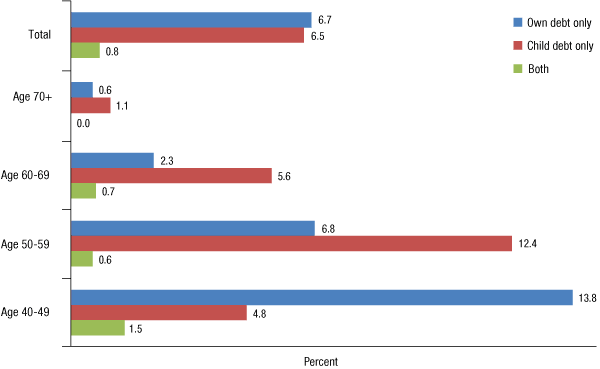
Note: See Table B.31 in Appendix B; number of respondents was 1,818.
In comparison, the 2010 SCF data show that 12 percent of families over age 40 carried student loan debt. One in five (20 percent) families in their 40s had education debt, as did 15 percent of those in their 50s. These figures were up substantially from 2004 when, the SCF shows, 8 percent of those age 40 and above had education debt, including 13 percent of those in their 40s and 12 percent of those in their 50s. The share of those in their 60s with student loan debt also grew considerably over the same period, from approximately 2 percent in 2004 to slightly more than 5 percent in 2010.31
The Older Adult Survey also indicates that, for those with student loan debt for their own education only, the average size of this debt is approximately $24,000. For those with student loan debt only for their children, the average debt burden is approximately $20,000.32 In comparison, the SCF data show that total average education debt for families age 40 and older was $25,191, and also indicate a notable increase in education debt among older adults over the period 2004 to 2010. In 2004, average student loan balances were $17,153 (in 2010 dollars), rising to $20,101 in 2007.33
References
9. Staff tabulations from 2012 U.S. Census Bureau data. Homeownership rates in the sample are somewhat lower than the 2012 Census Bureau's Current Population Survey (CPS) for those under the age of 70. Reported homeownership rates for the sample were 60 percent for those in their 40s, 71 percent for those in their 50s, 77 percent for those in their 60s, and 84 percent for those 70 and older. This compares to 2012 CPS figures of 68 percent for those in their 40s, 75 percent for those in their 50s, 80 percent for those in their 60s, and 81 percent for those age 70 and older. Low-income, disabled, unemployed, and minority households have consistently lower homeownership rates in both the survey sample and Census. Return to text
10. Staff tabulations from 2001 SCF and 2010 SCF data. Return to text
11. Avery, Bhutta, Brevoort, and Canner (2012), p. 6. Return to text
12. Staff tabulations of 2010, 2011, and 2012 HMDA data and MBA Quarterly Origination Estimates. Return to text
13. Staff tabulations of 2010, 2011, and 2012 HMDA data. Return to text
14. See, for example, data from the 2011 American Housing Survey, Table C-14A-00 which show 417,000 reverse mortgages from a potential pool of 20.3 million homeowners age 65 and older, or about 2 percent. Return to text
15. MetLife Mature Market Institute (April 2012), p. 19. Return to text
16. U.S. Department of Housing and Urban Development, "CHAS" data (Comprehensive Housing Affordability Strategy), are used by localities to identify housing problems and housing needs, particularly for low-income households. For more information, go to www.huduser.org/portal/datasets/cp/CHAS/bg_chas.html  . Return to text
17. Lipman, Lubell, and Salomon (2012), p. 8. Return to text
18. Staff tabulations from 2011 FDIC Survey. Return to text
19. Rhine and Greene (2013). Return to text
20. Staff tabulations from 2011 FDIC Survey. Return to text
21. Staff tabulations from 2004, 2007, and 2010 SCF data. Return to text
22. Zickuhr and Madden (2012). Return to text
23. Staff tabulations from 2010 SCPC data. Return to text
24. In the SCPC, checks include both those mailed and those for in-person bill payment. Payment cards include credit, debit, and stored-value/prepaid cards. Electronic methods include bank account number payments and online banking bill payments. The SCPC also uses the RAND ALP. Return to text
25. Staff tabulations from 2010 SCF data. Return to text
26. Staff tabulations from 2010 SCF data. Return to text
27. Bricker, Kennickell, Moore, and Sabelhaus (2012), p. 63. Return to text
28. FINRA Investor Education Foundation (2013), p 21. Return to text
29. Staff tabulations from the 2010 SCF and 2011 National Survey of Unbanked and Underbanked Households. Return to text
30. Lee (2013). Return to text
31. Staff tabulations from 2010 SCF data. Return to text
32. These figures are estimated by averaging the midpoint of each debt range (assuming an amount of $75,000 in the open-ended maximum category). Return to text
33. Staff tabulations from 2004, 2007, and 2010 SCF data. Return to text