 Print
Print
Freedom of Information Office
2011 Reserve Bank Budgets
-
Date: December 15, 2010
-
To: Board of Governors
-
From: Janet Yellen (Initialed)
-
Subject: 2011 Final Reserve Bank Budgets
The Committee on Federal Reserve Bank Affairs has reviewed staffs recommendation that the Board approve the Reserve Bank budgets for 2011. In aggregate, the Reserve Bank budgets total $3,324.4 million, an increase of $88.0 million, or 2.7 percent over 2010 estimated expenses. I am forwarding the attached staff memorandum to the Board for its consideration.
Board of Governors of the Federal Reserve System
Division of Reserve Bank Operations and Payment Systems
-
Date: December 15, 2010
-
To: Board of Governors
-
From: Kelsi Wilken, Becky Royer, Lauren Guerin, Dorothy LaChapelle, Don Hammond
-
Subject: 2011 Final Reserve Bank Budgets
Action Requested
Staff recommends that the Board approve the 2011 Reserve Bank budgets totaling $3,324.4 million, an increase of $88.0 million, or 2.7 percent, from the 2010 estimated expenses and $103.1 million, or 3.2 percent, from the approved 2010 budget.1 Staff also requests that the Board approve the 2011 Reserve Bank, Federal Reserve Information Technology (FRIT), and the Office of Employee Benefits (OEB) capital budgets, which total $417.6 million. The capital budgets are approved with the understanding that approval for actual capital outlays will be in accordance with the Boards Policies and Guidelines Concerning Reserve Bank Operations (FRAM 1-049). We have attached additional statistical information that provides details on expenses, staffing, and capital outlays.
The Federal Reserve believes it is important that the entire System comply with the spirit of President Obamas proposal to freeze the base pay of civilian federal government employees. Therefore, the proposed 2011 budgets do not include funding for base pay increases, such as merit or equity increases, for Bank officers or staff. The proposed budgets do provide funding for promotions, at the funding levels anticipated prior to the pay freeze, because the Presidents proposal would not prohibit promotions. Once there is final action on the Presidents proposal, we will review the appropriateness of these funding recommendations in light of the external environment.
Total Expense and Employment Summary
The 2011 operating budgets of the Reserve Banks' total $3,324.4 million. The 2011 budget is $88.0 million, or 2.7 percent, higher than the 2010 estimate. Total 2011 projected employment for the Reserve Banks, FRIT, and OEB is 17,979 ANP, an increase of 419 ANP, or 2.4 percent, from 2010 estimated staff levels.2 The expense growth is driven by increases in central bank functions, specifically those related to supervision and regulation and the open market operation in New York. In particular, implementation of the Dodd-Frank Wall Street Reform and Consumer Protection Act (DFA) accounts for significant budget growth. These increases are partially offset by decreases in priced services costs as a result of continued paper-check volume declines and the full-year effect of consolidations. The increase in expenses is further offset by a reduction in vendor fees and staffing related to the winding down or closing of the liquidity facilities in New York.3
2010 Budget
2010 Estimate
2011 Budget
2010 Est. vs. 2011 Bud.
Amount
Percent
Central bank services
$2,270.0
$2,309.0
$2,440.7
$131.7
5.7%
Treasury services
$444.4
$446.9
$468.3
$21.4
4.8%
Priced services
$506.9
$480.6
$415.4
($65.2)
-13.6%
Total expense
$3,221.3
$3,236.4
$3,324.4
$88.0
2.7%
Check
$309.9
$280.8
$218.8
($62.0)
-22.1%
Total expense less check
$2,911.4
$2,955.6
$3,105.7
$150.0
6.3%
Total staffing1
17,578
17,560
17,979
419
2.4%
Check2
941
833
648
-186
-22.3%
Total staffing less check
16,637
16,727
17,331
604
3.6%
1. ANP includes projected employment at the Federal Reserve Banks, FRIT, and OEB. Return to table.
2. Check ANP includes associated national provided consolidated support services. Return to table.
Budgeted expenses for 2011, net of revenue and reimbursements, are expected to increase $141.1 million, or 6.4 percent, from 2010 estimated expenses. Thirty percent of Reserve Bank expenses in the 2011 budget are offset by priced service revenues (15 percent) and reimbursable claims for services provided to the Treasury and other agencies (15 percent).4 Budgeted 2011 priced services revenue is lower than the 2010 estimated level, primarily as a result of an increasing proportion of checks being deposited and presented electronically, which have lower fees than paper checks, and declining check volume. Reimbursable claims are expected to increase in 2011, reflecting increased activity on key Treasury projects.
2010 Budget
2010 Estimate
2011 Budget
Percent change
10B vs. 11B
10E vs. 11B
Total expense
$3,221.3
$3,236.4
$3,324.4
3.2%
2.7%
Less:
Priced services revenue
$565.9
$573.3
$497.2
-12.1%
-13.3%
Reimbursable claims
$463.2
$466.4
$489.4
5.7%
4.9%
Net expenses
$2,192.1
$2,196.7
$2,337.8
6.6%
6.4%
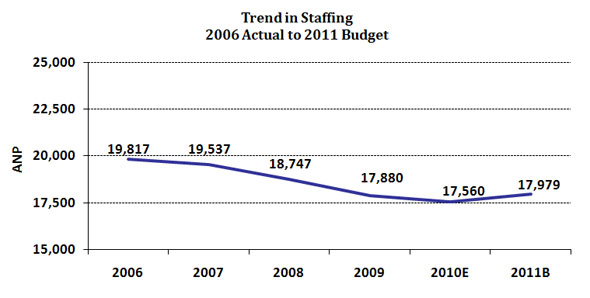
2011 staffing levels are projected to increase as resources are added for supervision and regulation in all Districts. Although priced service operational staffing levels have continued to decline largely due to the effect of infrastructure changes and paper-check volume declines, staffing for central bank functions has increased. Over the past five years staffing levels have declined in check and cash, as well as support areas such as law enforcement and facilities management, reflecting efficiencies and consolidation efforts. Over the same period, staffing for supervision and regulation and for the FRB New York monetary policy operation has grown as Reserve Banks have increased resources to address the financial crisis and deteriorating banking conditions. Information technology resources have also increased as Banks have modernized their critical applications, strengthened information security, and improved business functionality.
2010 Budget Performance
Total 2010 expenses are estimated to be $3,236.4 million, which represents an increase of $15.1 million, or 0.5 percent, from the approved 2010 budget of $3,221.3 million. Total 2010 estimated staffing of 17,560 ANP represents a decrease of 18 ANP from 2010 budgeted levels of 17,578 ANP.
The estimated expense increase compared with budget is driven by expanded responsibilities in supervision and regulation to address the deterioration in community and regional banking portfolios, as well as additional staffing to strengthen supervision of the largest institutions, associated macro-prudential efforts, and enhanced operating procedures ($22.6 million and 58 ANP). Also contributing to the overrun is an anticipated write-off of CACHE program hardware and software ($20.2 million), which cannot be used under the revised automation strategy for the cash project, now referred to as CashForward.5 Additional resources are also necessary to assess financial risk, and to evaluate credit risk and advise on risks related to lending programs ($6.2 million or 7.4 percent).
The overrun in Treasury services ($2.5 million or 0.6 percent) reflects the Treasury's request to expand several projects including the Treasury payment programs and the GoDirect call center.6,7
Partially offsetting the overrun are decreased expenses in the check function ($29.1 million). In 2010 the System completed a multi-year effort to consolidate check operations to one full-service paper-check processing site and one electronic check processing site. The paper-check transition was completed first quarter 2010 and the electronic check transition was completed in fourth quarter 2010. Significant reductions in the check adjustments function and check transportation services were also achieved as a result of declines in paper check volume. The loans to depository institutions and others function is under budget due to reductions in resources related to the liquidity facilities, and lower TALF vendor fees due to the decline in the volume of loans outstanding ($12.1 million). In addition, fee reductions in the monetary policy operation are due mainly to renegotiated MBS vendor contracts ($8.3 million).
The underrun in total staffing of 18 ANP, compared with the approved budget, reflects the significant decline in check operations (105 ANP). In addition, other functions reduced staffing including law enforcement as operations were streamlined (31 ANP), Treasury services due to volume declines in Treasury retail securities and hiring delays in Cash Management Modernization (CCMM) projects (25 ANP), and loans to depository institutions and others as a result of lower loan volume (25 ANP).8 Offsetting these underruns are increased staffing at FRIT, primarily to support the System's server consolidation initiative (111 ANP), and in the supervision and regulation function due to current banking conditions (58 ANP).
Initiatives Affecting the 2011 Budget
The 2011 growth in Reserve Banks' budgets reflects several initiatives. In the central bank area, which includes monetary policy, services to financial institutions and the public, and supervision and regulation, total expenses are increasing $131.7 million or 5.7 percent in the 2011 budget, and staffing levels are increasing 387 ANP, primarily in supervision and regulation and in the monetary policy execution function in New York. The budget for the supervision and regulation function is increasing $116.5 million, or 14.4 percent, as the function plans for additional staffing resources to continue to address deterioration in the banking industry's performance and condition (193 ANP) and to implement the requirements of DFA (150 ANP). A majority of the additions for DFA are related to new responsibilities to supervise thrift holding companies. Reserve Banks also plan to add staff to strengthen supervision of the largest institutions.
Total costs for monetary policy are increasing $32.3 million or 6.4 percent and staffing is increasing 72 ANP primarily in the open market operation due to the addition of staff to apply lessons learned as a result of the financial crisis and operational reviews, implement DFA, strengthen market monitoring, and execute other analytical projects.
The budgeted expenses for services to the Treasury, which are fully reimbursable, are increasing $21.4 million, or 4.8 percent, primarily due to costs associated with the expansion of the GoDirect call center and the stored value card project as well as increased costs for the Treasury Web Application Infrastructure (TWAI) and CCMM implementation. Also contributing to the increase is severance expense related to the anticipated consolidation of Treasury retail securities operations.
Cash operation expenses are decreasing $13.4 million, or 2.8 percent, reflecting a one-time write-off of expenses related to the cash automation strategy that occurred in 2010. Staffing levels are declining due to reductions associated with the revised automation strategy and improved operational efficiencies (30 ANP).
Total check expenses are decreasing $62.0 million, or 22.1 percent, reflecting continued paper-check volume declines and the full-year effect of the paper and electronic check processing site consolidations. Check staffing levels are decreasing 186 ANP in the 2011 budget as a result of these actions. Full cost recovery is projected for all priced services in 2011.
Expenses in the loans to depository institutions and others function are decreasing $17.9 million, or 14.5 percent, primarily in New York, as a result of lower vendor fees and staff reductions as the liquidity facilities created during the financial crisis continue to wind down in 2011.
2011 Personnel Expenses
On November 29, President Obama called for a freeze on base pay for civilian federal employees and the Congress is currently considering the President's proposal. The Federal Reserve believes that the entire System should comply with the spirit of the base pay freeze given its important public mission. Therefore, the Reserve Banks are deferring all 2011 base pay increases, such as merit and equity increases. Although the proposed 2011 budgets do not include funding for base pay increases, such as merit and equity increases, they do provide funding for promotions, at the funding levels anticipated prior to the pay freeze, because the President's proposal would not affect funding for promotions. Once there is a final action on the President's proposal, we will review the appropriateness of these funding recommendations in light of the external environment.
Officer and employee salaries and other personnel expenses budgeted for 2011 total $1,745.8 million, an increase of $57.4 million, or 3.4 percent, from the 2010 estimate. The majority of the increase reflects the additional staffing planned for 2011. The 2011 budget for variable-pay program averages 11.5 percent of salary expense for officers and senior professionals and 4.4 percent for employees, the same levels as in 2010.
Five-year trend in Reserve Bank expenses
Total expenses for the Reserve Banks have grown an average of 4.0 percent annually from 2006 to the 2011 budget, with the largest percentage growth in supervision and regulation and monetary and economic policy.
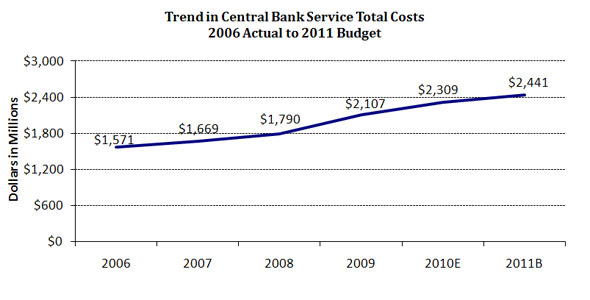
Trends in central bank services total cost
Central bank services have grown an average of 9.2 percent annually over the past five years. The increase is primarily in supervision and regulation, monetary policy, and loans to depository institutions and others where expenses have grown on average 12.1 percent annually. Expenses in the supervision and regulation function have grown on average 10.9 percent per year over the past five years and staffing has increased by 740 ANP due to additional resources necessary to recruit and retain supervisory staff with specialized skills to address financial market turmoil and declining banking conditions, as well as to address DFA requirements. The increase in monetary policy, where expenses have grown on average 10.8 percent, is driven by increased resources dedicated to regional economic research and economic policy operations. Expenses in loans to depository institutions and others have grown at an average annual rate of 29.4 percent over the past five years due to an increase in resources to support the emergency liquidity programs and other lending activities during the financial crisis.9 Expenses associated with these activities peaked in 2010 and are projected to decline in 2011. While there have been ongoing efficiency improvements in cash operations over the past five years, expenses have increased on average 5.9 percent annually reflecting increased costs to modernize the cash-processing and inventory-tracking infrastructure, along with higher support costs, particularly facilities and protection costs.
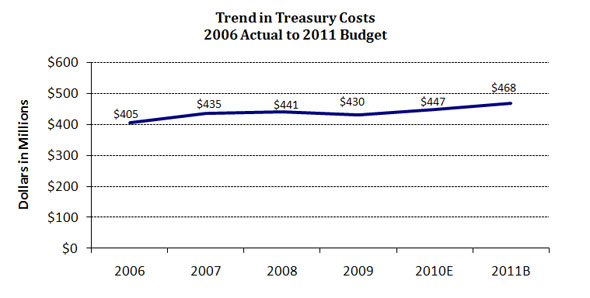
Trends in Treasury services total cost
Treasury services expenses have grown on average 2.9 percent annually since 2006. The increase in Treasury services reflects the expansion of the GoDirect call center, increased costs for the TWAI and CCMM implementation, and other requested projects.
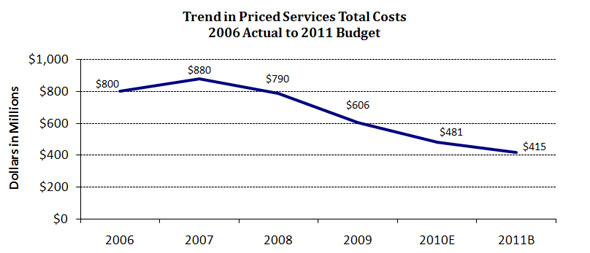
Trends in priced services total cost
Priced services expenses have been declining an average of 12.3 percent annually, driven by reductions in the check service. Continued efforts to downsize the System's paper-check operations, consistent with volume declines, have resulted in an average annual decline of 18.6 percent in check services expenses since 2006. Electronic and paper check operations were fully consolidated in 2010.
Risks in the 2011 budget
The primary 2011 budget risk relates to resources needed for the Reserve Banks' implementation of DFA. Changes resulting from DFA will directly affect roles and responsibilities in multiple areas of the Federal Reserve Banks, especially in the supervision and regulation function. The incremental resources to meet these new responsibilities continue to be evaluated by the Banks. In addition, the ability to recruit and retain supervision and regulation staff required to manage the ongoing challenges in the financial industry poses budget risk.
Treasury project changes could also increase expenses. The Treasury continues to refine its vision for its collections and cash management systems. If the Treasury changes its current direction for the CCMM initiative, additional costs and resources may be required. Other risks include accounting and legislative changes that make it difficult to predict future employee and retiree healthcare costs.10
2011 capital plan
The 2011 capital budget submitted by the Reserve Banks, FRIT, and OEB totals $417.6 million, a $60.7 million, or 17.0 percent, increase from the 2010 estimated levels but a reduction of 3.9 percent from the 2010 budget. The variance reflects project delays in New York resulting in a shift in the timing of outlays from 2010 to 2011.11 The capital budget includes funding for projects to support strategies that improve operational efficiencies, enhance services to Bank customers, and ensure a safe and productive work environment. In support of these strategies, the 2011 budget identifies three categories of capital initiatives: building and infrastructure, information technology and System automation projects, and Treasury initiatives.
The proposed capital budget includes $208.8 million for building and infrastructure projects. Of the total building capital, $58.9 million is related to major projects begun in previous years in Boston, New York, and St. Louis. New initiatives in 2011 totaling $15.5 million include an expansion of office space for supervision staff in Chicago, office refurbishments in San Francisco, security enhancements, and various facility improvement projects.
The Reserve Banks and FRIT included $163.3 million in funding for major information technology initiatives and System automation projects. Multiyear projects to migrate major applications off the mainframe represent $33.9 million of the 2011 capital budget.12 The System server consolidation effort accounts for an additional $22.5 million. Cash services initiatives represent $20.2 million of the total capital budget, including $10.2 million for the CashForward development effort. The remaining outlays will fund numerous smaller initiatives, such as scheduled software and equipment upgrades as well as telecommunications and LAN equipment for renovated or expanded office space.
The capital budget also includes $45.5 million for reimbursable Treasury initiatives, including support of TWAI, Government-Wide Accounting, CCMM, and various other projects.
Appendix -- Statistical Supplement
Table 1
Total Expenses of the FR Banks, by District
Table 2
Total Employment of the FR Banks, by District
Table 3
Total Expenses of the FR Banks, by Functional Area
Table 4
Total Employment of the FR Banks, by Functional Area
Table 5
Salary Administration Expenses of the FR Banks, by District
Table 6
Capital Outlays of the FR Banks, by District
Table 7
Capital Outlays of the FR Banks, by Category
Notes: In the following tables, Reserve Bank expenses include those budgeted by FRIT and OEB that are chargeable to the Reserve Banks.
Components may not add to totals because of rounding. Table-to-table comparisons may also differ due to rounding.
Table 1
2011 Final Budget
Total Expenses of the Federal Reserve Banks by District, 2010 and 2011 (dollars in thousands)
District
2010
Budget
2010
Estimate
2011
Budget
Percent change
10B vs. 10E
10E vs. 11B
Boston
160,841
161,541
172,363
0.4%
6.7%
New York
791,329
785,979
802,688
-0.7%
2.1%
Philadelphia
148,493
153,147
161,860
3.1%
5.7%
Cleveland
168,410
169,814
181,165
0.8%
6.7%
Richmond
294,937
298,922
320,263
1.4%
7.1%
Atlanta
354,324
341,836
324,551
-3.5%
-5.1%
Chicago
275,191
273,864
289,474
-0.5%
5.7%
St. Louis
222,488
219,054
235,526
-1.5%
7.5%
Minneapolis
150,245
149,140
157,575
-0.7%
5.7%
Kansas City
173,306
181,154
184,387
4.5%
1.8%
Dallas
185,729
187,077
204,413
0.7%
9.3%
San Francisco
296,001
314,897
290,157
6.4%
-7.9%
Total
3,221,295
3,236,426
3,324,422
0.5%
2.7%
Return to statistical supplement index
Table 2
2011 Final Budget
Total Employment of the Federal Reserve Banks by District, 2010 and 2011 (average number of personnel)
District
2010
Budget
2010
Estimate
2011
Budget
Change
10B vs. 10E
10E vs. 11B
Boston
876
872
929
-4
58
New York
3,066
3,079
3,205
13
127
Philadelphia
868
867
873
-1
7
Cleveland
1,312
1,307
1,302
-5
-6
Richmond
1,509
1,494
1,538
-15
43
Atlanta
1,717
1,682
1,648
-35
-35
Chicago
1,297
1,311
1,358
14
47
St. Louis
962
951
979
-11
28
Minneapolis
1,018
1,029
1,036
11
7
Kansas City
1,189
1,238
1,262
50
23
Dallas
1,204
1,167
1,290
-37
123
San Francisco
1,610
1,561
1,546
-50
-15
Subtotal
16,628
16,557
16,965
-71
408
FRIT
904
956
965
53
8
OEB
47
47
49
0
2
Total
17,578
17,560
17,979
-18
419
Return to statistical supplement index
Table 3
2011 Final Budget
Total Expenses of the Federal Reserve Banks by Service Line (dollars in thousands)
Year
Total
Monetary and economic policy
Services to U.S. Treasury and gov't agencies
Services to financial institutions and the public
Supervision and regulation
Fee based services to financial institutions
2006
2,776,028
320,150
405,010
700,397
550,493
799,978
2007
2,983,489
351,221
434,578
724,907
593,222
879,561
2008
3,020,762
389,219
440,669
758,595
642,238
790,042
2009
3,142,535
501,297
429,658
880,714
725,253
605,613
2010E
3,236,426
502,310
446,913
999,859
806,792
480,550
2011B
3,324,422
534,629
468,341
982,740
923,327
415,385
AAGR
2006-2011
3.7%
10.8%
2.9%
7.0%
10.9%
-12.3%
Return to statistical supplement index
Table 4
2011 Final Budget
Total Employment of the Federal Reserve Banks1 by Service Line2 (average number of personnel)
Year
Total
Monetary and economic policy
Services to U.S. Treasury and gov't agencies
Services to financial institutions and the public
Supervision and regulation
Fee based services to financial institutions
Local support and overhead
Nat'l consolidated support
Centralized svc providers
2006
19,817
915
1,282
2,722
2,657
4,272
6,366
814
790
2007
19,537
934
1,274
2,708
2,657
3,891
6,366
894
813
2008
18,747
1,010
1,199
2,594
2,674
3,064
6,362
978
865
2009
17,880
1,081
1,127
2,727
2,863
1,772
6,461
989
861
2010E
17,560
1,116
1,081
2,783
3,054
1,163
6,420
1,060
883
2011B
17,979
1,189
1,191
2,741
3,397
975
6,433
1,155
900
AAGR
2006-2011
-1.9%
5.4%
-1.5%
0.1%
5.0%
-25.6%
0.2%
7.2%
2.7%
1. Includes average number of personnel (ANP) at FRIT and OEB. Return to table.
2. Select nationally consolidated support services ANP are included in the associated business lines. Return to table.
National Consolidated Support: Support services performed on behalf of multiple Districts under a regionalized or centralized function. In this table select national consolidated support services ANP have been included in the associated business lines.
Centralized Service Providers: Support services provided by a centralized service provider within the Federal Reserve System. Includes FRIT and OEB.
Return to statistical supplement index
Table 5
2011 Final Budget
Salary Administration Expenses of the Federal Reserve Banks Officers and Employees by District, 2011 (dollars in thousands)
District
Additions to salary base
Variable pay
Total
Percent 1
Merit
Equity &market adjustments
Promotions and reclasses
Percent of budgeted salary expense
Boston
0
0
280
0.3%
244
524
0.6%
New York
0
0
3,748
1.0%
1,553
5,301
1.2%
Philadelphia
0
0
468
0.7%
94
562
0.7%
Cleveland
0
0
870
1.0%
222
1,092
1.2%
Richmond
0
0
395
0.3%
105
499
0.4%
Atlanta
0
0
650
0.5%
39
689
0.5%
Chicago
0
0
338
0.3%
-530
-192
-0.1%
St. Louis
0
0
334
0.4%
108
442
0.5%
Minneapolis
0
0
363
0.5%
797
1,161
1.4%
Kansas City
0
0
860
0.9%
85
944
0.9%
Dallas
0
0
221
0.3%
256
477
0.5%
San Francisco
0
0
453
0.3%
-776
-323
-0.2%
FRIT
0
0
485
0.5%
814
1,299
1.1%
OEB
0
0
50
0.8%
37
87
1.2%
Total
0
0
9,514
0.6%
3,047
12,562
0.7%
Merit: the amount of budgeted salary expense that reflects the cumulative effect of planned salary increases based on performance.
Promo & Reclasses: the amount of budgeted salary expense that reflects the cumulative impact of salary increases for individuals as a result of grade promotions and reclassifications resulting from a job evaluation.
Equity & Market Adjustments: the amount of budgeted salary expense to bring individual salaries to the minimum of a grade range or to better align salaries with the market.
Variable Pay: the 2011 budgeted variance over the 2010 estimate in the amount of incentive payments (payment for the achievement of pre-determined goals) and cash awards (awards in recognition of exceptional achievements).
1. Percent represents the total of the stated payments as a percentage of total salary and other personnel expense. Return to table.
Return to statistical supplement index
Table 6
2011 Final Budget
Capital Outlays of the Federal Reserve Banks by District, 2010 and 2011 (dollars in thousands)
District
2010
Budget
2010
Estimate
2011
Budget
Percent change
10B vs. 10E
10E vs. 11B
Boston
21,191
30,159
22,558
42.3%
-25.2%
New York
112,627
70,984
128,183
-37.0%
80.6%
Philadelphia
16,055
11,858
12,731
-26.1%
7.4%
Cleveland
12,014
11,447
13,781
-4.7%
20.4%
Richmond
27,806
21,594
18,311
-22.3%
-15.2%
Atlanta
27,974
32,663
27,754
16.8%
-15.0%
Chicago
36,081
33,233
31,446
-7.9%
-5.4%
St. Louis
20,082
14,568
19,418
-27.5%
33.3%
Minneapolis
13,547
13,419
16,110
-0.9%
20.1%
Kansas City
8,636
7,964
1,233
-7.8%
-84.5%
Dallas
25,324
17,659
18,676
-30.3%
5.8%
San Francisco
44,771
29,770
34,402
-33.5%
15.6%
Subtotal
366,106
295,318
344,603
-19.3%
16.7%
FRIT
64,093
57,294
70,687
-10.6%
23.4%
OEB
4,228
4,253
2,300
0.6%
-45.9%
Total
434,428
356,865
417,590
-17.9%
17.0%
Return to statistical supplement index
Table 7
2011 Final Budget
Capital Outlays of the Federal Reserve Banks1 by Category, 2010 and 2011 (dollars in thousands)
2010 Budget
2010 Estimate
2011 Budget
Percent change
10B vs. 10E
10E vs. 11B
Building / Infrastructure Projects
223,442
149,691
208,838
-33.0%
39.5%
IT & System Automation Projects
175,553
169,500
163,301
-3.4%
-3.7%
Treasury Initiatives
35,433
37,675
45,451
6.3%
20.6%
Total
434,428
356,866
417,590
-17.9%
17.0%
1. Capital outlays for the Federal Reserve System include the twelve Districts, FRIT, and OEB. Return to table.
Return to statistical supplement index
Footnotes
1. These expenses include those budgeted by Federal Reserve Information Technology and the Office of Employee Benefits that are chargeable to the Reserve Banks. Return to text.
2. ANP is the average number of employees in terms of full-time positions for the period. For instance, a full-time employee who works one-half of the year counts as 0.5 ANP for that calendar year; two half-time employees who work the full year count as 1 ANP. Return to text.
3. Includes lower vendor fees associated with the Mortgage-Backed Securities (MBS) purchase and Term Asset-Backed Securities Loan Facility (TALF) programs, and outside legal counsel. Return to text.
4. Reimbursable claims include the costs of fiscal agency and depository services provided to the U.S. Treasury, other government agencies, and other fiscal principals. Reimbursable claims are slightly higher than Treasury service expenses shown in table 1 because the reimbursable claims also include costs associated with the government's use of the Reserve Banks' check, ACH, Fedwire Funds, and Fedwire Securities services; these costs are included in priced services expense in table 1. Return to text.
5. The System recently altered its application development strategy related to the replacement of aging cash platforms. The original program, which was named CACHE, has been redefined and the new strategy calls for development in a more sequential manner, grouping work into three major phases and achieving the same end-state functionality. Return to text.
6. Treasury payment programs include programs to expand the use of stored value cards, facilitate commercial payments over the Internet, and improve the payments operations infrastructure. Return to text.
7. The Treasury plans to require individuals to receive their federal benefit payments electronically via direct deposit or prepaid debit card. This proposed rule change will require the GoDirect contact center, which currently enrolls benefit recipients in direct deposit, to expand its capacity significantly to transition a substantial portion of the nearly eleven million individuals who currently receive federal benefit checks to either direct deposit or the prepaid Direct Express® debit card. Return to text.
8. CCMM is a comprehensive multiyear initiative to streamline, modernize, and improve the services, systems, and processes supporting the Treasury's collections and cash management programs. The goal is to improve efficiency and reduce costs to the Treasury. Return to text.
9. Although some of the liquidity programs ended in February 2010, New York continues to support several liquidity programs, including Maiden Lane, Maiden Lane II, Maiden Lane III, the AIG credit facility, and TALF. Over time, expenses associated with these remaining programs will continue to diminish, but this decrease will be gradual depending on continued activity, especially for the Maiden Lane facilities. In addition, the higher expenses reflect an increase in activities related to assessing value and margining collateral pledged to the Reserve Banks and steps that New York, in particular, took structurally to manage more effectively its risk. These expenses are not likely to decrease over time and reflect additional ongoing activities. Return to text.
10. Risks include compliance with FAS 106; the volatility in retiree healthcare, long-term disability and survivor income costs caused by claims experience; participation changes; and interest rate changes. In addition, there is uncertainty about how the enactment of the Patient Protection and Affordable Health Care Act will affect the cost of medical services. Return to text.
11. New York expects to underspend its 2010 capital outlays budget by $41.6 million. Approximately $33 million of this underrun represents project delays that will shift to the 2011 budget. Return to text.
12. The System's migration strategy involves moving most applications from the mainframe to a distributed environment. The migration strategy is managed in stages to minimize excess capacity and expenses. Projects included in the 2011 budget include the migration of the Fedwire, FedACH, check, and the accounting system. Return to text.
- Date: December 15, 2010
- To: Board of Governors
- From: Janet Yellen (Initialed)
- Subject: 2011 Final Reserve Bank Budgets
The Committee on Federal Reserve Bank Affairs has reviewed staffs recommendation that the Board approve the Reserve Bank budgets for 2011. In aggregate, the Reserve Bank budgets total $3,324.4 million, an increase of $88.0 million, or 2.7 percent over 2010 estimated expenses. I am forwarding the attached staff memorandum to the Board for its consideration.
Board of Governors of the Federal Reserve System
Division of Reserve Bank Operations and Payment Systems
- Date: December 15, 2010
- To: Board of Governors
- From: Kelsi Wilken, Becky Royer, Lauren Guerin, Dorothy LaChapelle, Don Hammond
- Subject: 2011 Final Reserve Bank Budgets
Action Requested
Staff recommends that the Board approve the 2011 Reserve Bank budgets totaling $3,324.4 million, an increase of $88.0 million, or 2.7 percent, from the 2010 estimated expenses and $103.1 million, or 3.2 percent, from the approved 2010 budget.1 Staff also requests that the Board approve the 2011 Reserve Bank, Federal Reserve Information Technology (FRIT), and the Office of Employee Benefits (OEB) capital budgets, which total $417.6 million. The capital budgets are approved with the understanding that approval for actual capital outlays will be in accordance with the Boards Policies and Guidelines Concerning Reserve Bank Operations (FRAM 1-049). We have attached additional statistical information that provides details on expenses, staffing, and capital outlays.
The Federal Reserve believes it is important that the entire System comply with the spirit of President Obamas proposal to freeze the base pay of civilian federal government employees. Therefore, the proposed 2011 budgets do not include funding for base pay increases, such as merit or equity increases, for Bank officers or staff. The proposed budgets do provide funding for promotions, at the funding levels anticipated prior to the pay freeze, because the Presidents proposal would not prohibit promotions. Once there is final action on the Presidents proposal, we will review the appropriateness of these funding recommendations in light of the external environment.

Total Expense and Employment Summary
The 2011 operating budgets of the Reserve Banks' total $3,324.4 million. The 2011 budget is $88.0 million, or 2.7 percent, higher than the 2010 estimate. Total 2011 projected employment for the Reserve Banks, FRIT, and OEB is 17,979 ANP, an increase of 419 ANP, or 2.4 percent, from 2010 estimated staff levels.2 The expense growth is driven by increases in central bank functions, specifically those related to supervision and regulation and the open market operation in New York. In particular, implementation of the Dodd-Frank Wall Street Reform and Consumer Protection Act (DFA) accounts for significant budget growth. These increases are partially offset by decreases in priced services costs as a result of continued paper-check volume declines and the full-year effect of consolidations. The increase in expenses is further offset by a reduction in vendor fees and staffing related to the winding down or closing of the liquidity facilities in New York.3
| 2010 Budget | 2010 Estimate | 2011 Budget | 2010 Est. vs. 2011 Bud. | ||
|---|---|---|---|---|---|
| Amount | Percent | ||||
| Central bank services | $2,270.0 | $2,309.0 | $2,440.7 | $131.7 | 5.7% |
| Treasury services | $444.4 | $446.9 | $468.3 | $21.4 | 4.8% |
| Priced services | $506.9 | $480.6 | $415.4 | ($65.2) | -13.6% |
| Total expense | $3,221.3 | $3,236.4 | $3,324.4 | $88.0 | 2.7% |
| Check | $309.9 | $280.8 | $218.8 | ($62.0) | -22.1% |
| Total expense less check | $2,911.4 | $2,955.6 | $3,105.7 | $150.0 | 6.3% |
| Total staffing1 | 17,578 | 17,560 | 17,979 | 419 | 2.4% |
| Check2 | 941 | 833 | 648 | -186 | -22.3% |
| Total staffing less check | 16,637 | 16,727 | 17,331 | 604 | 3.6% |
2. Check ANP includes associated national provided consolidated support services. Return to table.
Budgeted expenses for 2011, net of revenue and reimbursements, are expected to increase $141.1 million, or 6.4 percent, from 2010 estimated expenses. Thirty percent of Reserve Bank expenses in the 2011 budget are offset by priced service revenues (15 percent) and reimbursable claims for services provided to the Treasury and other agencies (15 percent).4 Budgeted 2011 priced services revenue is lower than the 2010 estimated level, primarily as a result of an increasing proportion of checks being deposited and presented electronically, which have lower fees than paper checks, and declining check volume. Reimbursable claims are expected to increase in 2011, reflecting increased activity on key Treasury projects.
| 2010 Budget | 2010 Estimate | 2011 Budget | Percent change | ||
|---|---|---|---|---|---|
| 10B vs. 11B | 10E vs. 11B | ||||
| Total expense | $3,221.3 | $3,236.4 | $3,324.4 | 3.2% | 2.7% |
| Less: | |||||
| Priced services revenue | $565.9 | $573.3 | $497.2 | -12.1% | -13.3% |
| Reimbursable claims | $463.2 | $466.4 | $489.4 | 5.7% | 4.9% |
| Net expenses | $2,192.1 | $2,196.7 | $2,337.8 | 6.6% | 6.4% |
2011 staffing levels are projected to increase as resources are added for supervision and regulation in all Districts. Although priced service operational staffing levels have continued to decline largely due to the effect of infrastructure changes and paper-check volume declines, staffing for central bank functions has increased. Over the past five years staffing levels have declined in check and cash, as well as support areas such as law enforcement and facilities management, reflecting efficiencies and consolidation efforts. Over the same period, staffing for supervision and regulation and for the FRB New York monetary policy operation has grown as Reserve Banks have increased resources to address the financial crisis and deteriorating banking conditions. Information technology resources have also increased as Banks have modernized their critical applications, strengthened information security, and improved business functionality.
2010 Budget Performance
Total 2010 expenses are estimated to be $3,236.4 million, which represents an increase of $15.1 million, or 0.5 percent, from the approved 2010 budget of $3,221.3 million. Total 2010 estimated staffing of 17,560 ANP represents a decrease of 18 ANP from 2010 budgeted levels of 17,578 ANP.
The estimated expense increase compared with budget is driven by expanded responsibilities in supervision and regulation to address the deterioration in community and regional banking portfolios, as well as additional staffing to strengthen supervision of the largest institutions, associated macro-prudential efforts, and enhanced operating procedures ($22.6 million and 58 ANP). Also contributing to the overrun is an anticipated write-off of CACHE program hardware and software ($20.2 million), which cannot be used under the revised automation strategy for the cash project, now referred to as CashForward.5 Additional resources are also necessary to assess financial risk, and to evaluate credit risk and advise on risks related to lending programs ($6.2 million or 7.4 percent).
The overrun in Treasury services ($2.5 million or 0.6 percent) reflects the Treasury's request to expand several projects including the Treasury payment programs and the GoDirect call center.6,7
Partially offsetting the overrun are decreased expenses in the check function ($29.1 million). In 2010 the System completed a multi-year effort to consolidate check operations to one full-service paper-check processing site and one electronic check processing site. The paper-check transition was completed first quarter 2010 and the electronic check transition was completed in fourth quarter 2010. Significant reductions in the check adjustments function and check transportation services were also achieved as a result of declines in paper check volume. The loans to depository institutions and others function is under budget due to reductions in resources related to the liquidity facilities, and lower TALF vendor fees due to the decline in the volume of loans outstanding ($12.1 million). In addition, fee reductions in the monetary policy operation are due mainly to renegotiated MBS vendor contracts ($8.3 million).
The underrun in total staffing of 18 ANP, compared with the approved budget, reflects the significant decline in check operations (105 ANP). In addition, other functions reduced staffing including law enforcement as operations were streamlined (31 ANP), Treasury services due to volume declines in Treasury retail securities and hiring delays in Cash Management Modernization (CCMM) projects (25 ANP), and loans to depository institutions and others as a result of lower loan volume (25 ANP).8 Offsetting these underruns are increased staffing at FRIT, primarily to support the System's server consolidation initiative (111 ANP), and in the supervision and regulation function due to current banking conditions (58 ANP).
Initiatives Affecting the 2011 Budget
The 2011 growth in Reserve Banks' budgets reflects several initiatives. In the central bank area, which includes monetary policy, services to financial institutions and the public, and supervision and regulation, total expenses are increasing $131.7 million or 5.7 percent in the 2011 budget, and staffing levels are increasing 387 ANP, primarily in supervision and regulation and in the monetary policy execution function in New York. The budget for the supervision and regulation function is increasing $116.5 million, or 14.4 percent, as the function plans for additional staffing resources to continue to address deterioration in the banking industry's performance and condition (193 ANP) and to implement the requirements of DFA (150 ANP). A majority of the additions for DFA are related to new responsibilities to supervise thrift holding companies. Reserve Banks also plan to add staff to strengthen supervision of the largest institutions.
Total costs for monetary policy are increasing $32.3 million or 6.4 percent and staffing is increasing 72 ANP primarily in the open market operation due to the addition of staff to apply lessons learned as a result of the financial crisis and operational reviews, implement DFA, strengthen market monitoring, and execute other analytical projects.
The budgeted expenses for services to the Treasury, which are fully reimbursable, are increasing $21.4 million, or 4.8 percent, primarily due to costs associated with the expansion of the GoDirect call center and the stored value card project as well as increased costs for the Treasury Web Application Infrastructure (TWAI) and CCMM implementation. Also contributing to the increase is severance expense related to the anticipated consolidation of Treasury retail securities operations.
Cash operation expenses are decreasing $13.4 million, or 2.8 percent, reflecting a one-time write-off of expenses related to the cash automation strategy that occurred in 2010. Staffing levels are declining due to reductions associated with the revised automation strategy and improved operational efficiencies (30 ANP).
Total check expenses are decreasing $62.0 million, or 22.1 percent, reflecting continued paper-check volume declines and the full-year effect of the paper and electronic check processing site consolidations. Check staffing levels are decreasing 186 ANP in the 2011 budget as a result of these actions. Full cost recovery is projected for all priced services in 2011.
Expenses in the loans to depository institutions and others function are decreasing $17.9 million, or 14.5 percent, primarily in New York, as a result of lower vendor fees and staff reductions as the liquidity facilities created during the financial crisis continue to wind down in 2011.
2011 Personnel Expenses
On November 29, President Obama called for a freeze on base pay for civilian federal employees and the Congress is currently considering the President's proposal. The Federal Reserve believes that the entire System should comply with the spirit of the base pay freeze given its important public mission. Therefore, the Reserve Banks are deferring all 2011 base pay increases, such as merit and equity increases. Although the proposed 2011 budgets do not include funding for base pay increases, such as merit and equity increases, they do provide funding for promotions, at the funding levels anticipated prior to the pay freeze, because the President's proposal would not affect funding for promotions. Once there is a final action on the President's proposal, we will review the appropriateness of these funding recommendations in light of the external environment.
Officer and employee salaries and other personnel expenses budgeted for 2011 total $1,745.8 million, an increase of $57.4 million, or 3.4 percent, from the 2010 estimate. The majority of the increase reflects the additional staffing planned for 2011. The 2011 budget for variable-pay program averages 11.5 percent of salary expense for officers and senior professionals and 4.4 percent for employees, the same levels as in 2010.
Five-year trend in Reserve Bank expenses
Total expenses for the Reserve Banks have grown an average of 4.0 percent annually from 2006 to the 2011 budget, with the largest percentage growth in supervision and regulation and monetary and economic policy.
Trends in central bank services total cost
Central bank services have grown an average of 9.2 percent annually over the past five years. The increase is primarily in supervision and regulation, monetary policy, and loans to depository institutions and others where expenses have grown on average 12.1 percent annually. Expenses in the supervision and regulation function have grown on average 10.9 percent per year over the past five years and staffing has increased by 740 ANP due to additional resources necessary to recruit and retain supervisory staff with specialized skills to address financial market turmoil and declining banking conditions, as well as to address DFA requirements. The increase in monetary policy, where expenses have grown on average 10.8 percent, is driven by increased resources dedicated to regional economic research and economic policy operations. Expenses in loans to depository institutions and others have grown at an average annual rate of 29.4 percent over the past five years due to an increase in resources to support the emergency liquidity programs and other lending activities during the financial crisis.9 Expenses associated with these activities peaked in 2010 and are projected to decline in 2011. While there have been ongoing efficiency improvements in cash operations over the past five years, expenses have increased on average 5.9 percent annually reflecting increased costs to modernize the cash-processing and inventory-tracking infrastructure, along with higher support costs, particularly facilities and protection costs.
Trends in Treasury services total cost
Treasury services expenses have grown on average 2.9 percent annually since 2006. The increase in Treasury services reflects the expansion of the GoDirect call center, increased costs for the TWAI and CCMM implementation, and other requested projects.
Trends in priced services total cost
Priced services expenses have been declining an average of 12.3 percent annually, driven by reductions in the check service. Continued efforts to downsize the System's paper-check operations, consistent with volume declines, have resulted in an average annual decline of 18.6 percent in check services expenses since 2006. Electronic and paper check operations were fully consolidated in 2010.
Risks in the 2011 budget
The primary 2011 budget risk relates to resources needed for the Reserve Banks' implementation of DFA. Changes resulting from DFA will directly affect roles and responsibilities in multiple areas of the Federal Reserve Banks, especially in the supervision and regulation function. The incremental resources to meet these new responsibilities continue to be evaluated by the Banks. In addition, the ability to recruit and retain supervision and regulation staff required to manage the ongoing challenges in the financial industry poses budget risk.
Treasury project changes could also increase expenses. The Treasury continues to refine its vision for its collections and cash management systems. If the Treasury changes its current direction for the CCMM initiative, additional costs and resources may be required. Other risks include accounting and legislative changes that make it difficult to predict future employee and retiree healthcare costs.10
2011 capital plan
The 2011 capital budget submitted by the Reserve Banks, FRIT, and OEB totals $417.6 million, a $60.7 million, or 17.0 percent, increase from the 2010 estimated levels but a reduction of 3.9 percent from the 2010 budget. The variance reflects project delays in New York resulting in a shift in the timing of outlays from 2010 to 2011.11 The capital budget includes funding for projects to support strategies that improve operational efficiencies, enhance services to Bank customers, and ensure a safe and productive work environment. In support of these strategies, the 2011 budget identifies three categories of capital initiatives: building and infrastructure, information technology and System automation projects, and Treasury initiatives.
The proposed capital budget includes $208.8 million for building and infrastructure projects. Of the total building capital, $58.9 million is related to major projects begun in previous years in Boston, New York, and St. Louis. New initiatives in 2011 totaling $15.5 million include an expansion of office space for supervision staff in Chicago, office refurbishments in San Francisco, security enhancements, and various facility improvement projects.
The Reserve Banks and FRIT included $163.3 million in funding for major information technology initiatives and System automation projects. Multiyear projects to migrate major applications off the mainframe represent $33.9 million of the 2011 capital budget.12 The System server consolidation effort accounts for an additional $22.5 million. Cash services initiatives represent $20.2 million of the total capital budget, including $10.2 million for the CashForward development effort. The remaining outlays will fund numerous smaller initiatives, such as scheduled software and equipment upgrades as well as telecommunications and LAN equipment for renovated or expanded office space.
The capital budget also includes $45.5 million for reimbursable Treasury initiatives, including support of TWAI, Government-Wide Accounting, CCMM, and various other projects.
Appendix -- Statistical Supplement
| Table 1 | Total Expenses of the FR Banks, by District |
| Table 2 | Total Employment of the FR Banks, by District |
| Table 3 | Total Expenses of the FR Banks, by Functional Area |
| Table 4 | Total Employment of the FR Banks, by Functional Area |
| Table 5 | Salary Administration Expenses of the FR Banks, by District |
| Table 6 | Capital Outlays of the FR Banks, by District |
| Table 7 | Capital Outlays of the FR Banks, by Category |
Notes: In the following tables, Reserve Bank expenses include those budgeted by FRIT and OEB that are chargeable to the Reserve Banks.
Components may not add to totals because of rounding. Table-to-table comparisons may also differ due to rounding.
Table 1
2011 Final Budget
Total Expenses of the Federal Reserve Banks by District, 2010 and 2011 (dollars in thousands)
| District |
2010 Budget |
2010 Estimate |
2011 Budget |
Percent change | |
|---|---|---|---|---|---|
| 10B vs. 10E | 10E vs. 11B | ||||
| Boston | 160,841 | 161,541 | 172,363 | 0.4% | 6.7% |
| New York | 791,329 | 785,979 | 802,688 | -0.7% | 2.1% |
| Philadelphia | 148,493 | 153,147 | 161,860 | 3.1% | 5.7% |
| Cleveland | 168,410 | 169,814 | 181,165 | 0.8% | 6.7% |
| Richmond | 294,937 | 298,922 | 320,263 | 1.4% | 7.1% |
| Atlanta | 354,324 | 341,836 | 324,551 | -3.5% | -5.1% |
| Chicago | 275,191 | 273,864 | 289,474 | -0.5% | 5.7% |
| St. Louis | 222,488 | 219,054 | 235,526 | -1.5% | 7.5% |
| Minneapolis | 150,245 | 149,140 | 157,575 | -0.7% | 5.7% |
| Kansas City | 173,306 | 181,154 | 184,387 | 4.5% | 1.8% |
| Dallas | 185,729 | 187,077 | 204,413 | 0.7% | 9.3% |
| San Francisco | 296,001 | 314,897 | 290,157 | 6.4% | -7.9% |
| Total | 3,221,295 | 3,236,426 | 3,324,422 | 0.5% | 2.7% |
Return to statistical supplement index
Table 2
2011 Final Budget
Total Employment of the Federal Reserve Banks by District, 2010 and 2011 (average number of personnel)
| District |
2010 Budget |
2010 Estimate |
2011 Budget |
Change | |
|---|---|---|---|---|---|
| 10B vs. 10E | 10E vs. 11B | ||||
| Boston | 876 | 872 | 929 | -4 | 58 |
| New York | 3,066 | 3,079 | 3,205 | 13 | 127 |
| Philadelphia | 868 | 867 | 873 | -1 | 7 |
| Cleveland | 1,312 | 1,307 | 1,302 | -5 | -6 |
| Richmond | 1,509 | 1,494 | 1,538 | -15 | 43 |
| Atlanta | 1,717 | 1,682 | 1,648 | -35 | -35 |
| Chicago | 1,297 | 1,311 | 1,358 | 14 | 47 |
| St. Louis | 962 | 951 | 979 | -11 | 28 |
| Minneapolis | 1,018 | 1,029 | 1,036 | 11 | 7 |
| Kansas City | 1,189 | 1,238 | 1,262 | 50 | 23 |
| Dallas | 1,204 | 1,167 | 1,290 | -37 | 123 |
| San Francisco | 1,610 | 1,561 | 1,546 | -50 | -15 |
| Subtotal | 16,628 | 16,557 | 16,965 | -71 | 408 |
| FRIT | 904 | 956 | 965 | 53 | 8 |
| OEB | 47 | 47 | 49 | 0 | 2 |
| Total | 17,578 | 17,560 | 17,979 | -18 | 419 |
Return to statistical supplement index
Table 3
2011 Final Budget
Total Expenses of the Federal Reserve Banks by Service Line (dollars in thousands)
| Year | Total | Monetary and economic policy | Services to U.S. Treasury and gov't agencies | Services to financial institutions and the public | Supervision and regulation | Fee based services to financial institutions |
|---|---|---|---|---|---|---|
| 2006 | 2,776,028 | 320,150 | 405,010 | 700,397 | 550,493 | 799,978 |
| 2007 | 2,983,489 | 351,221 | 434,578 | 724,907 | 593,222 | 879,561 |
| 2008 | 3,020,762 | 389,219 | 440,669 | 758,595 | 642,238 | 790,042 |
| 2009 | 3,142,535 | 501,297 | 429,658 | 880,714 | 725,253 | 605,613 |
| 2010E | 3,236,426 | 502,310 | 446,913 | 999,859 | 806,792 | 480,550 |
| 2011B | 3,324,422 | 534,629 | 468,341 | 982,740 | 923,327 | 415,385 |
|
AAGR 2006-2011 |
3.7% | 10.8% | 2.9% | 7.0% | 10.9% | -12.3% |
Return to statistical supplement index
Table 4
2011 Final Budget
Total Employment of the Federal Reserve Banks1 by Service Line2 (average number of personnel)
| Year | Total | Monetary and economic policy | Services to U.S. Treasury and gov't agencies | Services to financial institutions and the public | Supervision and regulation | Fee based services to financial institutions | Local support and overhead | Nat'l consolidated support | Centralized svc providers |
|---|---|---|---|---|---|---|---|---|---|
| 2006 | 19,817 | 915 | 1,282 | 2,722 | 2,657 | 4,272 | 6,366 | 814 | 790 |
| 2007 | 19,537 | 934 | 1,274 | 2,708 | 2,657 | 3,891 | 6,366 | 894 | 813 |
| 2008 | 18,747 | 1,010 | 1,199 | 2,594 | 2,674 | 3,064 | 6,362 | 978 | 865 |
| 2009 | 17,880 | 1,081 | 1,127 | 2,727 | 2,863 | 1,772 | 6,461 | 989 | 861 |
| 2010E | 17,560 | 1,116 | 1,081 | 2,783 | 3,054 | 1,163 | 6,420 | 1,060 | 883 |
| 2011B | 17,979 | 1,189 | 1,191 | 2,741 | 3,397 | 975 | 6,433 | 1,155 | 900 |
|
AAGR 2006-2011 |
-1.9% | 5.4% | -1.5% | 0.1% | 5.0% | -25.6% | 0.2% | 7.2% | 2.7% |
1. Includes average number of personnel (ANP) at FRIT and OEB. Return to table.
2. Select nationally consolidated support services ANP are included in the associated business lines. Return to table.
National Consolidated Support: Support services performed on behalf of multiple Districts under a regionalized or centralized function. In this table select national consolidated support services ANP have been included in the associated business lines.
Centralized Service Providers: Support services provided by a centralized service provider within the Federal Reserve System. Includes FRIT and OEB.
Return to statistical supplement index
Table 5
2011 Final Budget
Salary Administration Expenses of the Federal Reserve Banks Officers and Employees by District, 2011 (dollars in thousands)
| District | Additions to salary base | Variable pay | Total | Percent 1 | |||
|---|---|---|---|---|---|---|---|
| Merit | Equity &market adjustments | Promotions and reclasses | Percent of budgeted salary expense | ||||
| Boston | 0 | 0 | 280 | 0.3% | 244 | 524 | 0.6% |
| New York | 0 | 0 | 3,748 | 1.0% | 1,553 | 5,301 | 1.2% |
| Philadelphia | 0 | 0 | 468 | 0.7% | 94 | 562 | 0.7% |
| Cleveland | 0 | 0 | 870 | 1.0% | 222 | 1,092 | 1.2% |
| Richmond | 0 | 0 | 395 | 0.3% | 105 | 499 | 0.4% |
| Atlanta | 0 | 0 | 650 | 0.5% | 39 | 689 | 0.5% |
| Chicago | 0 | 0 | 338 | 0.3% | -530 | -192 | -0.1% |
| St. Louis | 0 | 0 | 334 | 0.4% | 108 | 442 | 0.5% |
| Minneapolis | 0 | 0 | 363 | 0.5% | 797 | 1,161 | 1.4% |
| Kansas City | 0 | 0 | 860 | 0.9% | 85 | 944 | 0.9% |
| Dallas | 0 | 0 | 221 | 0.3% | 256 | 477 | 0.5% |
| San Francisco | 0 | 0 | 453 | 0.3% | -776 | -323 | -0.2% |
| FRIT | 0 | 0 | 485 | 0.5% | 814 | 1,299 | 1.1% |
| OEB | 0 | 0 | 50 | 0.8% | 37 | 87 | 1.2% |
| Total | 0 | 0 | 9,514 | 0.6% | 3,047 | 12,562 | 0.7% |
Merit: the amount of budgeted salary expense that reflects the cumulative effect of planned salary increases based on performance.
Promo & Reclasses: the amount of budgeted salary expense that reflects the cumulative impact of salary increases for individuals as a result of grade promotions and reclassifications resulting from a job evaluation.
Equity & Market Adjustments: the amount of budgeted salary expense to bring individual salaries to the minimum of a grade range or to better align salaries with the market.
Variable Pay: the 2011 budgeted variance over the 2010 estimate in the amount of incentive payments (payment for the achievement of pre-determined goals) and cash awards (awards in recognition of exceptional achievements).
1. Percent represents the total of the stated payments as a percentage of total salary and other personnel expense. Return to table.
Return to statistical supplement index
Table 6
2011 Final Budget
Capital Outlays of the Federal Reserve Banks by District, 2010 and 2011 (dollars in thousands)
| District |
2010 Budget |
2010 Estimate |
2011 Budget |
Percent change | |
|---|---|---|---|---|---|
| 10B vs. 10E | 10E vs. 11B | ||||
| Boston | 21,191 | 30,159 | 22,558 | 42.3% | -25.2% |
| New York | 112,627 | 70,984 | 128,183 | -37.0% | 80.6% |
| Philadelphia | 16,055 | 11,858 | 12,731 | -26.1% | 7.4% |
| Cleveland | 12,014 | 11,447 | 13,781 | -4.7% | 20.4% |
| Richmond | 27,806 | 21,594 | 18,311 | -22.3% | -15.2% |
| Atlanta | 27,974 | 32,663 | 27,754 | 16.8% | -15.0% |
| Chicago | 36,081 | 33,233 | 31,446 | -7.9% | -5.4% |
| St. Louis | 20,082 | 14,568 | 19,418 | -27.5% | 33.3% |
| Minneapolis | 13,547 | 13,419 | 16,110 | -0.9% | 20.1% |
| Kansas City | 8,636 | 7,964 | 1,233 | -7.8% | -84.5% |
| Dallas | 25,324 | 17,659 | 18,676 | -30.3% | 5.8% |
| San Francisco | 44,771 | 29,770 | 34,402 | -33.5% | 15.6% |
| Subtotal | 366,106 | 295,318 | 344,603 | -19.3% | 16.7% |
| FRIT | 64,093 | 57,294 | 70,687 | -10.6% | 23.4% |
| OEB | 4,228 | 4,253 | 2,300 | 0.6% | -45.9% |
| Total | 434,428 | 356,865 | 417,590 | -17.9% | 17.0% |
Return to statistical supplement index
Table 7
2011 Final Budget
Capital Outlays of the Federal Reserve Banks1 by Category, 2010 and 2011 (dollars in thousands)
| 2010 Budget | 2010 Estimate | 2011 Budget | Percent change | ||
|---|---|---|---|---|---|
| 10B vs. 10E | 10E vs. 11B | ||||
| Building / Infrastructure Projects | 223,442 | 149,691 | 208,838 | -33.0% | 39.5% |
| IT & System Automation Projects | 175,553 | 169,500 | 163,301 | -3.4% | -3.7% |
| Treasury Initiatives | 35,433 | 37,675 | 45,451 | 6.3% | 20.6% |
| Total | 434,428 | 356,866 | 417,590 | -17.9% | 17.0% |
1. Capital outlays for the Federal Reserve System include the twelve Districts, FRIT, and OEB. Return to table.
Return to statistical supplement index
Footnotes
1. These expenses include those budgeted by Federal Reserve Information Technology and the Office of Employee Benefits that are chargeable to the Reserve Banks. Return to text.
2. ANP is the average number of employees in terms of full-time positions for the period. For instance, a full-time employee who works one-half of the year counts as 0.5 ANP for that calendar year; two half-time employees who work the full year count as 1 ANP. Return to text.
3. Includes lower vendor fees associated with the Mortgage-Backed Securities (MBS) purchase and Term Asset-Backed Securities Loan Facility (TALF) programs, and outside legal counsel. Return to text.
4. Reimbursable claims include the costs of fiscal agency and depository services provided to the U.S. Treasury, other government agencies, and other fiscal principals. Reimbursable claims are slightly higher than Treasury service expenses shown in table 1 because the reimbursable claims also include costs associated with the government's use of the Reserve Banks' check, ACH, Fedwire Funds, and Fedwire Securities services; these costs are included in priced services expense in table 1. Return to text.
5. The System recently altered its application development strategy related to the replacement of aging cash platforms. The original program, which was named CACHE, has been redefined and the new strategy calls for development in a more sequential manner, grouping work into three major phases and achieving the same end-state functionality. Return to text.
6. Treasury payment programs include programs to expand the use of stored value cards, facilitate commercial payments over the Internet, and improve the payments operations infrastructure. Return to text.
7. The Treasury plans to require individuals to receive their federal benefit payments electronically via direct deposit or prepaid debit card. This proposed rule change will require the GoDirect contact center, which currently enrolls benefit recipients in direct deposit, to expand its capacity significantly to transition a substantial portion of the nearly eleven million individuals who currently receive federal benefit checks to either direct deposit or the prepaid Direct Express® debit card. Return to text.
8. CCMM is a comprehensive multiyear initiative to streamline, modernize, and improve the services, systems, and processes supporting the Treasury's collections and cash management programs. The goal is to improve efficiency and reduce costs to the Treasury. Return to text.
9. Although some of the liquidity programs ended in February 2010, New York continues to support several liquidity programs, including Maiden Lane, Maiden Lane II, Maiden Lane III, the AIG credit facility, and TALF. Over time, expenses associated with these remaining programs will continue to diminish, but this decrease will be gradual depending on continued activity, especially for the Maiden Lane facilities. In addition, the higher expenses reflect an increase in activities related to assessing value and margining collateral pledged to the Reserve Banks and steps that New York, in particular, took structurally to manage more effectively its risk. These expenses are not likely to decrease over time and reflect additional ongoing activities. Return to text.
10. Risks include compliance with FAS 106; the volatility in retiree healthcare, long-term disability and survivor income costs caused by claims experience; participation changes; and interest rate changes. In addition, there is uncertainty about how the enactment of the Patient Protection and Affordable Health Care Act will affect the cost of medical services. Return to text.
11. New York expects to underspend its 2010 capital outlays budget by $41.6 million. Approximately $33 million of this underrun represents project delays that will shift to the 2011 budget. Return to text.
12. The System's migration strategy involves moving most applications from the mainframe to a distributed environment. The migration strategy is managed in stages to minimize excess capacity and expenses. Projects included in the 2011 budget include the migration of the Fedwire, FedACH, check, and the accounting system. Return to text.
