- February 24, 2009: Part 1
- Part 2
- Part 3
- Part 4
- Appendix
- Abbreviations
- Printable Version (872 KB PDF)

Sections of Part 2
Part 2: Recent Financial and Economic Developments
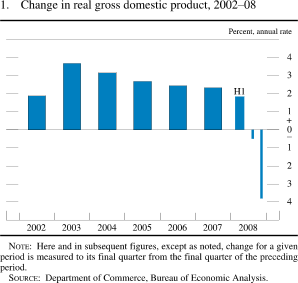
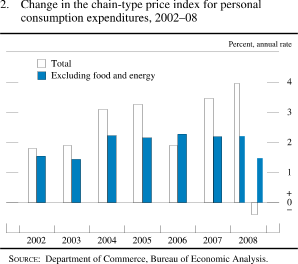
Monetary Policy Report submitted to the Congress on February 24, 2009, pursuant to section 2B of the Federal Reserve ActThe downturn in economic activity that has been unfolding since late 2007 steepened appreciably in the second half of 2008 as the strains in financial markets intensified. After the financial difficulties experienced by Fannie Mae and Freddie Mac during the summer and the bankruptcy of Lehman Brothers Holdings in mid-September, short-term funding markets were severely disrupted, risk spreads shot up, equity prices plunged, and markets for private asset-backed securities remained largely shut down. As a result, pressures on the already strained balance sheets of financial institutions increased, thereby threatening the viability of some institutions and impinging on the flow of credit to households and businesses. In part reflecting the cascading effects of these developments throughout the wider economy, conditions in the labor market deteriorated markedly. Moreover, industrial production contracted sharply as manufacturers responded aggressively to declines in both domestic and foreign demand. According to the advance estimate from the Bureau of Economic Analysis, real gross domestic product (GDP) fell at an annual rate of 3-3/4 percent in the fourth quarter, and it seems headed for another sizable decrease in the first quarter of 2009 (figure 1). Meanwhile, inflation pressures have diminished as prices of energy and other commodities have plummeted, the margin of resource slack has widened, and the foreign exchange value of the dollar has strengthened (figure 2).
In response to the extraordinary financial strains, the Federal Reserve implemented a number of unprecedented policy initiatives to support financial stability and promote economic growth. These initiatives included lowering the target for the federal funds rate to a range of 0 to 1/4 percent, beginning direct purchases of agency debt and agency mortgage-backed securities, broadening liquidity programs to financial intermediaries and other central banks, and initiating programs in support of systemically important market segments. Other U.S. government entities also undertook extraordinary initiatives to support the financial sector by injecting capital into the banking system and providing guarantees on selected liabilities of depository institutions. Many foreign central banks and governments took similar steps. Although these actions have helped restore a measure of stability to some markets, financial conditions remain quite stressed, and aggregate credit conditions continue to be impaired as a result.
Financial Stability Developments
Evolution of the Financial Turmoil
The current period of pronounced turmoil in financial markets began in the summer of 2007 after a rapid deterioration in the performance of subprime mortgages caused largely by a downturn in house prices in some parts of the country. Investors pulled back from risktaking, and liquidity diminished sharply in the markets for interbank funding and structured credit products more generally. House prices continued to fall rapidly in the first part of 2008, mortgage delinquencies and defaults continued to climb, and concerns about credit risk mounted. The increased financial strains led to a liquidity crisis in March at The Bear Stearns Companies, Inc., a major investment bank, and to its acquisition by JPMorgan Chase & Co. Subsequent aggressive monetary policy easing and measures taken by the Federal Reserve to bolster the liquidity of financial institutions contributed to some recovery in financial markets during the spring.
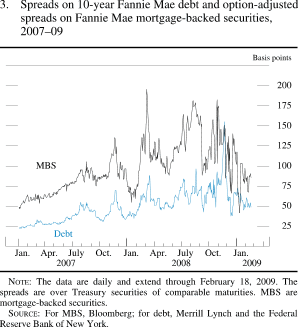
Nevertheless, strains in financial conditions intensified going into the second half of the year. In particular, amid worries that the capital of Fannie Mae and Freddie Mac would be insufficient to absorb mounting losses on their mortgage portfolios, the stock prices of the two government-sponsored enterprises (GSEs) began to decline significantly in June, and their credit default swap (CDS) spreads--which reflect investors' assessments of the likelihood of the GSEs defaulting on their debt obligations--rose sharply. Market anxiety eased somewhat in the second half of July after the Treasury proposed statutory changes, subsequently approved by the Congress, under which it could lend and provide capital to the GSEs. Nevertheless, pressures on these enterprises continued over the course of the summer; as a result, option-adjusted spreads on agency-guaranteed mortgage-backed securities (MBS) widened and interest rates on residential mortgages rose further (figure 3).
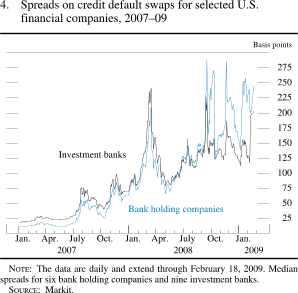
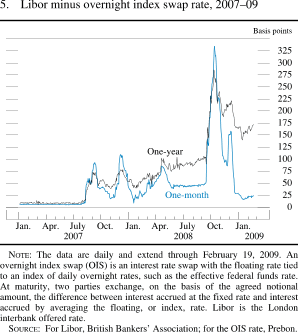
Meanwhile, investor unease about the outlook for the broader banking sector reemerged. In July, the failure of IndyMac Federal Bank, a large thrift institution, raised further concerns about the profitability and asset quality of many financial institutions. Over the summer, CDS spreads for major investment and commercial banks rose, several large institutions announced sharp declines in earnings, and anecdotal reports suggested that the ability of most financial firms to raise new capital was limited (figure 4). With banks reluctant to lend to one another, conditions in short-term funding markets continued to be strained during the summer. The relative cost of borrowing in the interbank market--as exemplified by the London interbank offered rate (Libor), a reference rate for a wide variety of contracts, including floating-rate mortgages--increased sharply (figure 5).2 In addition, required margins of collateral (known as haircuts) and bid-asked spreads widened in the markets for repurchase agreements (repos) backed by many types of securities, including agency securities that previously were considered very safe and liquid.
On September 7, the Treasury and the Federal Housing Finance Agency announced that Fannie Mae and Freddie Mac had been placed into conservatorship. To maintain the GSEs' ability to purchase home mortgages, the Treasury announced plans to establish a backstop lending facility for the GSEs, to purchase up to $100 billion of preferred stock in each of the two firms, and to initiate a program to purchase agency MBS. After the announcement, interest rate spreads on GSE debt narrowed as investors became confident that the Treasury would support the obligations of the GSEs. Option-adjusted interest rate spreads on MBS issued by the GSEs fell, and rates and spreads on new conforming fixed-rate mortgages declined. Nevertheless, other financial institutions continued to face difficulties in obtaining liquidity and capital as investors remained anxious about their solvency and, more broadly, about the implications of worsening financial conditions for the availability of credit to households and businesses and so for the economic outlook.
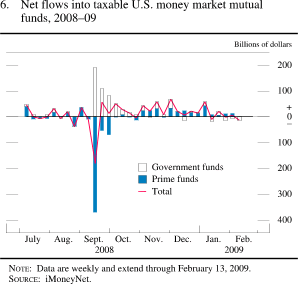
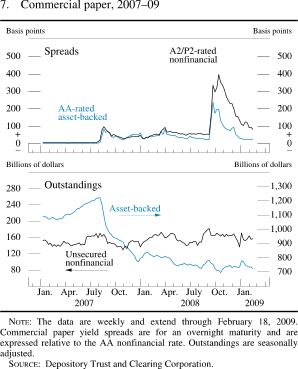
Amid this broad downturn in investor confidence, and after large mortgage-related losses in the third quarter, Lehman Brothers came under pressure as counterparties refused to provide short-term funding to the investment bank, even on a secured basis. Eventually, with no other firm willing to acquire it and with its borrowing capacity limited by a lack of collateral, Lehman Brothers filed for bankruptcy on September 15.3 Over the previous weekend, Bank of America announced its intention to acquire Merrill Lynch, which had also come under severe funding pressures. In large part because of losses on Lehman Brothers' debt, the net asset value of a major money market mutual fund fell below $1 per share--also known as "breaking the buck," an event that had not occurred in many years--thereby prompting rapid and widespread investor withdrawals from prime funds (that is, money market mutual funds that hold primarily private assets) (figure 6). Prime funds responded to the surge in redemptions by reducing their purchases of short-term assets, including commercial paper--which many businesses use to obtain working capital--and by shortening the maturity of those instruments that they did purchase, leading to a deterioration of the commercial paper market (figure 7). Meanwhile, investors increasingly demanded safe assets, and funds that hold only Treasury securities experienced a sharp increase in inflows, which caused yields on Treasury bills to plummet. Intense demands among investors to hold Treasury securities, coupled with increased concerns about counterparty credit risk, reportedly led to a substantial scaling back of activity among traditional securities lenders in the Treasury market. The decreased activity contributed, in turn, to disruptions in the Treasury repo and cash markets that were evidenced by a very high volume of fails-to-deliver. Redemptions from prime funds slowed after the Treasury and the Federal Reserve took actions in September and October to support these funds (see the appendix).
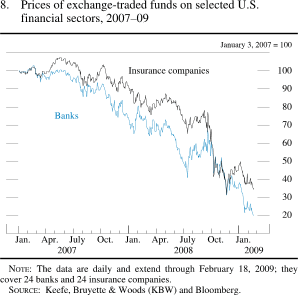
Around the same time that the difficulties at Lehman Brothers emerged, the financial condition of American International Group, Inc., or AIG--a large, complex insurance conglomerate--deteriorated rapidly, and the company found short-term funding, upon which it was heavily reliant, increasingly difficult to obtain. In view of the likely spillover effects to other financial institutions of a disorderly failure of AIG and the potential for significant pass-through effects to the broader economy, the Federal Reserve Board on September 16, with the full support of the Treasury, authorized the Federal Reserve Bank of New York to lend up to $85 billion to the firm to assist it in meeting its obligations and to facilitate the orderly sale of some of its businesses. (AIG, the Treasury, and the Federal Reserve later modified the terms of this arrangement, as described in the appendix.) Meanwhile, CDS spreads for other insurance companies rose, and their equity prices fell, amid concerns regarding their profitability and declines in the values of their investment portfolios (figure 8).
Investor anxiety about investment banks, which had escalated rapidly in the wake of Lehman Brothers' collapse, abated somewhat after Morgan Stanley and Goldman Sachs were granted bank holding company charters by the Federal Reserve. However, on September 25 the resolution of another failing financial institution, Washington Mutual, imposed significant losses on senior and subordinated debt holders as well as on shareholders. As a consequence, investors marked down their expectations regarding likely government support for the unsecured nondeposit liabilities of financial institutions, which further inhibited the ability of some banking organizations to obtain funding. Among these institutions was Wachovia Corp., the parent company of the fourth-largest U.S. bank by asset size at the time, which was ultimately acquired by Wells Fargo in early October.
Against this backdrop, investors pulled back from risk-taking even further, funding markets for terms beyond overnight largely ceased to function, and a wide variety of financial firms experienced increasing difficulty in obtaining funds and raising capital. Libor rates rose at all maturities while comparable-maturity overnight index swap (OIS) rates fell, leaving spreads at record levels. Strains were also evident in the federal funds market, in which overnight funds traded over an unusually wide range and activity in term funds dropped sharply. Conditions in repo markets worsened further, as haircuts and bid-asked spreads on non-Treasury collateral increased, and the overnight rate on general Treasury collateral traded near zero. Despite substantial new issuance, yields on short-dated Treasury bills also traded near zero. Fails-to-deliver in the Treasury market and overnight lending of securities from the portfolio of the System Open Market Account soared to record highs. Spreads on asset-backed commercial paper (ABCP) and on lower-rated unsecured commercial paper issued by nonfinancial firms widened significantly.
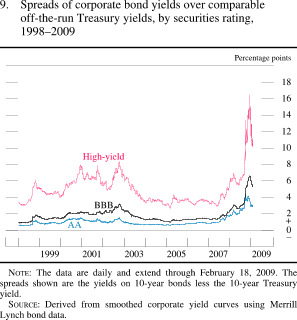
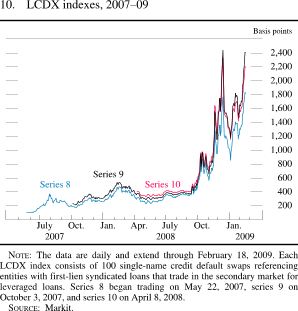
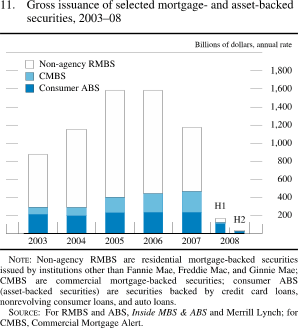
Conditions in other financial markets also deteriorated sharply in September and October. CDS spreads on corporate debt surged, and the rates on investment-grade and high-yield bonds rose dramatically relative to comparable-maturity Treasury yields (figure 9). Secondary-market bid prices for leveraged loans dropped to record-low levels as institutional investors pulled back from the market, and the implied spread on an index of loan credit default swaps (the LCDX) widened to record levels (figure 10). Bid-asked spreads on high-yield corporate bonds and leveraged loans increased significantly, and liquidity and price discovery in the CDS market remained impaired, especially for contracts involving financial firms. Spreads on commercial mortgage-backed securities (CMBS) and consumer asset-backed securities (ABS) also widened dramatically, as securitizations other than government-supported MBS came to a standstill (figure 11). The turmoil affected even the Treasury market, in which interest rate spreads between yields on the most recently issued Treasury securities and yields on comparable-maturity off-the-run securities (that is, those securities that were previously issued)--an indicator of the liquidity in this market--surged from already elevated levels. Foreign financial markets experienced many of the same disturbances as domestic markets (see the section "International Developments"). Price movements in all of these markets were likely exacerbated by sales of securities by hedge funds and other leveraged market participants in an attempt to meet mounting redemption requests on the part of their investors and other funding needs.
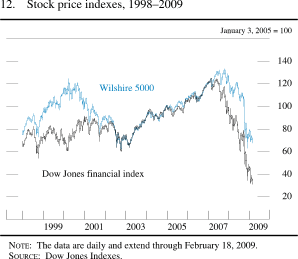
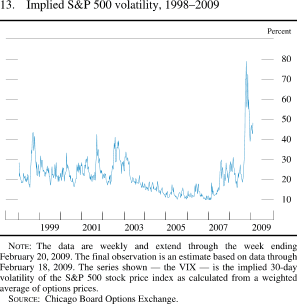
In the stock market, prices tumbled and volatility soared to record levels during the autumn as investors grew more concerned about the prospects of financial firms and about the likelihood of a deep and prolonged recession (figures 12 and 13). Equity-price declines were particularly pronounced among financial and energy firms, but they were generally widespread across sectors and were accompanied by substantial net outflows from equity mutual funds. During this period, the premium that investors demanded for holding equity shares--gauged roughly by the gap between the earnings-price ratio and the yield on Treasury securities--shot up, reflecting the heightened risk aversion that prevailed in financial markets.
Policy Actions and the Market Response
To strengthen confidence in the U.S. financial system, during the autumn the Federal Reserve, at times acting in concert with foreign central banks, expanded its existing liquidity facilities and announced several additional initiatives, including programs to support short-term funding markets and to purchase agency debt obligations and MBS. (These initiatives are discussed in more detail in the appendix.) Because of the sharply diminished availability of market funding, several Federal Reserve facilities were used heavily throughout the remainder of the year.
In addition, the Treasury announced a temporary guarantee program for money market mutual funds and proposed the Troubled Asset Relief Program (TARP) to use government funds to help stabilize the financial system; on October 3, the Congress approved and provided funding for this program as part of the Emergency Economic Stabilization Act. Using funds from the TARP, the Treasury established a voluntary capital purchase plan under which the U.S. government would buy preferred shares from eligible institutions. Additionally, under the Temporary Liquidity Guarantee Program (TLGP), the Federal Deposit Insurance Corporation (FDIC) provided a temporary guarantee for selected senior unsecured obligations of participating insured depository institutions and many of their parent holding companies as well as for all balances in non-interest-bearing transaction deposit accounts at participating insured depository institutions.
After these actions and the announcements of similar programs in a number of other countries, stresses in financial markets eased somewhat, though conditions remained strained. In the interbank funding market, Libor fixings at most maturities declined noticeably and spreads over comparable-maturity OIS rates narrowed. Meanwhile, spreads on highly rated unsecured commercial paper and ABCP narrowed after the Federal Reserve announced measures in support of this market, and issuance rebounded somewhat from its lows in September and October. Conditions in global short-term dollar funding markets also improved significantly after the Federal Reserve substantially expanded its program of liquidity swaps with foreign central banks, which increased the amount of dollar funding auctioned in foreign markets, and a number of foreign governments took measures to strengthen and stabilize their banking systems.
Despite these improvements, investors remained concerned about the soundness of financial institutions. Spreads on CDS for U.S. banks widened further in November, which raised the prospect of significant increases in banks' costs of raising the funds they needed for lending. Citigroup, in particular, saw its CDS spread widen dramatically after it announced that it would take large losses on its securities portfolio. To support market stability, the U.S. government on November 23 entered into an agreement with Citigroup to provide a package of capital, guarantees, and liquidity access. Subsequently, CDS spreads for financial institutions reversed a portion of their earlier widening, and some nonfinancial risk spreads also narrowed.
Conditions in debt markets continued to ease after the passing of year-end, although most of these markets remain much less liquid than normal. Yields and spreads on corporate bonds and commercial paper have decreased noticeably in recent weeks, but activity in the leveraged loan market continues to be very weak. Equity prices for financial firms have continued to trend downward, and CDS spreads for such firms have fluctuated around extremely elevated levels. Investors expressed renewed concern over financial institutions in January after a number of firms, most notably Bank of America Corporation, reported large net losses for the fourth quarter. The Treasury, the FDIC, and the Federal Reserve announced on January 16 that they had entered into an agreement with Bank of America to provide a package of capital, guarantees, and liquidity access (see the appendix). Although markets responded favorably to this action, the uncertain prospects of the financial sector continue to weigh heavily on market sentiment.
Banking Institutions and the Availability of Credit
Commercial bank credit grew moderately over 2008 as a whole as both businesses and households at times drew heavily on existing lending commitments, but it contracted noticeably toward the end of the year and in early 2009. In the face of the severe financial market disruptions, some companies turned to already committed lines of credit with banks, which caused the growth of commercial and industrial (C&I) loans to spike in September and October. However, C&I lending declined over the past few months as some businesses reportedly paid down outstanding loans and stepped up their issuance in the corporate bond market. In addition, banks continued to report decreased demand for credit late last year in response to slowing business investment and reduced merger and acquisition activity. Most banks continued to tighten standards and terms on C&I loans to firms of all sizes. Issuance of leveraged loans by banks, which had already been very low through the first half of last year, was essentially nil in the second half, largely because of a drop in mergers and leveraged buyouts, which these loans are often used to finance. Commercial real estate (CRE) loans on banks' books expanded over 2008 as a whole. However, with the commercial mortgage securitization market essentially closed by mid-year, the rate of growth of this loan category stepped down significantly in the second half--a decrease consistent with the reported tightening of standards and a drop-off in demand for these loans.
Bank loans to households also declined over the second half of 2008 and early 2009, led by a sharp contraction in residential mortgage loans on banks' books, as demand weakened further and banks sold such loans to the GSEs. However, loans drawn under existing revolving home equity lines of credit continued to rise briskly during the second half of the year, an increase likely influenced by a drop in the prime rate, on which the rates on such loans are often based. Growth of consumer loans originated by banks expanded at a solid pace through October but weakened considerably in November and December. However, the amount of such loans held on banks' books generally continued to expand late in the year, as banks had difficulty selling these loans because of ongoing disruptions in securitization markets. Recently, consumer loan growth has also reportedly been buoyed by banks' decisions to build inventory in anticipation of issuance into the Term Asset-Backed Securities Loan Facility (TALF).
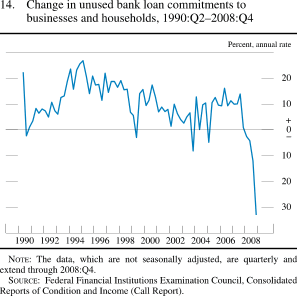
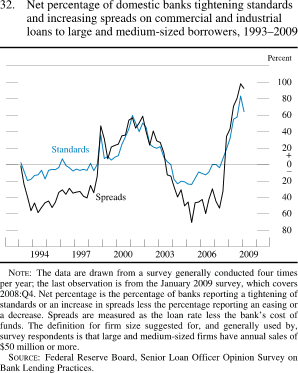
In the Senior Loan Officer Opinion Survey on Bank Lending Practices conducted in both October 2008 and January 2009, very large net fractions of banks reported having tightened lending standards for all major loan types. Significant net fractions of respondents also reported a widespread weakening of loan demand. In line with the nearly 33 percent drop (annual rate) in total unused loan commitments reported in fourth-quarter Call Reports, many banks indicated in the January survey that they had cut the size of existing credit lines to businesses and households (figure 14).
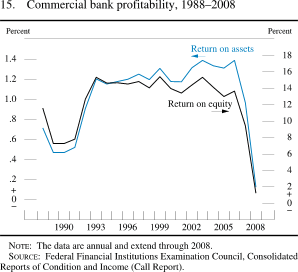
Earnings growth at depository institutions slowed markedly in 2008, and profitability as measured by return on assets and return on equity dropped dramatically (figure 15); indeed, commercial banks posted an aggregate loss in the fourth quarter. These developments in part reflected write-downs on securities holdings and increases in loan-loss provisioning in response to deteriorating asset quality. In the fourth quarter, the overall loan delinquency rate at commercial banks increased to more than 4-1/2 percent, its highest level since the early 1990s, and the total charge-off rate rose to more than 1-3/4 percent, surpassing its peaks in the previous two recessions. The ratio of loan-loss reserves to net charge-offs--an indicator of reserve adequacy--dropped below its previous nadir reached in the early 1990s.
Depository institutions' access to funding has improved as a result of the various Federal Reserve liquidity programs and the TLGP, under which eligible firms have issued $169 billion of FDIC-guaranteed bonds to date. In addition, the capital of banking organizations has been boosted by more than $200 billion of preferred stock purchases under the TARP. Still, the recent downward trend in the equity prices of most banks and the elevated level of their CDS spreads suggest that market participants remain concerned about the long-term profitability and potential insolvency of some depository institutions.
The financial turmoil has led to significant changes in the structure of the broad banking industry, with two large investment banks and one large finance company recently converting to bank holding companies to obtain better access to government funding programs; a handful of large insurance firms, motivated partly by their desire to apply for TARP funding, have likewise converted to thrift holding companies. In addition, several failures and mergers of large financial institutions resulted in increased concentrations of industry assets and deposits in 2008.
Domestic Developments
In part reflecting the intensifying deterioration in financial conditions, nearly all major sectors of the U.S. economy recorded sizable declines in activity in late 2008, and the weakness has extended into early 2009. Conditions in the labor market have worsened substantially since early autumn as employment has fallen rapidly, the unemployment rate has climbed, and firms continue to announce more layoffs. Housing remains on a steep downward trend, and both consumer spending and business investment have contracted significantly. In addition, demand for U.S. exports has slumped in response to the decline in foreign economic activity. Meanwhile, overall consumer price inflation turned negative in late 2008 as energy prices tumbled, and core inflation slowed noticeably.The Labor Market
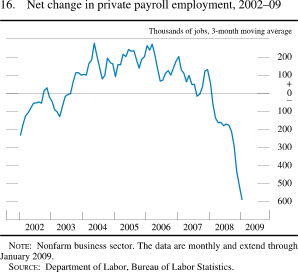
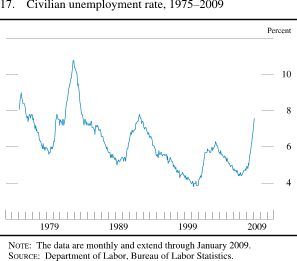
Conditions in the labor market deteriorated throughout 2008, but they worsened markedly in the autumn as job losses accelerated and the unemployment rate jumped. In total, private payrolls fell 3-3/4 million between the onset of the recession in December 2007 and January 2009, with roughly half of the reduction occurring during the past three months (figure 16). Indeed, since November, private payroll employment has fallen 600,000 per month, compared with average monthly job losses of 340,000 in September and October and 160,000 over the first eight months of 2008. The civilian unemployment rate, which stood at 4.9 percent in December 2007, has marched steadily upward over the past year, and it reached 7.6 percent in January 2009, its highest level since 1992 (figure 17). Moreover, private surveys and news reports indicate that firms plan on continuing to lay off workers in the near term.
Virtually all major industries have experienced considerable job losses recently. Manufacturing employment has fallen nearly 500,000 over the past three months and has dropped more than 1 million since December 2007. Layoffs in truck transportation and wholesale trade, which are closely related to activity in the manufacturing sector, show a similar pattern. The decline in construction employment, which began in early 2007, has also sped up, in part because the ongoing contraction in homebuilding has been accompanied more recently by weakness in nonresidential building. In the service-producing sector, job losses have mounted at retail establishments, providers of financial services, and professional and business services firms, all of which have been adversely affected by the downturn in economic activity. A noticeable exception has been the continued brisk hiring by providers of health services.
The increase in joblessness has been widespread across demographic, educational, and occupational groups. In January 2009, the unemployment rate for men aged 25 years and older was 3 percentage points above its average level in the fourth quarter of 2007, while the rate for women aged 25 years and older was up 2 percentage points; as typically occurs during recessions, unemployment rates for teenagers and young adults showed even larger increases. Among the major racial and ethnic groups, unemployment rates for blacks and Hispanics have risen somewhat more than those for whites, a differential also typical of periods when labor market conditions weaken. Moreover, the number of workers who are working part time for economic reasons--a group that includes individuals whose hours have been cut back by their employers as well as those who want full-time jobs but are unable to find them--has soared to nearly 8 million, more than 3 million above its level at the start of the recession. The increase in involuntary part-time work has been widespread across industries.
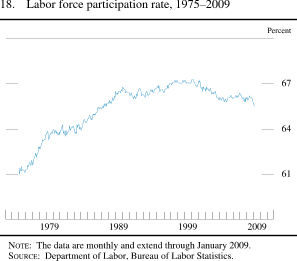
The labor force participation rate, which typically falls during periods of labor market weakness, has decreased of late (figure 18). The decline has probably been damped somewhat by the availability of extended unemployment insurance benefits, which may have encouraged some workers who would have otherwise discontinued their job search efforts to continue looking for work.4 In addition, the reduction in household wealth over the past couple of years may have prompted some individuals who would have otherwise dropped out of the labor force to remain in, and it may have caused some who would not have entered the labor force to do so.
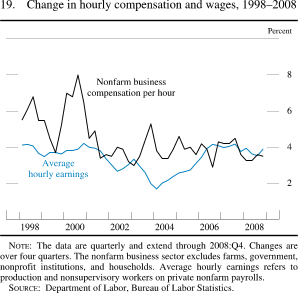
Broad measures of nominal hourly compensation, which includes both wages and benefits, posted moderate increases in 2008. For example, compensation per hour in the nonfarm business sector--a measure derived from the compensation data in the national income and product accounts (NIPA)--rose 3-1/2 percent in nominal terms in 2008, similar to the increases over the preceding few years (figure 19).
The wage component of hourly compensation also rose moderately in nominal terms in 2008, and because consumer price inflation over the year as a whole was low, much of the gain in nominal wages was reflected in higher real wages. For example, over the four quarters of last year, average hourly earnings, a measure of hourly wages for production and nonsupervisory workers, increased nearly 4 percent in nominal terms--and rose 2 percent after accounting for the rise in the price index for overall personal consumption expenditures (PCE). However, because of sharp cutbacks in hours worked, real average weekly earnings were up just 1 percent. Moreover, for many workers, real weekly earnings actually declined: In manufacturing, real average weekly earnings fell 1 percent last year, while in retail trade, this measure of real weekly earnings fell more than 2 percent.
The Household Sector
Residential Investment and Housing Finance
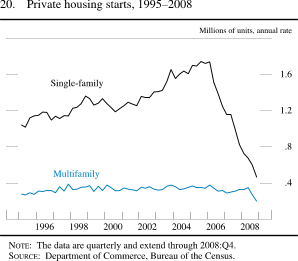
Housing activity remained on a steep downward trend in the second half of 2008. Home sales and prices slumped further, and homebuilders continued to curtail new construction in response to weak demand and elevated backlogs of unsold new homes. In the single-family sector, new units were started at an average annual rate of just 460,000 units in the fourth quarter of 2008--roughly 75 percent below the quarterly high reached in mid-2005 (figure 20). Starts in the multifamily sector averaged just 200,000 units in the fourth quarter; for 2008 as a whole, multifamily starts totaled 285,000, the lowest level in more than a decade. In all, the decline in residential investment, as measured in the NIPA, subtracted 3/4 percentage point from the annual rate of change in GDP in the second half of 2008, about as much as in the first half. The further drop in housing starts and residential building permits in January suggests that housing will continue to exert a substantial drag on the change in real GDP in early 2009.
The further contraction in housing demand in the second half of 2008 partly reflected the bleaker picture for household income and wealth. Potential homebuyers may also have been deterred by concerns about the likelihood of additional declines in house prices and fears of buying into a falling market. And while individuals who qualified for fixed-rate conforming mortgages were able to take advantage of historically low interest rates, many potential homebuyers with blemished credit histories or who were in a position to make only small down payments found it difficult to obtain loans. In the market for new single-family homes, sales fell nearly 30 percent (not at an annual rate) between the second and fourth quarters, which brought the total decline in sales since their peak in mid-2005 to 70 percent. The slippage in sales has continued to hamper builders' efforts to gain control of their inventories. Although the stock of unsold new homes fell considerably in the second half of 2008, it did not fall as much as sales; thus, the months' supply of unsold new homes continued to move up, reaching a level nearly three times that recorded during the first half of the decade. In the market for existing single-family homes, the decline in sales in recent quarters has been less pronounced than for new homes, but this situation could reflect the fact that these sales figures include some transactions involving foreclosed homes and other distressed properties, which tend to sell at heavily discounted prices. Existing home sales ended the year more than 30 percent below the highs of a few years earlier.
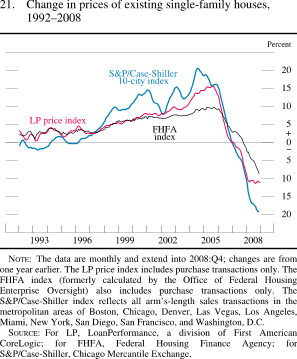
House prices fell sharply in the second half of 2008, with the latest 12-month readings in major nationwide indexes showing prices of existing homes down between 9 percent and 19 percent (figure 21). One such measure, the LoanPerformance repeat-sales price index, fell 11 percent over the 12 months ending in December and stood 19 percent below its peak in early 2006. Declines in home prices have been especially steep in Arizona, California, Florida, and Nevada. These states, which had experienced some of the largest increases in home prices earlier in the decade, have generally seen the largest increases in delinquency rates and foreclosure actions initiated by lenders.
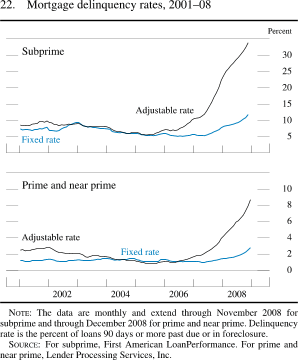
The drop in home prices is contributing to worsening payment problems among mortgage borrowers. Traditionally, some homeowners have coped with job loss and other life events by refinancing their homes and extracting equity or by selling the properties. However, the considerable declines in housing equity, along with tighter lending standards, mean that even prime loans are more difficult to refinance, and weak housing demand has made selling difficult. As a consequence, borrowers have increasingly fallen behind in their monthly obligations. Indeed, in November 2008, 25 percent of subprime mortgages were seriously delinquent (the latest available data).5 As of December 2008, 3-3/4 percent of prime mortgages were seriously delinquent--much lower than the level of serious delinquency for nonprime loans, but still almost twice the level of a year earlier (figure 22).
Foreclosures also have risen appreciably of late. Indeed, available data suggest that more than 2 million homes entered the foreclosure process in 2008, compared with foreclosure starts of 1-1/2 million in 2007 and 1 million or less in each of the preceding four years. As with delinquencies, declining house prices have been a key contributor to the rise in foreclosures. At the same time, rising foreclosures have exacerbated the decline in house prices by increasing the number of heavily discounted properties on the market and thus exerting downward pressure on prices of otherwise comparable occupied homes. Lenders and public policy makers have taken steps to limit the number of avoidable foreclosures by modifying mortgages and putting in place programs such as Hope for Homeowners, established by the Federal Housing Administration (FHA).
In an environment of generally weak housing demand, falling home prices, tighter lending standards, and rising foreclosures, total household mortgage debt appears to have posted an outright decline in 2008--the first in the history of the series, which extends back to the 1950s. In secondary mortgage markets, securitization of mortgages by Fannie Mae and Freddie Mac has fallen in recent months, and gross issuance of GSE-backed MBS has lately just outpaced maturing issues so that levels outstanding have only inched up since the summer. Issuance of Ginnie Mae securities backed by FHA loans has continued to be strong, but the non-agency MBS market remains closed. The FHA has offered an alternative source of mortgage financing for some nonprime and near-prime borrowers, and such lending has picked up lately; still, it has replaced only part of the reduction in credit from other sources, largely because of the FHA's relatively strict lending standards and higher costs.
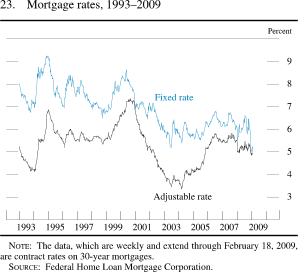
Interest rates on 30-year fixed-rate conforming mortgages have fallen about 100 basis points, on net, since the November 25 announcement of the Federal Reserve's program to purchase MBS issued by the housing GSEs and Ginnie Mae, and they currently stand at 5 percent (figure 23). However, interest rates for nonconforming jumbo fixed-rate loans have declined by less than those for conforming mortgages in recent months, which has caused the extraordinarily wide spread between the two rates to widen further.6 The high level of this spread reflects, in part, the absence of functioning securitization markets for jumbo mortgages as well as an increased aversion by banks to making potentially risky loans.
Consumer Spending and Household Finance
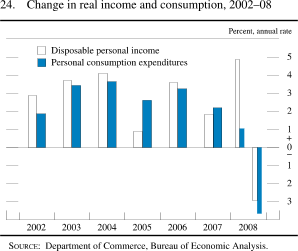
Consumer spending held up reasonably well in the first part of 2008. However, spending slackened noticeably toward the end of the second quarter despite the boost to household income from the tax rebates authorized by the Economic Stimulus Act of 2008, and consumer outlays entered the second half of the year on a downward trajectory. Against a backdrop of sizable job losses, decreases in household net worth, and difficulties in obtaining credit, real PCE declined at an annual rate of more than 3-1/2 percent in the second half of 2008 (figure 24).
The downshift in consumer spending reflected both a sharp pullback in purchases of goods and a marked deceleration in expenditures on services. Outlays for new light motor vehicles (cars, sport utility vehicles, and pickup trucks) were especially hard hit. Indeed, at an annual rate of just 10-1/4 million units, sales of light vehicles in the fourth quarter were nearly 4 million units below the already reduced pace during the first nine months of the year; they fell further in January 2009 despite relatively low gasoline prices and a substantial increase in sales incentives in recent months.
Real disposable personal income (DPI)--that is, after-tax income adjusted for inflation--rose just 1-1/4 percent in 2008. Some of the weakness in real DPI reflected softness in aggregate wage and salary income, which fell slightly in real terms. As noted earlier, hourly wages posted a solid increase in real terms last year, but the effect of this increase on aggregate wages and salaries was outweighed by the negative effects of the contraction in employment and the decrease in hours worked by those who retained jobs. Apart from transfer payments, most types of nonwage income performed poorly as well. Measured on a per capita basis, average real after-tax income was essentially unchanged last year, compared with an average increase of nearly 2 percent during the preceding five years.
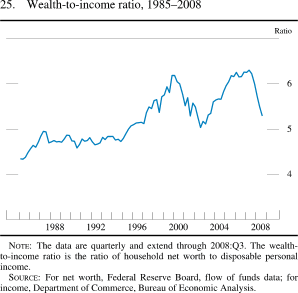
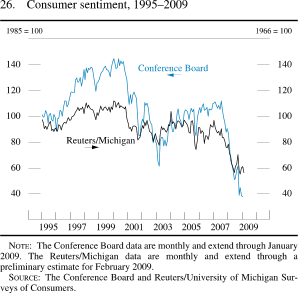
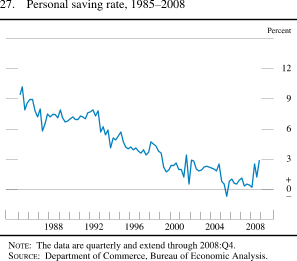
In addition to the weakness in income, consumer spending has been restrained in recent quarters by a sizable decrease in household net worth (figure 25). This source of restraint on spending likely reflects not only the most recent drops in equity and house prices but also the lagged effects of the appreciable decline in wealth during 2007 and the first half of 2008. The loss of wealth, along with heightened concerns about the prospects for jobs and income, helped push consumer sentiment to very low levels (figure 26). These factors also contributed to a noticeable upturn in the personal saving rate, which rose to nearly 3 percent in the fourth quarter of 2008 after fluctuating between 0 and 1 percent for most of the period since 2005 (figure 27).
Nonmortgage consumer debt outstanding appears to have fallen, on net, in the second half of 2008 after having increased at an annual rate of 4 percent in the first half. Part of the drop in borrowing was likely due to weaker demand for loans, but the available evidence also suggests that lenders tightened the supply significantly. Indeed, results from the Senior Loan Officer Opinion Survey released in October 2008 and January 2009 revealed that many banks tightened standards and terms for consumer loans, actions that included lowering credit limits on existing credit card accounts. Lenders also reportedly continued to tighten underwriting standards on non-government-guaranteed student loans, and some major providers of these loans exited the market.
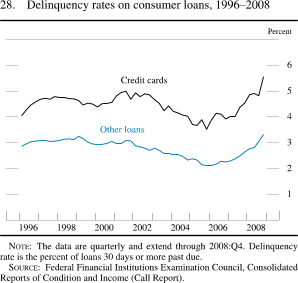
Part of the tightening of lending standards and terms no doubt reflects lenders' concerns about the credit quality of households. Indeed, the performance of consumer loans has continued to worsen in recent months, albeit less starkly than that of mortgages. Delinquency rates for most types of consumer lending--credit cards, auto loans, and nonrevolving loans--rose significantly, on net, over the course of 2008, and most such rates now stand at or above the levels seen during the 2001 recession (figure 28). Household bankruptcy rates also increased sharply in 2008.
The pullback in consumer credit also likely reflects, in part, the difficulties in the market for asset-backed securities. Until the first half of 2008, a substantial fraction of consumer credit had been funded with ABS, but since the third quarter, issuance of credit card, automobile, and student loan ABS has slowed to a trickle. As noted earlier, to facilitate renewed issuance of consumer and small business ABS and thus support economic activity, the Federal Reserve announced in November plans for the Term Asset-Backed Securities Loan Facility, which will begin operations in the coming weeks.7 Spreads on AAA-rated ABS rose through most of last year but have declined lately, reportedly in anticipation of the opening of the TALF.
Against this backdrop, interest rates on auto loans generally rose somewhat during the second half of 2008, and those on most other types of consumer loans were little changed, despite a substantial decrease in rates on comparable-maturity Treasury securities. Although some consumer interest rates appear to have fallen slightly in early 2009, their spreads to Treasury rates remain quite elevated.
The Business Sector
Fixed Investment
After having posted small gains in the first half of 2008, real business fixed investment edged down in the third quarter and fell sharply in the fourth quarter (figure 29). The retrenchment in investment reflected both a steep drop in outlays on equipment and software (E&S) and a sharp deceleration in spending on nonresidential construction after 2-1/2 years of robust gains. Investment demand appears to have been depressed by the downturn in sales, production, and profitability as well as by the reduced availability and higher cost of credit from securities markets, banks, and other lenders.
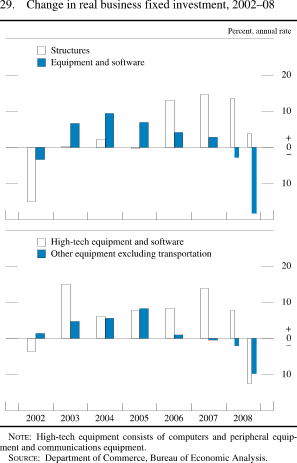
Real spending for E&S fell at annual rates of 7-1/2 percent in the third quarter and 28 percent in the fourth quarter. Business outlays on motor vehicles, which had fallen sharply in the first half of the year, continued to plunge in the second half. Outlays for other major components of E&S also recorded sizable declines. Real investment in information technology equipment--which had risen moderately in the first half of the year--fell at a 12-1/2 percent annual rate, on average, in the second half as business demand for computers, software, and communications equipment dropped appreciably. Real spending on equipment other than information technology and transportation, which had been moving essentially sideways since the end of 2005, held up through the third quarter. However, it fell at an annual rate of about 20 percent in the fourth quarter, and the slow pace of orders lately, along with the downbeat tone in recent surveys of business conditions, points to further declines in this broad category of spending in early 2009.
On net, real outlays for nonresidential construction posted a small increase in the second half of 2008. However, gains were concentrated in energy-related sectors--drilling and mining structures, petroleum refineries, and transmission and distribution facilities--and likely reflected the earlier run-up in the price of crude oil. Outside the energy-related sectors, spending turned down in the second half of last year as construction of office buildings softened and spending on nonoffice commercial buildings (a category that includes retail, wholesale, and some warehouse space) fell sharply. The decline was related to the rise in vacancy rates over the past few quarters, which was driven, in part, by the weakening in aggregate output and employment. In addition, recent reports from bank lending officers suggest that financing for new construction projects has become even more difficult to obtain.
Inventory Investment
One hallmark of the economic landscape over the past year has been the prompt response of producers to the slowing in final sales. For much of 2008, the production adjustments resulted in a rapid pace of inventory liquidation and were sufficient to prevent the emergence of widespread stock imbalances (figure 30). In the fourth quarter, however, the precipitous drop in final demand left many firms holding inventories in excess of desired levels--a view expressed by respondents to a variety of business surveys at the turn of the year. Accordingly, available data suggest that producers continued to pare back output in January 2009.
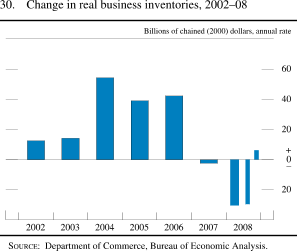
The inventory overhang at year-end was especially acute in the motor vehicle sector. Although automakers slashed production during the fourth quarter, the collapse in sales last autumn pushed up dealers' stocks, and the days' supply of cars and light trucks soared to nearly 100 days--well above industry norms. In response, motor vehicle manufacturers instituted even larger cuts in production in early 2009. These cuts should help ease the pressure on dealers' stocks, though further progress will require continued restraint on production, a meaningful pickup in sales, or both.
Corporate Profits and Business Finance
Operating earnings per share for S&P 500 firms fell an estimated 17 percent in 2008. Losses were especially pronounced for financial firms. In the nonfinancial sector, earnings at firms other than oil and gas companies generally slowed over the course of 2008 and declined outright in the fourth quarter. In addition, in light of the deterioration in the economy, analysts significantly marked down their projections for earnings in 2009.
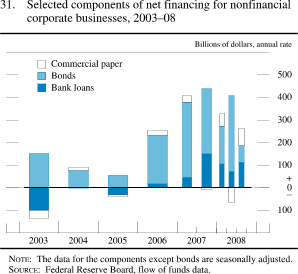
Borrowing by domestic nonfinancial businesses--primarily through the corporate bond market, the commercial paper market, and bank loans--slowed markedly in the second half of 2008 (figure 31). The deceleration reflected not only a reduced desire of businesses to borrow and invest in response to the worsening economic outlook but also a reduced willingness of potential lenders to provide funding for risky projects. In the corporate bond market, issuance of investment-grade securities by nonfinancial firms was solid throughout the year; in contrast, speculative-grade issuance has been scant in recent months. After moving up in the first half of the year, the cost of longer-term financing rose further as interest rates on both investment- and speculative-grade corporate bonds soared in the fall. While corporate bond rates were climbing, Treasury yields dropped, pushing interest rate spreads on corporate bonds well above previous record highs. The increases in spreads appeared to derive from both the anticipation of an increase in defaults and a further reduction in investors' willingness to take risk. In the commercial paper market, short-term borrowing by highly rated nonfinancial firms has increased since the summer; the rise reflects importantly the Federal Reserve programs supporting issuance by stronger firms. Indeed, rates on highly rated paper with maturities of less than 30 days have averaged around 20 basis points since late November, compared with nearly 200 basis points in September and October. Rates on lower-grade nonfinancial paper have also decreased in recent months, but their spreads to highly rated paper remain elevated by historical standards.
Bank lending to businesses expanded in September and October as firms reportedly drew on existing lines of credit. More recently, however, loans to commercial and industrial borrowers have registered significant declines. In addition, the growth of commercial real estate loans--which are often used to finance construction and land development--slowed substantially in the second half of the year. Given the deteriorating economic outlook, tighter credit standards, and businesses' decisions to scale back new investment, both C&I and CRE lending seem likely to fall further in the first part of 2009 (figure 32).
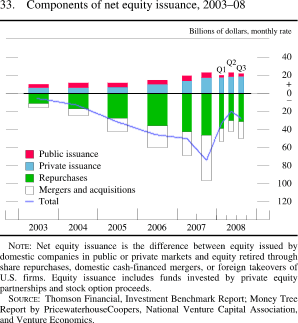
In the equity market, initial offerings by nonfinancial corporations were very sparse through the second half of 2008, and seasoned offerings (excluding firms in the energy sector) were also weak (figure 33). Equity retirements--which often occur as a result of share repurchases that are associated with cash-financed mergers--continued to outpace the combined amount of private and public issuance, a development due, in part, to the completion of a few large mergers. However, share repurchases are estimated to have moderated a bit in recent months, and announcements of future cash-financed mergers have slowed significantly, likely because of the weaker economic outlook and tighter lending conditions.
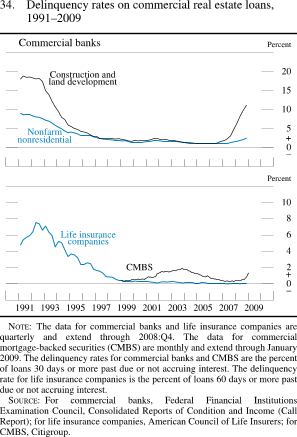
The credit quality of nonfinancial firms deteriorated in the second half of the year. The aggregate ratio of debt to assets climbed further, and the aggregate ratio of liquid assets to total assets declined notably. Ratings downgrades on nonfinancial corporate bonds picked up and outpaced upgrades, and the share of corporate bonds rated B3 or below by Moody's increased to about 6-1/2 percent. Delinquency rates on C&I loans increased noticeably in the fourth quarter, and delinquency rates on CRE loans rose further, mainly because of continued rapid weakening in the performance of residential and commercial construction loans (figure 34).
The Government Sector
Federal Government
The deficit in the federal unified budget is in the midst of a massive widening. Mainly reflecting the deceleration in economic activity and the provisions of the Economic Stimulus Act of 2008, the deficit rose to $455 billion in fiscal year 2008, nearly $300 billion higher than in fiscal 2007 and equal to more than 3 percent of nominal GDP. So far in fiscal 2009, the deficit has increased substantially further, mostly because of outlays under the Troubled Asset Relief Program and the effects of the weak economy on revenues and spending.8 In January, the Congressional Budget Office estimated that the deficit for fiscal 2009 as a whole would total more than $1 trillion under the spending and taxation policies in place at that time, a figure that excludes the budgetary impact of the American Recovery and Reinvestment Act of 2009.
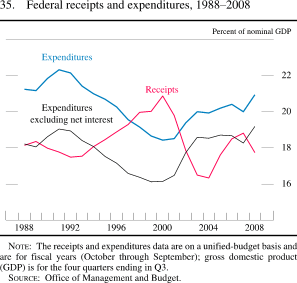
Federal receipts fell nearly 2 percent in nominal terms in fiscal 2008 and stood at 17-3/4 percent of nominal GDP; they dropped further during the first four months of fiscal 2009 (figure 35). The decline has been most pronounced in corporate receipts, which have fallen at double-digit rates as corporate profits have dropped and as firms have presumably adjusted payments to take advantage of the bonus depreciation provisions contained in the Economic Stimulus Act. Excluding the rebates provided to most households under the act, individual income tax receipts rose moderately in fiscal 2008. However, so far in fiscal 2009, individual receipts have been running below yearearlier levels, likely because of the weakness in nominal personal income and reduced capital gains realizations.
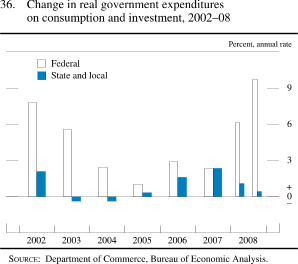
Excluding financial transactions, nominal federal outlays increased 8 percent in fiscal 2008 after having risen just 3 percent in fiscal 2007. Defense outlays rose 12 percent in fiscal 2008 as the rapid run-up in budget authority over the past three years continued to bolster spending; increases in defense funding in recent years have been substantial not only for operations in Iraq and Afghanistan but also for activities not directly related to those conflicts. Federal spending also rose sharply in fiscal 2008 for programs that provide support to lower-income households. So far in fiscal 2009, federal outlays for defense and low-income support programs have continued to rise rapidly. Also, spending for Medicare has picked up lately, and outlays for Social Security have been lifted by the large cost-of-living adjustment that took place in January. As for the part of federal spending that is a direct component of GDP, real federal expenditures for consumption and gross investment rose at an annual rate of 10 percent, on average, in the second half of calendar year 2008, mostly because of the sizable increase in defense spending (figure 36).
State and Local Government
Aggregate real expenditures on consumption and gross investment by state and local governments were little changed, on net, in the second half of 2008 after posting a small increase in the first half. In part reflecting the mounting pressures on the sector's budgets, state and local employment has been about flat since mid-2008, while real construction spending has essentially moved sideways.
The financial positions of most states--with the exceptions of Arizona, California, Michigan, and a few others--were fairly solid at the end of fiscal year 2008.9 However, so far in fiscal 2009, revenues have been running significantly below expected levels because of the softness in personal and corporate incomes and the weakness in retail sales. States' initial plans to address the widening budget gaps have included cuts in spending on education and other programs, hiring freezes and furloughs, and some tapping of rainy day funds; in coming quarters, however, the dominant influence on state budgets will be the infusion of grants-in-aid under the 2009 federal stimulus package, which will help cushion the effects of the economic downturn on states' budgets. At the local level, property tax receipts continued to be propped up in 2008 by the lagged effects of the dramatic increases in house prices over the first half of the decade.10 Nevertheless, the sharp fall in house prices over the past two years is likely to put substantial downward pressure on local revenues before long. Moreover, many state and local governments will need to set aside money in coming years to rebuild their employee pension funds after the losses experienced in 2008 and to fund their ongoing obligations to provide health care to their retired employees.
The External Sector
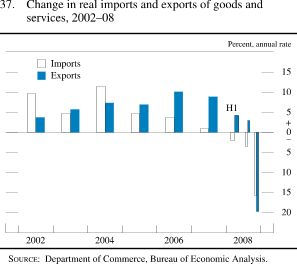
In contrast to the first half of 2008--when robust exports provided some offset to the softness in domestic demand--the external sector provided little support to economic activity in the second half of the year. After decelerating in the third quarter, real exports declined sharply in the fourth quarter, as economic activity abroad contracted. Real imports, which had been declining earlier in 2008, also dropped considerably in the fourth quarter, dragged down by deteriorating U.S. demand (figure 37). The declines in trade flows in late 2008 were widespread across major types of products and U.S. trading partners. In addition, exports were depressed by production disruptions at Boeing.
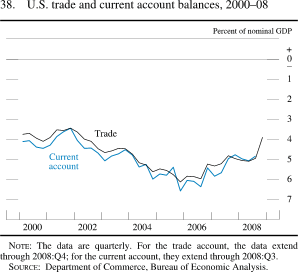
The U.S. trade deficit narrowed considerably at the end of 2008, which largely reflected a sharp decline in the price of imported oil. The trade deficit was $555 billion at an annual rate in the fourth quarter of 2008, or about 4 percent of nominal GDP, compared with a deficit of 5 percent of nominal GDP a year earlier (figure 38).
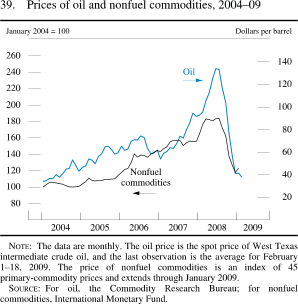
The price of crude oil in world markets was extremely volatile in 2008. After ending 2007 at about $95 per barrel, the spot price of West Texas intermediate (WTI) crude oil surged to more than $145 by mid-July amid both surprisingly robust oil demand, especially from emerging market economies, and continued restraint in near-term supply (figure 39). Since mid-July, the financial market turmoil and the resulting sharp downturn in global economic activity have dragged down oil demand. Despite attempts by OPEC to rein in production, the rapid drop in demand and concerns about future prospects for the global economy led to a collapse in oil prices. The spot price of WTI fell about 75 percent from its peak to near $40 per barrel in January of this year. Far-dated futures prices for crude oil have fallen somewhat less, which likely reflects the view that OPEC actions will eventually reduce supply and that global oil demand will rebound in the medium term.
Import prices rose rapidly in the first half of 2008, but the increase was reversed in the second half. That pattern primarily reflected the sharp swing in oil prices, but it was also influenced by a marked slowing in nonoil import price inflation from its rapid pace in the first half of the year. Even excluding oil, prices of imported goods declined in the fourth quarter of 2008, driven by both the sharp fall in non-oil commodity prices and the appreciation of the dollar that occurred in the latter half of the year.
National Saving
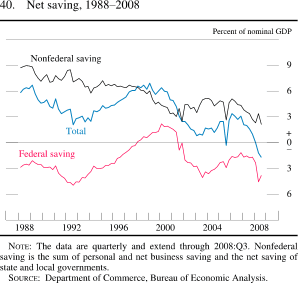
Total net national saving--that is, the saving of households, businesses, and governments excluding depreciation charges--fell further in 2008 (figure 40). After having ticked up to 3 percent of nominal GDP in 2006, net national saving dropped steadily over the subsequent two years as the federal budget deficit widened, the fiscal positions of state and local governments deteriorated, and private saving remained low; in the third quarter of 2008, net national saving stood at negative 1-3/4 percent of GDP. National saving will likely remain low this year in light of the weak economy and the recently enacted federal fiscal stimulus package. Nonetheless, if not boosted over the longer run, persistent low levels of national saving will likely be associated with both low rates of capital formation and heavy borrowing from abroad, which would limit the rise in the standard of living of U.S. residents over time and hamper the ability of the nation to meet the retirement needs of an aging population.
Prices and Labor Productivity
Prices
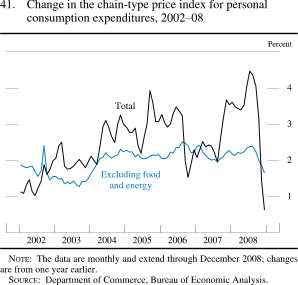
Although inflation pressures were elevated during the first half of 2008 and into the summer, they diminished appreciably toward year-end as prices of energy and other commodities dropped and the degree of slack in the economy increased. The chain-type price index for total personal consumption expenditures fell at an annual rate of 5-1/2 percent in the fourth quarter after rising rapidly over the first three quarters of the year. The core PCE price index--which excludes food and energy items--rose at an annual rate of just 1/2 percent in the fourth quarter after increases of 2-1/4 percent, on average, over the first three quarters of the year. Over 2008 as a whole, core PCE prices increased 1-3/4 percent (figure 41). Data for PCE prices in January 2009 are not yet available, but information from the consumer price index (CPI) and other sources suggests that both the total and core PCE price indexes posted modest increases in that month.
Since peaking in July, consumer energy prices have fallen dramatically, with most of the decline coming during the last three months of 2008. Largely reflecting the drop in crude oil prices, the price of gasoline fell from around $4 per gallon, on average, in July to less than $2 per gallon in December; in mid-February, it was in the neighborhood of $2 per gallon. Prices of natural gas, which typically move roughly in line with crude oil prices over periods of several months, also fell sharply in the second half of 2008 after a substantial run-up in the first half of the year. Consumer prices for electricity continued to move up through the end of the year--likely because of higher prices earlier in the year for fossil fuel inputs to electricity generation--though increases appear to have slowed in early 2009.
In contrast, consumer food prices continued to rise rapidly into the autumn. Increases were substantial both for food consumed at home and for purchased meals and beverages, which typically are influenced more by labor and other business costs than by farm prices. Since November, however, increases in consumer food prices have been quite modest. Farm prices, which had soared between 2006 and mid-2008 as a consequence of strong world demand and the increased use of corn for the production of ethanol, fell sharply in the second half of last year as prospects for domestic and foreign demand for food weakened and the demand for ethanol eased. Typically, changes in farm prices start to show through fairly quickly to consumer food prices, and the small increases in the CPI for food in the past couple of months suggest that a noticeable moderation in consumer food price inflation is under way.
The slowdown in core inflation in late 2008 was widespread, although it was particularly steep for motor vehicles, apparel, and other consumer goods that were heavily discounted by retailers in an environment of weak demand and excess inventories. In addition, the cost pressures that seemed to be boosting core inflation earlier in the year ebbed as pass-throughs of the previous large increases in the prices of energy and materials ran their course and the effects of recent declines in these prices started to show through to consumer prices. The strengthening in the exchange value of the dollar and the deceleration of import prices also helped ease the upward pressure on core inflation.
Survey-based measures of near-term inflation expectations have receded as actual inflation has come down, while indicators of longer-term inflation expectations have been steadier. According to the Reuters/University of Michigan Surveys of Consumers, median one-year inflation expectations, which had moved above 5 percent last spring and early summer, fell throughout the second half of last year; since December, they have fluctuated around 2 percent. As for longer-term inflation expectations, the Reuters/University of Michigan survey measure of median 5- to 10-year inflation expectations was about 3 percent in January and early February of this year, similar to the readings during 2007 and the early part of 2008.
Productivity and Unit Labor Costs
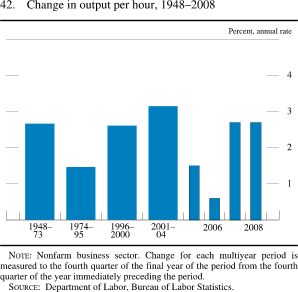
Labor productivity has held up surprisingly well in the past year. Although productivity growth has often stalled during previous recessions, output per hour in the nonfarm business sector rose 2-3/4 percent over the course of 2008, the same rate as in 2007 (figure 42). The continued rise in productivity during the second half of last year, at a time when output was contracting, likely reflects the aggressive downsizing undertaken by firms in response to their worsening sales prospects. Moreover, although estimates of the underlying pace of productivity growth are quite uncertain, the buoyancy of productivity in recent quarters suggests that the fundamental forces supporting a solid underlying trend--for example, the rapid pace of technological change and the ongoing efforts by firms to use information technology to improve the efficiency of their operations--remain in place.
Reflecting the solid gain in labor productivity, along with the subdued increase in nominal hourly compensation noted earlier, unit labor costs in the nonfarm business sector rose just 3/4 percent in 2008. The increase in unit labor costs was about the same as that recorded in 2007.
Monetary Policy Expectations and Treasury Rates
The current target range for the federal funds rate, 0 to 1/4 percent, is substantially below the level that investors expected at the end of June 2008; policy expectations were steadily revised downward over the second half of the year as the financial and economic outlook worsened. Toward the end of the year, readings on interest rate expectations from money market futures and options were complicated by persistent trading of federal funds below the target rate, which resulted from the large increase in reserve balances accompanying the expansion of the Federal Reserve's liquidity programs. Nevertheless, investors clearly anticipated that the federal funds rate would remain low for quite some time amid increasing concerns about the health of financial institutions, weakness in the real economy, and a moderation in inflation pressures. Futures quotes currently suggest that investors expect the federal funds rate to remain around its current level throughout the first half of this year and then to rise gradually through the end of 2010. However, uncertainty about the size of term premiums and potential distortions created by the zero lower bound for the federal funds rate make it difficult to obtain from futures prices a definitive reading on the policy expectations of market participants. Options prices suggested that investor uncertainty about the future path for policy was increasing considerably through October, as strains in financial markets intensified, but these measures of uncertainty have subsequently trended downward.
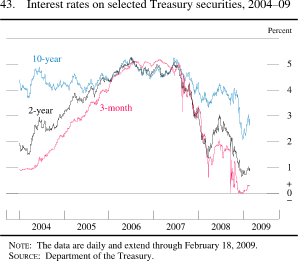
As the economic outlook worsened during the second half of the year and inflation pressures ebbed, yields on longer-maturity Treasury securities declined substantially (figure 43). In addition, the generally negative market sentiment and speculation that the Federal Reserve might begin purchasing large quantities of longer-maturity Treasury securities contributed at times to downward pressure on Treasury yields. Offsetting these factors to some degree were market expectations that the Treasury's issuance of long-term debt, which rose notably over the course of 2008, would pick up further in 2009. On net, yields on 2- and 10-year notes fell about 200 and 140 basis points, respectively, during the second half of 2008.
In contrast to yields on their nominal counterparts, yields on Treasury inflation-protected securities (TIPS) rose over the second half of 2008, which resulted in a noticeable reduction in measured inflation compensation--the difference between comparable-maturity nominal and TIPS yields. Some of this reduction was reversed in the early part of 2009. Inferences about inflation expectations based on TIPS yields have been difficult to make recently because these yields appear to have been affected to a degree by movements in liquidity premiums and because special factors have buffeted yields on nominal Treasury issues.
Federal Borrowing
Federal debt soared in the second half of 2008. The more than $1 trillion of Treasury borrowing since the summer reflects importantly the need to finance the Treasury's purchases of agency MBS and equity; the TARP, under which the Treasury has purchased preferred shares in a number of financial institutions; and the Supplementary Financing Program, under which the Treasury has increased deposits at the Federal Reserve to help fund the expansion of the Federal Reserve's balance sheet. The ratio of federal debt held by the public to nominal GDP surged to almost 45 percent at the end of calendar year 2008 and seems certain to increase again in the first part of 2009, as borrowing is expected to remain strong with the weak economy and budgetary initiatives.
Despite the heavy issuance of Treasury securities in the second half of the year, the rapid growth of federally guaranteed debt issued by banking institutions under the Temporary Liquidity Guarantee Program, and continued issuance of GSE securities, demand at most Treasury auctions was solid, as investors sought the safety of Treasury securities. Demand for Treasury bills was extremely strong, and yields in secondary markets sometimes fell close to zero (and even below zero at times), even as the supply of bills increased markedly. Foreign custody holdings of Treasury securities at the Federal Reserve Bank of New York grew nearly 40 percent over 2008, although the proportion of nominal coupon securities purchased at auctions by foreign investors generally remained in the 10 percent to 30 percent range observed over the past several years.
State and Local Government Borrowing
On net, borrowing by state and local governments in the market for municipal securities was subdued in the second half of 2008. The issuance of short-term municipal debt was robust, boosted in part by the need to fund operating expenditures at a time of weak revenues. However, issuance of long-term debt, which is generally used to fund capital spending projects or to refund existing long-term debt, slowed significantly. Interest rates on long-term debt climbed sharply across the maturity spectrum in the second half of 2008 in the face of considerable strain on the budgets of many state and local governments and sharp deteriorations in market functioning. More recently, however, municipal bond rates have dropped markedly, in part because market participants appeared to view the federal stimulus package as likely to improve the financial condition of state and local governments.
Monetary Aggregates
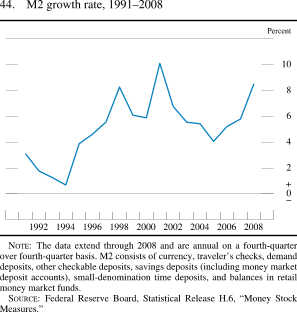
The M2 monetary aggregate increased at a 10 percent annual rate during the second half of 2008 and 8-1/2 percent for the year as a whole (figure 44).11 The rapid growth reflected in part a marked decrease in some market interest rates relative to the rates offered on M2 assets, as well as increased demand for safe and liquid assets during the financial turmoil. During the second half of the year, the significant slowdown in the growth of retail money market mutual funds was offset by a rapid increase in small time deposits, as banks bid aggressively for these deposits to buttress their funding. The currency component of the money stock also increased briskly, an indication of solid demand for U.S. banknotes from both foreign and domestic sources. Flows into demand deposits were significant after the introduction of the Temporary Liquidity Guarantee Program, which apparently drew funds out of other money market instruments.
The monetary base--essentially the sum of currency in the hands of the public and bank reserves--has increased rapidly in recent months, primarily owing to heavy use of the Federal Reserve's liquidity programs. Credit extended through these programs caused the balance sheet of the Federal Reserve to expand considerably over the course of 2008, and this growth was financed largely by the creation of reserve balances. The increase in reserve balances almost entirely represented an increase in excess reserves rather than an increase in required reserves. In early 2009, the size of the balance sheet has decreased somewhat, which reflects a runoff in credit extended through the Commercial Paper Funding Facility and a decrease in draws on liquidity swap lines with foreign central banks.
International Developments
International Financial Markets
Although foreign banks continued to report losses over the summer and funding conditions remained strained, global financial markets were relatively calm in July and August of 2008. This situation changed abruptly in September, as global interbank and other funding markets seized up and lending came to a near standstill. These developments were followed by the collapse of several prominent foreign financial institutions. In late September, the banks Bradford and Bingley, Fortis, and Dexia were partially or fully nationalized, and Hypo Real Estate Holding AG received a large capital injection from the German government.
The deepening of the crisis led many foreign governments to announce unprecedented measures to restore credit market functioning, including large-scale capital injections into the banking system, expansions of deposit insurance programs, and guarantees of some forms of bank debt. Most major central banks cut policy rates sharply as the financial crisis led to a dramatic deterioration in the outlook for economic activity and inflation; in October, coordinated policy rate cuts were made by the Federal Reserve and five other central banks. To address global dollar funding pressures, the Federal Reserve greatly expanded its program of liquidity swaps with foreign central banks by increasing the dollar amounts extended as well as the number of countries with which it has swap agreements. (The central banks with swap arrangements are discussed in the appendix.) These concerted global measures seem to have soothed conditions and had restored some measure of stability to markets by the end of the year, although credit markets abroad are still impaired.
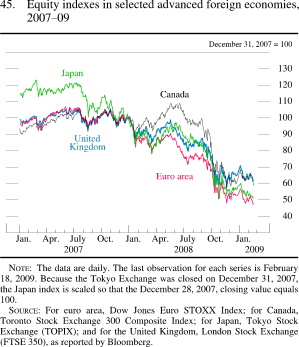
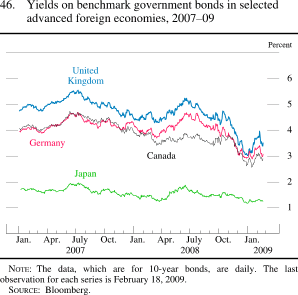
Stock markets in the advanced foreign economies were nearly flat over July and August of 2008 but fell sharply beginning in late September; market volatility rose to record levels with the deepening of the financial crisis. On net, broad equity price indexes in Europe, Japan, and Canada fell 20 percent to 40 percent over the second half of last year and have continued to decline this year (figure 45). Long-term sovereign bond yields fell sharply in Europe and Canada in the latter part of 2008, which reflected both the easing of monetary policy and diminished growth prospects, but have risen somewhat, on balance, in early 2009 (figure 46). In contrast, yields on inflation-protected long-term securities rose in many countries, and inflation compensation (the difference between yields on nominal securities and those on inflation-protected securities) fell sharply. As in the United States, measures of inflation compensation were quite volatile, however, as the liquidity of inflation-protected securities fell markedly.
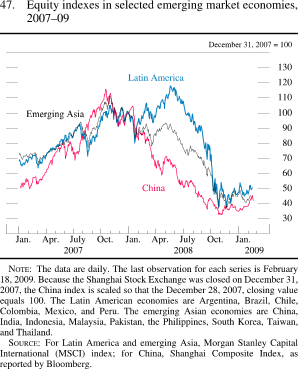
Although in early 2008 the emerging market economies looked as if they might escape the most serious consequences of the financial crisis, the intensification of financial strains in September 2008 led to sharp and sudden capital outflows from many emerging markets as investors in the advanced economies sought to repatriate funds. Downdrafts in financial markets were reinforced by concerns over the effects of declining exports to the advanced economies and, for commodity exporters, plummeting commodity prices. Most stock markets in the emerging economies fell 20 percent to 40 percent, on net, over the second half of the year, and risk spreads on emerging market debt rose sharply (figure 47).
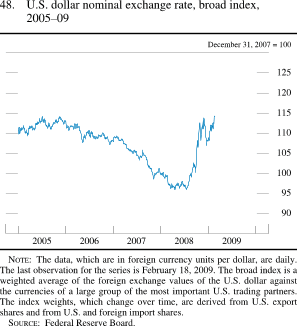
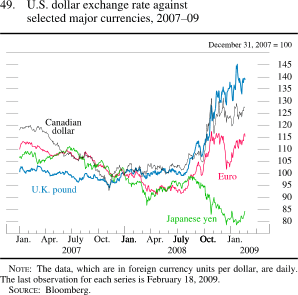
The Federal Reserve's broadest measure of the nominal trade-weighted foreign exchange value of the dollar rose about 12 percent, on net, over the second half of 2008 (figure 48). Much of this rise reflected gains against major foreign currencies. The dollar appreciated 13 percent against the euro, 20 percent against the Canadian dollar, and 36 percent against sterling (figure 49). The dollar's strength was attributable to several factors, including the realization by many investors that foreign growth would slow much more sharply than had been earlier anticipated as well as an increase in demand for the relative safety of U.S. assets such as Treasury securities. In contrast to its strength against other major currencies, the dollar depreciated 14 percent against the yen, as market volatility led many Japanese investors to sell foreign assets.
The dollar also rose against the currencies of most emerging market economies, including appreciation of more than 30 percent against both the Mexican peso and the Brazilian real. The dollar appreciated much less against most emerging Asian currencies, although it did rise more than 20 percent against the Korean won. In response to these pressures, many central banks in both Latin America and Asia intervened in support of their currencies.
The Financial Account
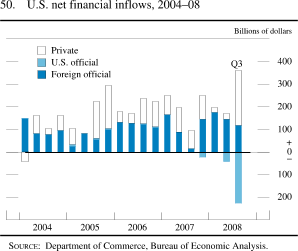
Although the current account deficit is estimated to have narrowed in 2008, it remains sizable. Turbulence in global financial markets has noticeably changed the composition of the associated financial flows. Before the turmoil, financial inflows were primarily in the form of net purchases of U.S. securities by foreign private investors and somewhat smaller net purchases by foreign official institutions. Since late 2007, however, foreign private net purchases of U.S. securities have dropped sharply, leaving foreign official inflows to play a much larger role (figure 50). Furthermore, whereas before the turmoil private foreign investors purchased large sums of U.S. assets issued by private entities, since then foreign investments--both official and private--have been dominated by a "flight to safety to U.S. Treasury securities. Finally, in the third quarter of 2008, reductions in holdings of foreign assets by private U.S. residents played an unusual role, which added significantly to net private inflows.
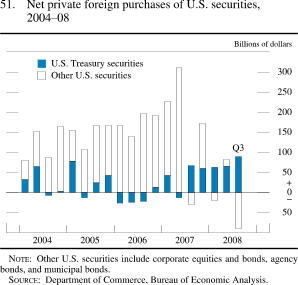
Overall, inflows from foreign private acquisitions of U.S. securities in 2008 were just one-fifth of the flows obtained in the previous two years, on average. Although purchases of U.S. Treasury securities rose considerably, there were unprecedented net sales in other U.S. securities in 2008 (figure 51). Foreign demand was particularly weak for U.S. agency and corporate bonds, with the weakness especially pronounced in the second half of the year.
Foreign official net purchases of U.S. assets remained relatively steady in 2008, at a pace slightly above that of 2007. However, the composition of official net purchases in the third and fourth quarters moved sharply away from U.S. agency securities and was concentrated almost exclusively in U.S. Treasury securities. Foreign official acquisitions continued to be dominated by Asian institutions in 2008.
Prior to the turmoil, U.S. investors' net purchases of foreign securities typically generated a financial outflow. These purchases slowed following the turmoil and more recently have turned to sizable net sales--generating a financial inflow--as U.S. investors have pulled out of foreign investments. In addition, U.S. residents considerably reduced their deposits in foreign banks in 2008.
The turmoil also led to unusual flows from the banking sector and from official transactions in the form of the Federal Reserve's liquidity swap arrangements with foreign central banks. Net flows reported by banking offices in the United States are typically small. Since the onset of the turmoil through mid-2008, however, banks have generated unusually large outflows, in part reflecting a response to heightened demand resulting from interbank funding pressures in European markets. As central banks acted to address these concerns with the expansion of the swap arrangements in September 2008, the private banking outflows slowed to a halt. Foreign central banks eased dollar pressures abroad by lending to their domestic banks the dollar liquidity acquired from the Federal Reserve. Further drawings on the swap lines in October and December contributed to a strong reversal of banking flows (back toward the United States, on net) in the fourth quarter.
Advanced Foreign Economies
Economic performance in the major advanced foreign economies weakened sharply in the second half of 2008, as global financial market turbulence, shrinking world trade, and collapsing business and consumer confidence weighed on activity. Across the advanced foreign economies, credit conditions and lending standards tightened considerably, industrial production declined, and retail sales slowed. Housing markets weakened everywhere and performed particularly poorly in countries that earlier had experienced housing booms, such as Ireland, Spain, and the United Kingdom. By the third quarter of last year, both Japan and the euro area had entered recessions, and output fell sharply in all the major advanced foreign economies in the fourth quarter, with most countries experiencing especially severe declines in exports and private investment.
After surging in response to accelerating commodity prices in the first half of last year, headline rates of inflation fell noticeably as a result of collapsing commodity prices and worsening economic conditions. The 12-month change in consumer prices peaked in the third quarter of 2008 for all the major economies, and the peak values ranged from a high of 5-1/4 percent in the United Kingdom to 2-1/4 percent in Japan. The most recent figures are substantially lower and range from 3 percent in the United Kingdom to below 1 percent in Japan (figure 52). Excluding food and energy prices, the swings in consumer price inflation have been more subdued. After moving up somewhat during most of 2008, core inflation is now declining in most advanced foreign economies.
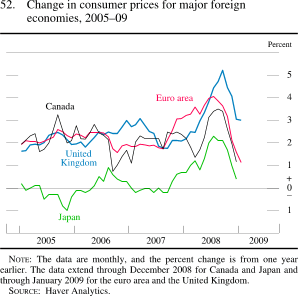
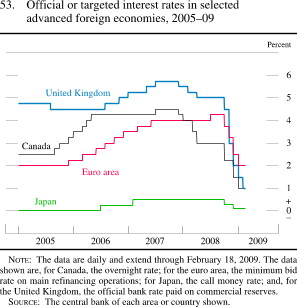
Official monetary policy rates have been lowered significantly since the beginning of 2008 in response to severe financial market turbulence, decelerating economic activity, and waning inflation. After some easing early last year by the Bank of England and the Bank of Canada, rapidly rising food and energy costs led these central banks to pause, and, in the case of the European Central Bank (ECB), raise rates in the summer. However, in the fall, as financial conditions deteriorated and commodity prices fell, policymakers in the major industrial economies cut rates sharply, including a coordinated move in October. In total, the Bank of England has lowered its policy rate from 5-1/2 percent in January of 2008 to 1 percent. The Bank of Canada and the ECB have also dropped rates to 1 percent and 2 percent, respectively. In Japan, interest rates were lowered to near zero in December (figure 53). In addition to substantial reductions in policy rates, central banks in the major advanced economies have taken a number of extraordinary measures to improve liquidity in financial markets, including the large-scale provision of term funding in local currency and dollar markets and the significant expansion of allowable collateral for central bank funding. Some foreign central banks are turning to or contemplating other measures to support activity, such as purchases of private-sector assets. Governments in the major industrial economies have also announced fiscal packages to bolster activity.
Emerging Market Economies
Economic performance weakened dramatically in emerging market countries in the second half of 2008. In the first half of the year, growth in many emerging market economies was relatively robust, and as food and energy prices soared, policymakers focused on containing inflationary pressure. However, in the second half, weaker demand from the advanced economies weighed on the export sectors of these countries, global financial turmoil led to tighter credit conditions, and in some cases, plunging commodity prices contributed to economic difficulties. By the end of the year, output in emerging market economies was dropping sharply, and inflationary pressures were moderating. These developments prompted policymakers in many countries to shift their focus to more stimulative monetary and fiscal policies to mitigate the effects of the economic downturn.
In China, the pace of activity slowed substantially in 2008, and concerns regarding high inflation and an overheating economy receded and gave way to efforts to bolster activity. Since September, Chinese authorities have lowered benchmark lending and deposit rates as well as bank reserve requirements several times. In November, a large fiscal stimulus plan that focused on infrastructure investment was announced, and Chinese authorities also enacted other policies designed to support the export sector, the real estate market, and small and medium-sized enterprises. After appreciating significantly in the first half of the year, the exchange value of the renminbi vis-à-vis the dollar was relatively stable in the second half of 2008.
Elsewhere in emerging Asia, the downturn in activity has been dramatic. Hong Kong, Singapore, South Korea, and Taiwan all posted substantial contractions in real GDP at the end of last year. Demand for these countries' goods from the advanced economies and China plunged in the second half of 2008, and authorities across emerging Asia have introduced more stimulative monetary and fiscal policies to bolster their economies.
In Mexico, growth was anemic in the first half of last year, but it improved in the third quarter, largely because of strong activity in the agricultural and service sectors. However, output is estimated to have declined sharply in the fourth quarter, as weakness in the U.S. manufacturing sector and financial stress have begun to weigh on the Mexican economy. In Brazil, economic activity remained firm through much of the year, but indicators suggest that output fell sharply in the fourth quarter.
Russia's economy and financial system experienced considerable stress over the second half of the year because of the steep drop in oil and other commodity prices, the turmoil in global financial markets, and geopolitical tensions resulting from the conflict with Georgia. Russian international reserves fell substantially, largely because of interventions to support the currency and the financial and corporate sectors more broadly. Several countries in emerging Europe also came under significant financial pressures in the fourth quarter of 2008, which reflected the aftermath of a period of very high rates of credit expansion as well as large current account deficits and external financing needs. Hungary, Latvia, Serbia, and Ukraine received official assistance from the International Monetary Fund.
Footnotes
2. Typically, the relative cost is measured by comparing the Libor rate with the rate on comparable-maturity overnight index swaps. Return to text 3. The bankruptcy of Lehman Brothers and the conservatorship of Fannie Mae and Freddie Mac constituted credit events of unprecedented scale for the CDS market. Nevertheless, settlement of the outstanding CDS contracts on these entities proceeded smoothly over the subsequent weeks, apparently due in part to the increased margins demanded by holders of CDS protection in the period leading up to early September. Return to text 4. Under legislation enacted in June 2008, the Emergency Unemployment Compensation (EUC) program began to provide an additional 13 weeks of benefits to workers who exhaust their regular benefits (typically 26 weeks). In November, the program was expanded to provide additional benefits to workers who exhaust the previously available 13 weeks of EUC benefits (an additional 7 weeks for all eligible individuals and a further 13 weeks for individuals in states with high unemployment rates--defined as a state unemployment rate of 6 percent or above). This expansion, as well as the original EUC program, was scheduled to expire in March 2009, but the American Recovery and Reinvestment Act of 2009 extended it through December 2009; the act also increased payments to recipients of unemployment compensation by $25 per week. Return to text 5. A mortgage is defined as seriously delinquent if the borrower is 90 days or more behind in payments or the property is in foreclosure. Return to text 6. Conforming mortgages are those eligible for purchase by Fannie Mae and Freddie Mac; they must be equivalent in risk to a prime mortgage with an 80 percent loan-to-value ratio, and they cannot exceed the conforming loan limit. The conforming loan limit for a first mortgage on a single-family home in the contiguous United States is currently equal to the greater of $417,000 or 115 percent of an area's median house price; it cannot exceed $625,500. Jumbo mortgages are those that exceed the maximum size of a conforming loan; they are typically extended to borrowers with relatively strong credit histories. Return to text 7. A description of the TALF is in the appendix. Return to text 8. In the Monthly Treasury Statements, equity purchases under the TARP and the GSE conservatorship are treated on a cash-flow basis, which means that the outlays are recorded as they occur; a flow of receipts will be recorded in future years to reflect any dividends on the shares of equity and the proceeds from the eventual sale of the shares. In contrast, the Congressional Budget Office (CBO) treats these transactions on an accrual basis and thus records outlays as the net present value cost of the equity purchases, rather than the entire amount that is disbursed; under the CBO approach, there is no offsetting flow of receipts in future years. According to the Treasury, the unified budget deficit for the first four months of fiscal 2009 totaled $569 billion; under the CBO approach, the year-to-date deficit would be $361 billion. Return to text 9. State government fiscal years end on June 30 in all but four states. Return to text 10. The lag between changes in house prices and changes in property tax revenue likely occurs because many localities are subject to state limits on the annual increases in total property tax payments and property value assessments. Thus, increases in market prices for houses may not be reflected in property tax bills until well after the fact. Return to text 11. M2 consists of (1) currency outside the U.S. Treasury, Federal Reserve Banks, and the vaults of depository institutions; (2) traveler's checks of nonbank issuers; (3) demand deposits at commercial banks (excluding those amounts held by depository institutions, the U.S. government, and foreign banks and official institutions) less cash items in the process of collection and Federal Reserve fl oat; (4) other checkable deposits (negotiable order of withdrawal, or NOW, accounts and automatic transfer service accounts at depository institutions, credit union share draft accounts, and demand deposits at thrift institutions); (5) savings deposits (including money market deposit accounts); (6) small-denomination time deposits (time deposits in amounts of less than $100,000) less individual retirement account (IRA) and Keogh balances at depository institutions; and (7) balances in retail money market mutual funds less IRA and Keogh balances at money market mutual funds. Return to text