- July 13, 2011: Part 1
- Part 2
- Part 3
- Part 4
- Abbreviations
- Printable Version (874 KB PDF)

Sections of Part 2
Part 2: Recent Financial and Economic Developments
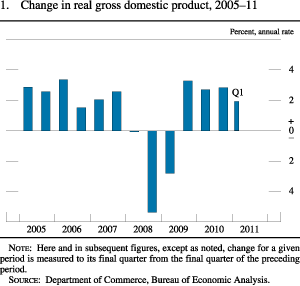
Monetary Policy Report submitted to the Congress on July 13, 2011, pursuant to section 2B of the Federal Reserve ActAfter increasing at a solid pace in the fourth quarter of 2010, economic activity expanded more slowly over the first half of 2011. In the first quarter of this year, real gross domestic product (GDP) increased at an annual rate of 1.9 percent (figure 1); preliminary indicators suggest that the pace of the recovery remained soft in the second quarter. Activity in the second quarter was held down by factors that are likely to be temporary, including the damping effect of higher food and energy prices on consumer spending as well as the supply chain disruptions stemming from the earthquake in Japan. But even after setting aside those effects, the pace of economic expansion in the second quarter appears to have been subdued.
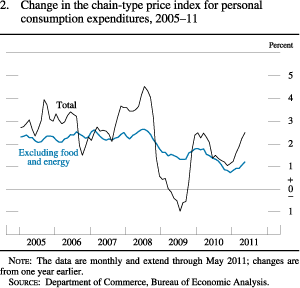
In the labor market, employment gains picked up noticeably at the beginning of 2011 but slowed markedly in May and June. The unemployment rate, which fell in late 2010, held close to 9 percent during the early months of the year but then edged up, reaching 9.2 percent in June. Furthermore, long-duration joblessness remained at near-record levels. Meanwhile, consumer price inflation moved up noticeably over the first half of the year, largely in response to rapid increases in the prices of some commodities and imported goods as well as the recent supply chain disruptions (figure 2). However, longer-term inflation expectations remained stable.
On balance, financial market conditions became somewhat more supportive of economic growth over the first half of 2011, reflecting in part continued monetary policy accommodation provided by the Federal Reserve. In the early part of the year, strong corporate profits and investors' perceptions that the economic recovery was firming supported a rise in equity prices and a narrowing of credit spreads. Since May, however, indications that the U.S. economic recovery was proceeding at a slower pace than previously anticipated, a perceived moderation in global growth, and heightened concerns about the persisting fiscal pressures in Europe weighed on investor sentiment and prompted a pullback from riskier financial assets. On net over the first half of the year, yields on Treasury securities and corporate debt and rates on fixed-rate residential mortgages declined, and equity prices rose significantly. Borrowing conditions for households and businesses eased somewhat further, although credit conditions continued to be tight for some borrowers.
Domestic Developments
Housing Activity and Finance
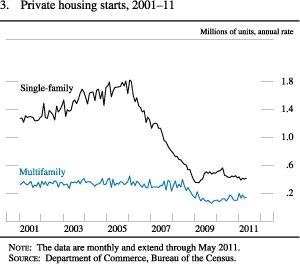
The housing market remained exceptionally weak in the first half of 2011. Housing demand continued to be restrained by households' concerns about the strength of the recovery for incomes and jobs as well as the potential for further declines in house prices; still-tight credit conditions for potential mortgage borrowers with less-than-pristine credit also appear to be damping demand. As a result, sales of single-family homes showed no signs of sustained recovery during the first half of the year. With demand weak, the overhang of vacant properties for sale substantial, distressed sales elevated, and construction financing tight, new units were started at an average annual rate of about 410,000 units between January and May--a bit below the level recorded in the fourth quarter of 2010 and just 50,000 units above the quarterly low reached in the first quarter of 2009 (figure 3).
Activity in the multifamily sector has been a bit more buoyant, as the ongoing reluctance of potential homebuyers to purchase a home, compounded by tight mortgage credit standards, appears to have led to an increase in demand for rental housing. Indeed, vacancy rates for multifamily rental units have dropped noticeably, and rents for apartments in multifamily buildings have moved up. However, construction financing remains difficult to obtain for many potential borrowers. Starts in the multifamily sector averaged 160,000 units at an annual rate in the first five months of 2011, noticeably above the 100,000 units started in the fourth quarter of 2010 but still well below the 300,000-unit rate that had prevailed for much of the previous decade.
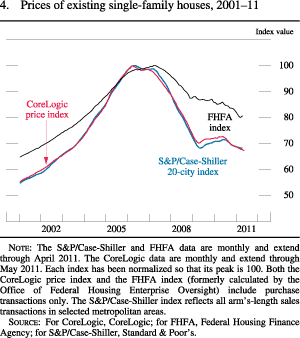
House prices fell further over the first half of 2011. The latest readings from national indexes show price declines for existing homes over the past 12 months in the range of 5 to 8 percent (figure 4). One such measure with wide geographic coverage--the CoreLogic repeat-sales index--fell 8 percent over the 12 months ending in May to a level that is about 4 percent below the previous trough in April of 2009. House prices are being held down by the same factors restraining housing construction--the large inventory of unsold homes, the high number of distressed sales, and lackluster household demand. The inventory of unsold homes will likely put downward pressure on house prices for some time, given the large number of seriously delinquent mortgages that could still entfer the foreclosure inventory. As a result of the decline in house prices, the share of mortgages with negative equity has continued to rise: In March 2011, roughly one in four mortgage holders owed more on their mortgages than their homes were worth.
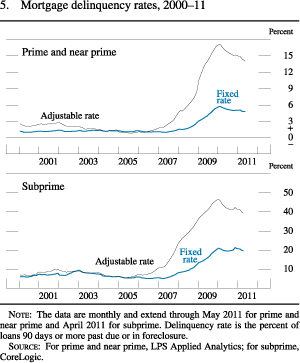
Indicators of credit quality in the residential mortgage sector continued to reflect strains on homeowners confronting depressed home values and high unemployment. Although delinquency rates on most categories of mortgages edged modestly lower in the first part of 2011, they stayed at historically high levels (figure 5). As of May, serious delinquency rates on loans to prime and near-prime borrowers stood at about 5 percent for fixed-rate loans and 14 percent for variable-rate loans.2 For subprime loans, as of April (the latest month for which data are available), serious delinquency rates remained near 20 percent for fixed-rate loans and 40 percent for variable-rate loans. The number of homes entering the foreclosure process declined in the first quarter of 2011, but the number of properties at some point in the foreclosure process remained elevated. Mortgage servicers continued to grapple with deficiencies in their foreclosure procedures; resolution of these issues could eventually be associated with an increase in the number of properties entering the foreclosure process as servicers work through the backlog of severely delinquent loans more quickly.3
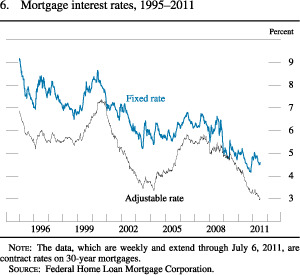
Interest rates on fixed-rate mortgages fell, on net, during the first half of 2011, a move that largely paralleled the decline in Treasury yields over the period (figure 6). Even with mortgage rates near historically low levels, access to mortgage credit continued to be restrained by negative equity and tight lending standards. For example, the April 2011 Senior Loan Officer Opinion Survey on Bank Lending Practices (SLOOS) indicated that standards on prime and nontraditional residential mortgages and home equity loans were about unchanged or moderately tighter during the first quarter, and that demand for these loans continued to decline.4 The pace of mortgage applications for home purchases remained very sluggish in the first half of the year, probably reflecting the stringency of lending terms and the overall weakness of housing demand. Refinancing activity increased modestly in the second quarter in response to the downward drift in interest rates, but such activity remains subdued compared with that seen in 2010. Overall, mortgage debt outstanding continued to contract.
Net issuance of mortgage-backed securities (MBS) guaranteed by government-sponsored enterprises (GSEs) expanded slightly in the first half of the year but remained relatively low, consistent with the slow pace of mortgage originations to finance home purchases. Net issuance of Ginnie Mae securities remained considerably more robust than net issuance of securities by Fannie Mae and Freddie Mac, reflecting the substantial share of mortgages insured by the Federal Housing Administration (FHA). The securitization market for mortgage loans not guaranteed by a housing-related GSE or the FHA remained essentially closed. Yields on agency MBS fell roughly in line with those on Treasury securities. The Treasury Department announced on March 21 that it would begin to sell its $142 billion agency MBS portfolio at a pace of about $10 billion per month; the announcement appeared to have little lasting effect on spreads of yields on MBS over those on comparable-maturity Treasury securities. Through the end of June, the Treasury had sold MBS with a current face value of about $34 billion.
Consumer Spending and Household Finance
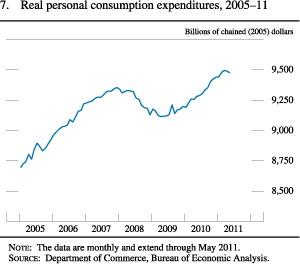
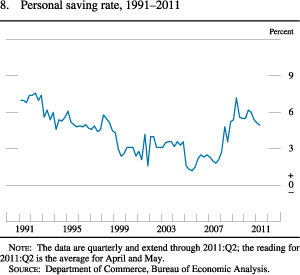
The rate of increase in consumer spending slowed appreciably during the first half of the year. After rising at an annual rate of more than 3 percent in the second half of 2010, real personal consumption expenditures (PCE) stepped down to about a 2 percent rate of increase in the first quarter, and available information suggests that the rise in spending in the second quarter was quite modest as well (figure 7). Consumer outlays in the second quarter were held down in part by the reduced availability of motor vehicles, especially for those models affected by the supply chain disruptions that followed the earthquake in Japan; purchases of motor vehicles should rebound in coming months as dealer supplies are replenished. More fundamentally, however, continued consumer pessimism and a slower pace of increase in real household income, only partly due to temporarily high energy and food prices, also appear to have weighed on consumption. The saving rate, although continuing to edge down, remains well above levels that prevailed prior to the recession (figure 8).
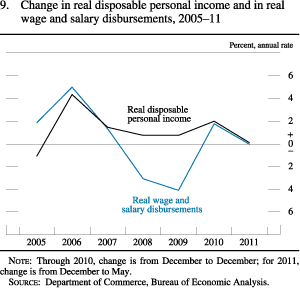
Despite a temporary reduction in payroll tax rates beginning in January, aggregate real disposable personal income--personal income less personal taxes, adjusted for price changes--was unchanged, on net, over the first five months of the year after rising 2 percent in 2010 (figure 9). Before taxes, real wage and salary income, which reflects both the number of hours worked and average hourly wages adjusted for inflation, was also flat from December to May after having risen 1-3/4 percent last year. Wage gains have been restrained by the weakness in the labor market. Moreover, the purchasing power of wages and salaries has been drained by this year's run-up in price inflation. One measure of real wages--average hourly earnings of all employees, adjusted for the rise in PCE prices--fell about 1-1/2 percent at an annual rate over the first five months of 2011 after having increased 1/2 percent over the 12 months of 2010.
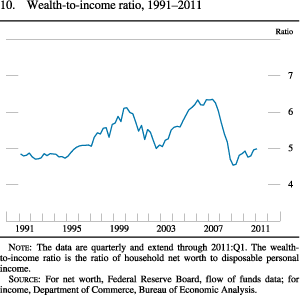
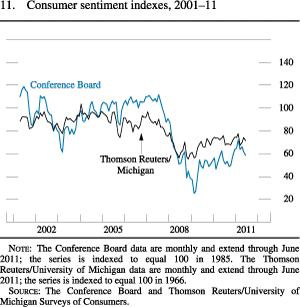
Two other important determinants of consumer outlays are also acting as a restraint on spending. Although the wealth-to-income ratio has trended up since the beginning of 2009, it remains near the low end of the range that has prevailed since the mid-1990s (figure 10). In addition, consumer sentiment, which had moved up early in 2011, retreated again when gas prices spiked in the spring. More broadly, consumer sentiment seems to have improved little, if any, from the readings that were typical of 2009 and 2010 (figure 11).
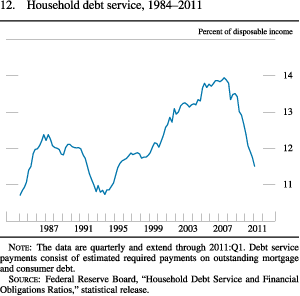
Total household debt contracted at an annual rate of about 2 percent in the first quarter of the year, roughly the same pace seen in 2010, as the decline in mortgage debt noted earlier was only partially offset by a moderate increase in consumer credit. Tight credit conditions precluded some households from obtaining credit, and charge-offs remained elevated on many categories of loans. The ongoing reduction in overall household debt levels, combined with low interest rates and a slight increase in personal income, resulted in a further decline in the debt service ratio--the aggregate required principal and interest payment on existing mortgages and consumer debt relative to income (figure 12). Indeed, as of the first quarter of 2011, the debt service ratio was 11.5 percent, the lowest level seen since 1995.
The modest expansion of consumer credit, which began in late 2010, reflects a mixed picture. Nonrevolving consumer credit, which consists largely of auto and student loans and accounts for about two-thirds of total consumer credit, rose at an annual rate of almost 5 percent in the first five months of 2011. The increase is consistent with responses to the April 2011 SLOOS, which indicated a sharp rise in banks' willingness to make consumer installment loans and an ongoing easing of terms and standards on them. However, revolving consumer credit--mostly credit card borrowing--declined through April, albeit at a slower pace than in 2010; early estimates point to an increase in May. Although a net fraction of about 20 percent of banks responding to the April 2011 SLOOS reported an easing of standards for approval of credit card applications, access to credit card loans for borrowers with blemished credit histories remained limited. In addition, the contraction in home equity loans, historically a source of funding for consumer durables and other large household expenditures, appears to have intensified during the first half of 2011, in part owing to declines in home equity and still-stringent lending standards.
Indicators of consumer credit quality generally improved. The delinquency rates on credit card loans, both at commercial banks and in securitized pools, retreated to less than 4 percent in the first quarter and May, respectively--at the low ends of their ranges over recent decades. Delinquencies on nonrevolving consumer loans at commercial banks also edged lower, while delinquencies on auto loans at captive finance companies were flat, on net, over the first four months of the year; both of these measures remained around their historical averages.
Interest rates on consumer loans held fairly steady, on net, in the first half of 2011. Interest rates on new-auto loans continued to linger at historically low levels. Rates on credit card loans are around their historical averages, but the spread of these rates to the two-year Treasury yield is quite wide, in part because of pricing adjustments made in response to the Credit Card Accountability Responsibility and Disclosure Act, or Credit Card Act, of 2009.5
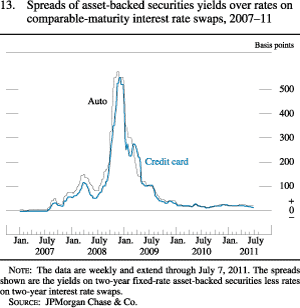
In the first half of 2011, issuance of consumer asset-backed securities (ABS) remained at about the same pace as in 2010 but still well below average issuance rates prior to the financial crisis. Securities backed by auto loans made up a large share of the new supply. Issuance of credit card ABS, however, remained weak, as the sharp contraction in credit card lending limited the need for new funding and as last year's accounting rule changes reportedly damped the attractiveness of securitizing these loans, particularly since banks remained awash in other sources of cheap funding.6 Yields on ABS and the spreads of such yields over comparable-maturity interest rate swap rates were little changed, on net, over the first half of the year, stabilizing at levels only slightly higher than those seen prior to the financial crisis (figure 13).
The Business Sector
Fixed Investment
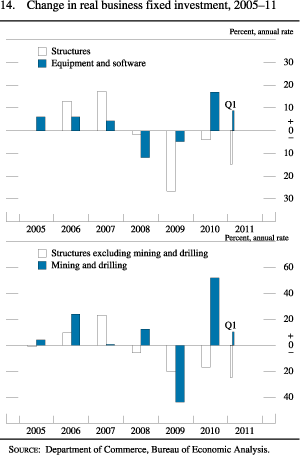
Real business spending for equipment and software (E&S) rose at an annual rate of about 10 percent in the first quarter, roughly the same pace as in the second half of 2010 (figure 14). Business purchases of motor vehicles rose briskly, and outlays on information technology (IT) capital and on equipment other than transportation and IT continued to rise at solid rates. More-recent data on orders and shipments for a broad range of equipment categories suggest that E&S spending will likely post another sizable gain in the second quarter. Spending is being boosted by the need to replace older, less-efficient equipment and, in some cases, to expand capacity. One soft spot in the second quarter will likely be in business purchases of motor vehicles, which, like consumer purchases, were held down by the shortages of Japanese nameplate cars in the wake of the earthquake in Japan, but this effect should be reversed during the second half of the year.
By contrast, investment in nonresidential structures remains at a low level. After falling 17 percent in 2010, real business outlays on structures outside of the drilling and mining sector fell at an annual rate of 25 percent in the first quarter. Although the incoming data point to a small increase in outlays in the second quarter, high vacancy rates, continuing price declines in all but a few markets, and difficult financing conditions for builders suggest that spending will be weak for some time to come. However, spending on drilling and mining structures has continued to rise at a robust pace in response to elevated oil prices and advances in technology for horizontal drilling and hydraulic fracturing.
Inventory Investment
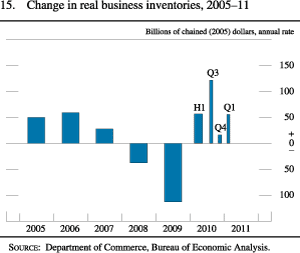
Real inventory investment stepped up in the first quarter, as stockbuilding outside of motor vehicles increased somewhat and motor vehicle inventories were about unchanged following a substantial fourth-quarter runoff (figure 15). Outside of the motor vehicle sector, the inventory-to-sales ratios for most industries covered by the Census Bureau's book-value data remain near the levels observed before the recession, and surveys suggest that inventory positions for most businesses generally are not perceived as being excessive. In the motor vehicle sector, the effects of the earthquake in Japan and supply constraints on the production of some of the most fuel-efficient domestic nameplate cars led to a sharp drop in inventories in the second quarter, but some significant rebuilding of inventories is likely to occur this quarter.
Corporate Profits and Business Finance
Operating earnings per share for S&P 500 firms continued to rise in the first quarter of 2011, increasing at a quarterly rate of about 6 percent. With the latest rise, aggregate earnings per share advanced to their pre-crisis peak. During much of the first half of the year, analysts marked up their forecasts of year-ahead earnings by a modest amount; however, their forecasts were flat from May to June.
The credit quality of nonfinancial corporations improved further in the first half of 2011 as firms continued to strengthen their balance sheets. Liquid assets remained at record-high levels in the first quarter, and the aggregate ratio of debt to assets--a measure of corporate leverage--edged lower. Credit rating upgrades of corporate debt outpaced downgrades through June, and the six-month trailing bond default rate for nonfinancial firms remained close to zero. The delinquency rate on commercial and industrial (C&I) loans at commercial banks decreased in the first quarter to 2-1/2 percent, about the middle of its range over the past two decades.
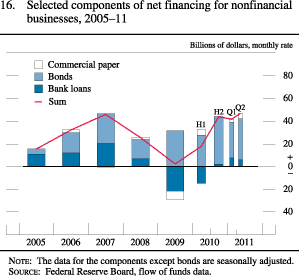
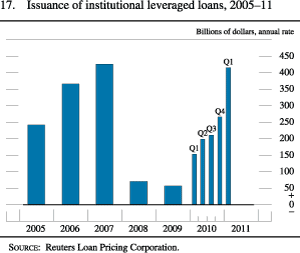
Borrowing by nonfinancial corporations remained robust in the first half of the year, reflecting both strong corporate credit quality and favorable financing conditions in capital markets (figure 16). Gross issuance of nonfinancial corporate bonds rose to a monthly record high in May amid heavy issuance of both investment- and speculative-grade debt. Firms sought to refinance existing debt, lock in new funding at current low yields, and, to a lesser extent, finance merger and acquisition activity. The amount of unsecured nonfinancial commercial paper outstanding also picked up a bit in the first half of the year. Issuance in the syndicated leveraged loan market reached pre-crisis levels, partly owing to heavy refinancing activity and in response to strong demand for floating-rate assets from institutional investors (figure 17). Likely reflecting in part an increased appetite for higher-yielding debt instruments, the market for collateralized loan obligations (CLOs) showed signs of renewed activity, and issuance picked up.
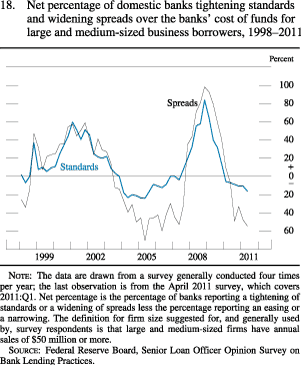
After declining sharply in 2009 and 2010, C&I loans on banks' books rose at a vigorous pace in the first half of 2011. The SLOOSs of January 2011 and April 2011 showed that banks continued to ease standards and terms for C&I loans (figure 18). In April, more than half of the survey's respondents reported having trimmed spreads over their cost of funds on loans to firms of all sizes. Respondents also indicated that nonprice loan terms have eased; these results were corroborated by the May 2011 Survey of Terms of Business Lending (STBL), which suggested that the average size of loan commitments at domestic banks and the average maturity of loans drawn on those commitments have trended up in recent quarters. Banks responding to the SLOOS also noted an ongoing firming of demand for C&I loans, particularly by large and medium-sized firms.
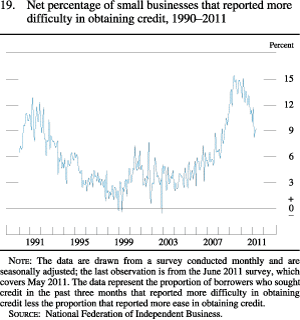
For small businesses, borrowing conditions remained tight. The May STBL revealed that the weighted-average spread on C&I loan commitments of less than $1 million stayed stubbornly high in recent quarters, in contrast to a modest decline in the spread on commitments of more than $1 million. However, some signs of improvement in credit availability for small businesses have emerged in recent months. In addition to the easing of terms and standards for C&I loans reported in the April SLOOS, surveys conducted by the National Federation of Independent Business showed that the net fraction of small businesses reporting that credit had become more difficult to obtain than three months ago has declined to its lowest level since the financial crisis, although it remains well above its pre-crisis average (figure 19). Moreover, the net percentage of respondents expecting credit conditions to become tighter over the next three months remained, on average, lower than in 2010. Demand for credit by small businesses is still weak, with a historically small fraction of such businesses indicating that they have borrowing needs. In addition, the fraction of businesses that cited credit availability as the most important problem that they faced continued to be small; many firms pointed instead to weak demand from customers as their greatest concern.
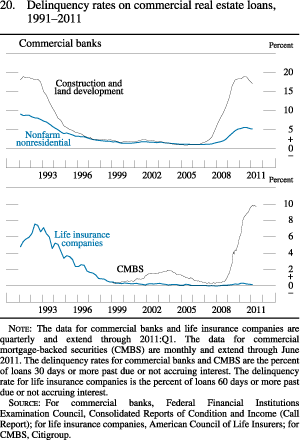
The fundamentals in commercial real estate (CRE) markets remained extremely weak in the first half of 2011, although financing conditions for certain CRE assets did see some modest improvement. Banks' holdings of CRE loans continued to contract in the first half of the year, driven by reduced lending for construction and land development and sizable charge-offs on existing loans. Although delinquency rates for CRE loans at commercial banks receded slightly from recent peaks, they remained at historically high levels, while the delinquency rate for loans funded by commercial mortgage-backed securities (CMBS) also continued to be elevated (figure 20). Responses to questions on CRE lending in the April 2011 SLOOS showed that most domestic banks reported no change in their lending standards for approving CRE loans, although a few large banks and foreign banks reported having eased such standards.
On net, financing conditions for investment-quality properties--roughly, those with stable rent streams in large cities--improved in the first half of the year, although conditions worsened a bit in June with the more general pullback from risky assets. Secondary-market spreads for AAA-rated CMBS declined to multiyear lows through May before retracing somewhat in June, and respondents to the Federal Reserve's June 2011 Senior Credit Officer Opinion Survey on Dealer Financing Terms (SCOOS) indicated that funding for less-liquid legacy CMBS had increased.7 New issuance of CMBS continued to pick up, with issuance in the first half of 2011 exceeding that in all of 2010. Renewed investor interest in high-quality properties has also been evident in investment flows into, and the share prices for, equity real estate investment trusts, or REITs.
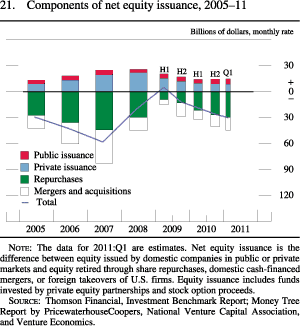
In the corporate equity market, combined gross issuance of seasoned and initial offerings continued in the first quarter of 2011 at the same solid pace seen throughout 2010 (figure 21). At the same time, however, volumes of equity retirements from share repurchases and cash-financed mergers and acquisitions remained high and continued to rise.
The Government Sector
Federal Government
The deficit in the federal unified budget remains elevated. The Congressional Budget Office (CBO) projects that the deficit for fiscal year 2011 will be close to $1.4 trillion, or roughly 9 percent of GDP--a level comparable to deficits recorded in 2009 and 2010 but sharply higher than the deficits recorded prior to the onset of the recession and financial crisis. The budget deficit continues to be boosted by the effects of the stimulus policies enacted in recent years, including the provisions of the American Recovery and Reinvestment Act of 2009 (ARRA) and the Tax Relief, Unemployment Insurance Reauthorization, and Job Creation Act of 2010. In addition, the weakness in the economy continues to damp revenues and boost payments for income support.
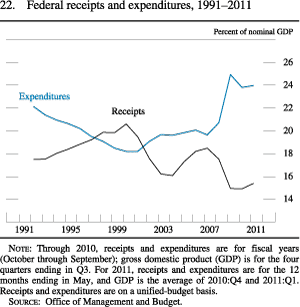
Federal receipts have risen rapidly lately--they are up about 10 percent in the first eight months of fiscal 2011 compared with the same period in fiscal 2010. Nonetheless, the level of receipts remains low; indeed, the ratio of receipts to national income is less than 16 percent, near the lowest reading for this ratio in 60 years (figure 22). The robust rise in revenues thus far this fiscal year is largely a result of strong growth in individual income tax receipts, likely reflecting some step-up in the growth of nominal wage and salary income and an increase in capital gains realizations. Corporate taxes in the first eight months of the fiscal year were up only about 5 percent from last year, as the effect of strong profits growth on receipts was partially offset by recent legislation providing more-favorable tax treatment for some business investment.
Total federal outlays have risen nearly 6 percent in the first eight months of fiscal 2011 relative to the comparable year-earlier period. Much of the increase in outlays this year relative to last has been related to financial transactions. In particular, repayments to the Treasury of obligations for the Troubled Asset Relief Program lowered measured outlays last year and hence reduced the base figure for this year's comparison. Excluding these transactions, outlays were up less than 2 percent this year. This relatively small increase in outlays reflects reductions in both ARRA spending and unemployment insurance payments as well as a subdued pace of defense spending. By contrast, net interest payments have increased sharply, while most other spending has increased at rates comparable to fiscal 2010.
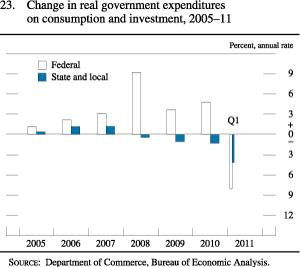
As measured in the national income and product accounts (NIPA), real federal expenditures on consumption and gross investment--the part of federal spending that enters directly into the calculation of real GDP--fell at an annual rate of close to 8 percent in the first quarter (figure 23). Defense spending, which tends to be erratic from quarter to quarter, plunged almost 12 percent and nondefense purchases were unchanged.
Federal Borrowing
Federal debt expanded at a somewhat slower pace in the first half of this year than in 2010. On May 16, the federal debt reached the $14.294 trillion limit, and the Treasury began to implement extraordinary measures to extend its ability to fund government operations.8 The Treasury estimates that if the Congress does not raise the debt limit, the capacity of these extraordinary measures will be exhausted on August 2. Thus far, financial market participants do not seem to be pricing in significant odds of a "technical default." However, the risk of such a default has been noted by the rating agencies. In June, Moody's Investors Service, Fitch Ratings, and Standard & Poor's each indicated that they may downgrade, to varying degrees, the credit rating of some or all U.S. debt securities if principal or interest payments are missed. Moody's noted that even if default is avoided, its rating outlook would depend on the achievement of a credible agreement on substantial deficit reduction. In mid-April, Standard & Poor's revised its outlook for the federal government's AAA long-term and A-1+ short-term sovereign credit ratings to negative, citing "material risks" that policymakers might fail to reach an agreement within the next two years on how to address medium- and long-term fiscal imbalances.
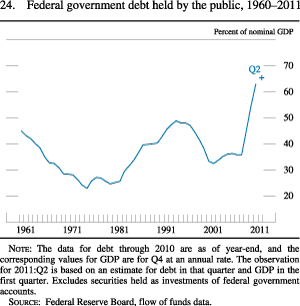
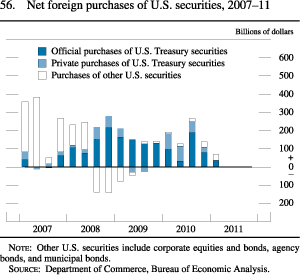
Federal debt held by the public reached about 65 percent of nominal GDP in the second quarter of 2011 and, according to CBO projections, will surpass 70 percent of GDP in 2012 (figure 24). Despite continued high levels of federal government financing needs and the concerns raised by the debt limit, Treasury auctions have been generally well received so far this year. For the most part, bid-to-cover ratios and indicators of foreign participation at auctions fell within historical ranges. Demand for Treasury securities likely continued to be supported by heightened investor demand for relatively safe and liquid assets in light of fiscal troubles in some European countries. However, foreign net purchases of Treasury securities and the pace of growth of foreign custody holdings of Treasury securities at the Federal Reserve Bank of New York moderated, on net, during the first half of the year.
State and Local Government
State and local governments remained under significant fiscal pressure in the first half of 2011. Over the first six months of the year, these governments cut an average of 28,000 jobs per month, similar to the pace of job loss observed in 2010. Real construction expenditures have also declined. After falling modestly in 2010, real structures investment by state and local governments plunged in the first quarter of 2011, and available information on nominal construction through May suggests that construction spending continued to decline in recent months. Although federal stimulus funds have boosted construction expenditures on highways and other transportation infrastructure, other types of construction spending--most notably construction of schools--have been declining. Capital expenditures are not typically subject to balanced budget requirements. Nevertheless, the payments of principal and interest on the bonds used to finance capital projects are generally made out of operating budgets, which are subject to balanced budget constraints. As a result, state and local governments have had to make difficult choices even about this form of spending.
State and local revenues appear to have risen moderately over the first half of this year. Many states reported strong revenue collections during the income tax filing season, but federal stimulus grants, while still sizable, have begun to phase out. At the local level, property tax collections appear to be softening as the sharp declines in house prices increasingly show through to assessments and hence to collections. Thus, despite the recent good news on state revenues, the state and local sector is likely to continue to face considerable budgetary strain for a while. Moreover, many state and local governments will need to set aside money in coming years to rebuild their employee pension funds after the financial losses sustained over the past couple of years and to fund health-care benefits for their retired employees.
State and Local Government Borrowing
While conditions in the municipal bond market improved somewhat in the first half of the year, those conditions continue to reflect ongoing concerns over the financial health of state and local governments. On balance this year, yields on long-term general obligation bonds fell somewhat more than those on comparable-maturity Treasury securities; however, the ratio of municipal bond yields to Treasury yields remained high by historical standards. Credit default swap (CDS) spreads for many states narrowed to their lowest levels in at least a year but remain well above their pre-crisis levels, while downgrades of the credit ratings of state and local governments continued to outpace upgrades by a notable margin during the first half of the year.
Issuance of long-term securities by state and local governments dropped to multiyear lows in the first half of 2011. In part, the decline is a consequence of the outsized issuance seen in the fourth quarter of 2010, when states and municipalities rushed to issue long-term bonds before the expiration of the Build America Bond program at the end of the year.9 However, the recent weakness likely also reflected tepid investor demand. Mutual funds that invest in long-term municipal bonds experienced heavy net outflows late last year and in January 2011. Net redemptions slowed substantially in subsequent months, and flows have been roughly flat since May.
The External Sector
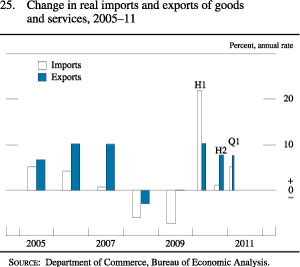
Both real exports and imports of goods and services expanded at a solid pace in the first quarter of 2011. Real exports increased at an annual rate of 7-1/2 percent, supported by continued robust foreign demand and the lower value of the dollar (figure 25). Most major categories of exports rose, with industrial supplies, capital goods, and automotive products posting the largest gains. Across trading partners, exports to Canada, Mexico, and other emerging market economies (EMEs) were particularly strong, while exports to the European Union (EU) and China were about flat. Data for April and May suggest that exports continued to grow at a robust pace in the second quarter.
After moving up only modestly in the second half of 2010, real imports of goods and services accelerated noticeably in the first quarter of this year, increasing at an annual rate of almost 5-1/4 percent, reflecting a return to a more normal pace of expansion. Imports of all major categories increased, with these gains fairly broad based across trading partners. Data for April and May indicate that, despite some drag from the disruptions to automotive imports from Japan following the earthquake, imports of goods and services have continued to rise at a moderate pace.
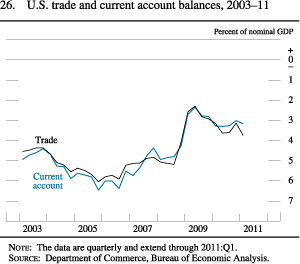
All told, net exports made a small positive contribution of almost 1/4 percentage point to real GDP growth in the first quarter of 2011. The current account deficit widened slightly from an average annual rate of $465 billion in the second half of 2010 to $477 billion, or about 3-1/4 percent of GDP, in the first quarter of this year; the widening resulted primarily from the increase in the price of imported oil (figure 26).
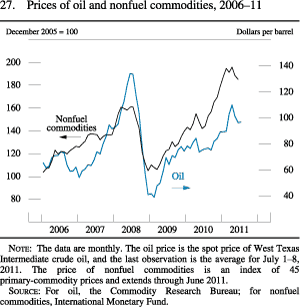
The spot price of West Texas Intermediate (WTI) crude oil continued its ascent into the early months of 2011, rising sharply from around $90 per barrel at the beginning of the year to peak at almost $115 by late April (figure 27). The increase over the first four months of the year likely reflected continued robust growth in global oil demand, particularly in the EMEs, coupled with supply disruptions and the potential for further disruptions due to the political unrest in the Middle East and North Africa (MENA) region. In recent weeks, the spot price of WTI has fallen back to under $100 per barrel because of increasing concerns that global activity might be decelerating. On June 23, the International Energy Agency decided to release 60 million barrels of oil from strategic reserves over the following 30 days. The price of the far-dated futures contracts for crude oil (that is, the contracts expiring in December 2019) mostly fluctuated in the neighborhood of $100 during the first half of the year, implying that the markets viewed the run-up in oil prices seen earlier in the year as partly transitory.
Over the first quarter, prices for a broad variety of nonfuel commodities also moved up significantly. As with oil, these increases were supported primarily by continued strength in global demand, especially from the EMEs. In addition, tight supply conditions played a significant role in pushing up prices for many food commodities. At the onset of the second quarter, prices stabilized and generally began to retreat amid growing uncertainty about the outlook for the global economy, falling back to around the elevated levels registered at the start of this year. (See the box "Commodity Price Developments.")
Prices of non-oil imported goods accelerated in the first quarter of 2011, surging at an annual rate of 7-1/4 percent, the fastest pace since the first half of 2008. This pickup was driven by a few factors, including the rise in commodity prices, significant increases in foreign inflation, and the depreciation of the dollar. In the second quarter of this year, with commodity prices apparently stabilizing, import price inflation likely moderated.
Commodity Price Developments
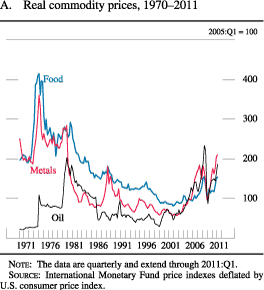
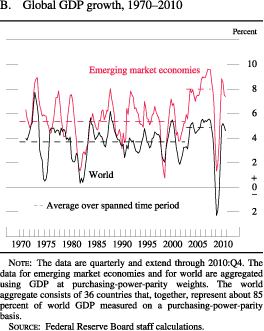
Despite recent declines, nominal prices for many commodities are near record highs. The increase in commodity prices since 2002 runs counter to the trend over the prior two decades of declining real prices (figure A). The earlier trend decline in part reflected the aftermath of a spike in commodity prices in the 1970s, which eventually boosted supply and curtailed demand for commodities. The relatively low real commodity prices of the 1980s and 1990s, in turn, set the stage for the pickup in prices over the past decade, as underinvestment in new supply capacity left commodity markets ill-prepared to meet a surge in demand linked to rapid growth in global real gross domestic product (GDP) (figure B). The pickup in world GDP growth was led by the emerging market economies (EMEs). As EME growth is relatively commodity intensive, the concentration of world GDP growth in these economies added to upward pressures on demand for commodities and thus their prices.
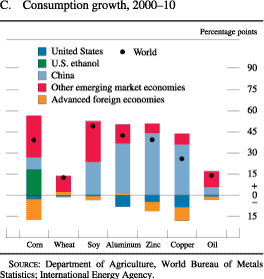
EME demand has been important for growth in global consumption of various commodities over the past decade (figure C). For oil, metals, and soybeans, the entire increase in consumption over the period is attributable to the EMEs, particularly China. For corn, increased U.S. ethanol production also has been an important factor in boosting consumption.
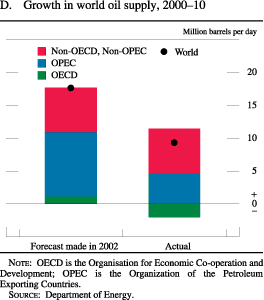
While demand for commodities has been strong, growth of supply has been relatively limited. For example, oil production over the past decade increased by only about half as much as was projected by the U.S. Department of Energy at the start of the decade (figure D). Production in the Organisation for Economic Co-operation and Development countries was depressed by lower-than-expected production in Mexico and the North Sea. The substantial miss in the forecasted production by the Organization of the Petroleum Exporting Countries (OPEC) in part reflects a surprising unresponsiveness of OPEC's supply to higher prices, suggesting that an upward shift in OPEC's perceived price target also held back supply growth. Likewise, for metals, industry groups were repeatedly overly optimistic in regard to projected supply growth, most notably for copper. For agricultural products, although yields and acreage increased over the past 10 years, unusually unfavorable weather has restrained supplies in recent years.
The current high level of commodity prices is likely to prompt an expansion of supply and a moderation in demand that could relieve some of the pressures currently boosting prices. For energy, nonconventional oil production continues to expand, including the Canadian oil sands and the recent developments in North Dakota's Bakken Shale. Similarly, for natural gas, new drilling technology has unlocked previously inaccessible deposits of shale gas, resulting in much higher U.S. natural gas production and lower prices. For agriculture, although harvested acres overseas have expanded briskly since 2000, yields for corn and some other crops are currently much lower than in the United States, suggesting the potential for further gains abroad.
Although there are reasons for optimism, the relative timing and magnitude of these supply and demand adjustments are uncertain. Commodity prices will continue to be affected by the general evolution of the global economy and by even less predictable factors, such as weather and political strife.
National Saving
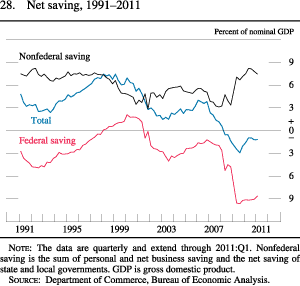
Total U.S. net national saving--that is, the saving of U.S. households, businesses, and governments, excluding depreciation charges--remains extremely low by historical standards (figure 28). After having reached nearly 4 percent of nominal GDP in early 2006, net national saving dropped over the subsequent three years, reaching a low of negative 3 percent in the third quarter of 2009. Since then, the national saving rate has edged up, on balance, but remains negative: Net national saving was negative 1.4 percent of nominal GDP in the first quarter of 2011 (the latest data available). The increase in the federal deficit more than accounts for the decline in the net national saving rate since 2006, as private saving rose considerably, on balance, over this period. National saving will likely remain relatively low this year in light of the continuing large federal budget deficit. If low levels of national saving persist over the longer run, they will likely be associated with both low rates of capital formation and heavy borrowing from abroad, limiting the rise in the standard of living of U.S. residents over time.
The Labor Market
Employment and Unemployment
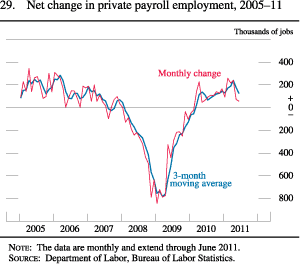
Conditions in the labor market have improved only gradually and unevenly. In the first four months of 2011, private payroll employment increased an average of about 200,000 jobs per month, up from the average pace of 125,000 jobs per month recorded in the second half of 2010 (figure 29). However, private employment gains slowed in May and June, averaging only 65,000, with the step-downs widespread across industries. In addition, cutbacks in jobs continued at state and local governments.
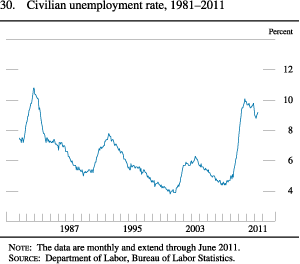
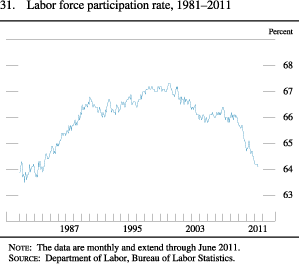
The unemployment rate, which had appeared to be on a downward trajectory at the turn of the year, leveled off at around 9 percent in the early months of the year. Since then, it has edged up, and it reached 9.2 percent in June (figure 30). Long-term joblessness has also remained elevated. In June, 44 percent of those unemployed had been out of work for more than six months (see the box "Long-Term Unemployment"). Meanwhile, the labor force participation rate, which had declined gradually over 2009 and 2010, has remained roughly flat at a low level since the beginning of 2011 (figure 31).
Long-Term Unemployment
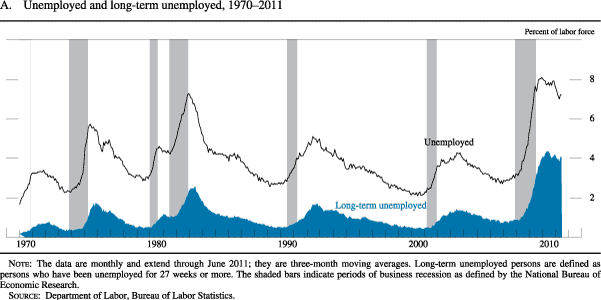
The deep recession and subsequent slow improvement in the labor market have resulted in a sharp increase in the incidence of long-term unemployment, defined here as being out of work 27 weeks or longer. In the first quarter of this year, about 6 million persons (4 percent of the labor force) were long-term unemployed. The long-term unemployment rate is almost twice as high as its previous peak of about 2-1/2 percent of the labor force following the recession of the early 1980s (figure A). Indeed, the long-term unemployed currently make up 44 percent of all unemployed, up from a previous peak of 25 percent in the early 1980s.
Although all unemployed persons experience a loss of income, the long-term unemployed often face particularly serious economic hardships. They are at greater risk of exhausting unemployment insurance benefits and drawing down savings and other assets, and thus they likely suffer a greater deterioration of living standards.
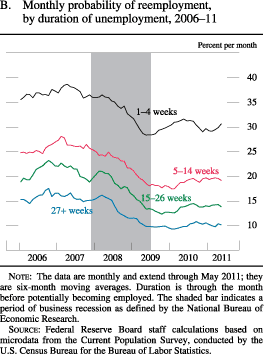
Even in good times, the likelihood of finding a new job is generally lower for those who have remained unemployed longer (figure B). During the most recent recession, job finding rates fell for workers at all unemployment durations. More recently, job finding rates have inched up some from their lows at the end of the recession, but they remain quite low at all durations.
In part, low job finding rates among the long-term unemployed reflect the fact that, at any given time, some attributes--including certain skills, locations, or other characteristics--are associated with greater difficulty in finding employment. In addition, long-term unemployment may compound the difficulty that some individuals have in finding a job by degrading their skills, employment networks, and reputations. Moreover, some who have been unsuccessful in their job search for a long period may permanently drop out of the labor force, in some cases by retiring earlier than planned or applying for disability benefits, thereby reducing aggregate employment for years to come.
Other labor market indicators also corroborate the view that the labor market remains weak. Initial claims for unemployment insurance, which had trended steadily downward over the first part of this year, backed up some in the second quarter. Measures of job vacancies edged up, on balance, over the first half of the year, but hiring has remained quite tepid.
Productivity and Labor Compensation
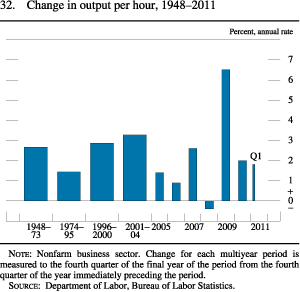
Labor productivity has risen less rapidly recently. Following an outsized increase of 6 percent in 2009, output per hour in the nonfarm business sector increased 2 percent in 2010 and at an annual rate of 1-3/4 percent in the first quarter of 2011 (figure 32). Available information suggests that labor productivity likely decelerated further in the second quarter.
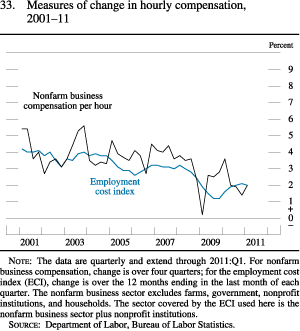
Increases in hourly compensation continue to be restrained by the weak condition of the labor market. The 12-month change in the employment cost index for private industry workers, which measures both wages and the cost to employers of providing benefits, has been 2 percent or less since the start of 2009 after several years of increases in the neighborhood of 3 percent (figure 33). Nominal compensation per hour in the nonfarm business sector--a measure derived from the labor compensation data in the NIPA--has also decelerated noticeably over the past couple of years; this measure rose just 2 percent over the year ending in the first quarter of 2011, well below the average increase of about 4 percent in the years before the recession. Similarly, average hourly earnings for all employees--the timeliest measure of wage developments--rose 1.9 percent in nominal terms over the 12 months ending in June.
Unit labor costs in the nonfarm business sector edged up 3/4 percent over the year ending in the first quarter of 2011, as the rate of increase of nominal hourly compensation was just slightly higher than that of labor productivity. Over the preceding year, unit labor costs fell nearly 3 percent.
Prices
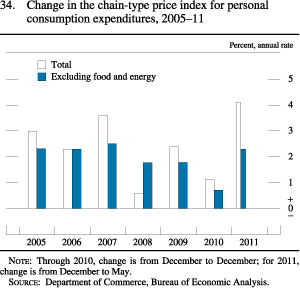
Inflation stepped up considerably in the first half of 2011. After rising less than 1-1/4 percent over the 12 months of 2010, the overall PCE chain-type price index increased at an annual rate of more than 4 percent between December 2010 and May 2011 as energy prices soared and food prices accelerated (figure 34). PCE prices excluding food and energy also accelerated over the first five months of the year, rising at an annual rate of 2-1/4 percent, compared with the extremely low rate of about 3/4 percent over the 12 months of 2010. The recent increases in both overall inflation and inflation excluding food and energy appear to reflect influences that are likely to wane in coming months.
Consumer energy prices--particularly for motor fuel and home heating oil--rose sharply in the first few months of 2011 as the price of crude oil surged. Between December and April, the PCE price index for consumer energy items climbed almost 12 percent (not at an annual rate), and the national-average price of gasoline approached $4 per gallon. But consumer energy prices began to turn down in May in response to declines in the prices of crude oil and wholesale refined products; while the June reading on the PCE index is not yet available, survey-based information on retail gasoline prices suggests that consumer energy prices likely declined further last month.
After rising modestly last year, consumer prices for food and beverages accelerated this year, rising at an annual rate of more than 6 percent from December to May. Farm commodity prices increased sharply over the past year as the emerging recovery in the global economy coincided with poor harvests in several major producing countries, and this sharp increase has fed through to consumer prices for meats and a wide range of other more-processed foods. In addition, a freeze-related upswing in consumer prices for fruits and vegetables boosted PCE food prices earlier this year; these prices began to retreat in the spring.
Price inflation for consumer goods and services other than energy and food appears to have been boosted during the first five months of 2011 by higher prices of imported items as well as by cost pressures generated by increases in the prices of oil and other industrial commodities; given the apparent stabilization of commodity prices, these pressures should fade in coming months. In addition, prices of motor vehicles increased sharply when supplies of new models were curtailed by parts shortages associated with the earthquake in Japan. These shortages are expected to diminish in coming months as supply chain problems are alleviated and motor vehicle production increases.
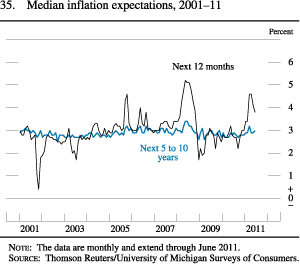
Longer-term inflation expectations remained stable during the first half of the year. In the Thomson Reuters/University of Michigan Surveys of Consumers, median longer-term expectations were 3 percent in June, well within the range seen over the past several years (figure 35). Moreover, the second-quarter reading of 10-year-ahead inflation expectations from the Survey of Professional Forecasters, conducted by the Federal Reserve Bank of Philadelphia, stood at 2-1/4 percent in the second quarter, only slightly higher than the 2 percent reading recorded in the fourth quarter of last year. Measures of inflation compensation derived from yields on nominal and inflation-indexed Treasury securities fluctuated over the first half of the year in response to changes in commodity prices and the outlook for economic growth. On balance, medium-term inflation compensation ended the first half of the year slightly higher, but compensation at longer-term horizons was little changed.
Survey-based measures of near-term inflation expectations moved up during the first half of the year, likely reflecting the run-up in energy and food prices. Median year-ahead inflation expectations in the Michigan survey, which had been relatively stable throughout much of 2010, stepped up markedly through April but then fell back a bit in May and June as prices for gasoline and food decreased.
Financial Developments
Financial market conditions became somewhat more supportive of economic growth, on balance, in the first half of 2011, reflecting in part continued monetary policy accommodation provided by the Federal Reserve. In the early part of the year, strong corporate profits and investors' perceptions that the economic recovery was firming supported a rise in equity prices and a narrowing of credit spreads. Since May, however, indications that the U.S. economic recovery was proceeding at a slower pace than previously anticipated, a perceived moderation in global growth, and mounting concerns about the persisting fiscal pressures in Europe weighed on investor sentiment, prompting some pullback from riskier financial assets.Monetary Policy Expectations and Treasury Rates
On net over the first half of the year, amid indications of a slowing in the pace of economic recovery, market participants pushed out the date when they expect the target federal funds rate to first rise above its current range of 0 to 1/4 percent and scaled back their expectations of the pace at which monetary policy accommodation will be removed. Quotes on money market futures contracts imply that, as of early July 2011, investors expect the federal funds rate to rise above its current target range in the fourth quarter of 2012, about three quarters later than the date implied at the start of the year.10 Investors also expect, on average, that the effective federal funds rate will be about 75 basis points by the middle of 2013, about 90 basis points lower than anticipated at the beginning of 2011. Over the first half of the year, investors coalesced around the view that the Federal Reserve would complete the $600 billion program of purchases of longer-term Treasury securities announced at the November 2010 meeting of the Federal Open Market Committee (FOMC); the program was completed at the end of June.
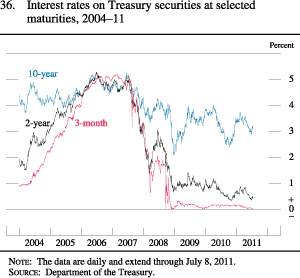
Yields on nominal Treasury securities declined, on balance, over the first half of 2011 (figure 36). Treasury yields initially rose in the first quarter amid signs that the U.S. economic recovery was on a firmer footing and that higher prices for energy and other commodities were boosting inflation and investor uncertainty about future inflation. However, yields subsequently more than reversed their earlier increases, as weaker-than-expected economic data pointed to a slower pace of economic recovery in the United States, commodity prices eased somewhat, and investors sought the relative safety and liquidity of Treasury securities in the face of heightened concerns about the ongoing fiscal strains in Europe. As of early July, yields on 2-, 5-, and 10-year Treasury notes had dropped about 20, 40, and 30 basis points, respectively, since the start of the year, reaching very low levels. Uncertainty about longer-term interest rates, as measured by the implied volatility on 10-year Treasury securities, declined, on balance, reflecting in part the resolution of uncertainty about the ultimate size and duration of the Federal Reserve's asset purchase program and the lower odds perceived by investors of a rapid removal of monetary policy accommodation. However, volatility increased for a time in mid-June as concerns escalated about the effects of Europe's fiscal problems on European banks. Thus far, the issues surrounding the statutory debt limit seem not to have affected either Treasury yields or implied volatility noticeably, suggesting that investors generally believe that policymakers will reach an agreement to raise the limit before the Treasury exhausts its capacity to borrow in early August.
Corporate Debt and Equity Markets
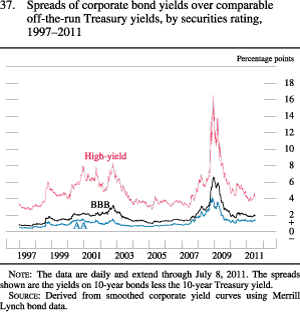
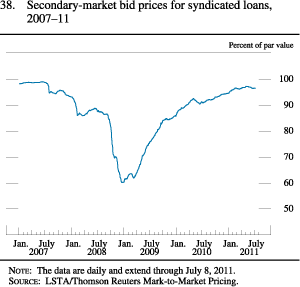
Yields on corporate bonds across the credit spectrum generally declined, on net, during the first half of the year by amounts broadly similar to those on comparable-maturity Treasury securities, leaving risk spreads little changed (figure 37). After narrowing in the first four months of the year, spreads subsequently retraced, reflecting disappointing news about the strength of the economic recovery at home as well as the ongoing fiscal stresses in Europe. Nonetheless, bond spreads remained at the lower ends of their historical ranges. The term structure of corporate yield spreads indicated that the recent widening was concentrated in near-term forward spreads rather than far-term forward spreads. This information suggests that while investors have become a bit more concerned about near-term risks, there has been little if any change in their willingness to bear risk at longer horizons; in fact, far-term forward spreads, particularly for high-yield bonds, are close to their historical lows. In the secondary market for syndicated leveraged loans, the average bid price edged up further, reflecting strong demand from institutional investors for the asset class and a further improvement in fundamentals (figure 38).
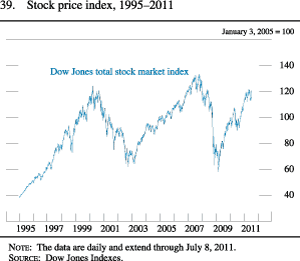
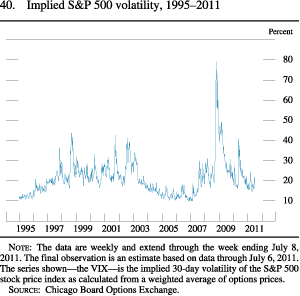
Broad equity price indexes posted hefty gains in the first quarter of 2011 because of strong earnings reports and expectations that the economic recovery was firming. Equity prices fell back somewhat in May and June as investors downgraded their expectations for economic growth and reacted to the situation in Europe, but the market subsequently rebounded as concerns about the near-term risks in Europe appeared to ease. On net, stock prices ended the first half of the year significantly higher (figure 39). Implied volatility of the S&P 500 stock price index, as calculated from options prices, was slightly lower, on net, but fluctuated in response to various risk events during the first half of the year (figure 40).
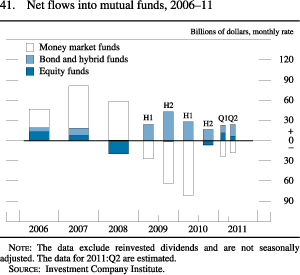
With some investors seeking to boost nominal returns in an environment of very low interest rates, monies continued to flow, on net, into mutual funds that invest in higher-yielding debt instruments (including speculative-grade corporate bonds and leveraged loans) in the first half of 2011 (figure 41). These inflows likely supported strong issuance and contributed to the easing of conditions in corporate bond markets. However, consistent with the subsequent downturn in risk sentiment, equity mutual funds experienced large net outflows in May and June--the first monthly outflows from such funds since October 2010. Money market mutual funds continued to have moderate net outflows amid the very low yields that these funds pay. Within the universe of money market funds, institutional prime money market funds experienced a stepped-up pace of outflows in June, likely reflecting in part some concerns about such funds' exposures to European financial institutions.
Market Functioning and Dealer-Intermediated Credit
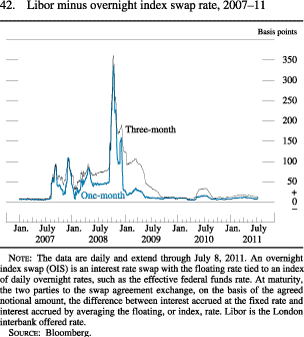
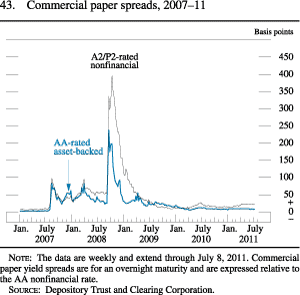
Conditions in short-term funding markets were generally stable in the first half of 2011. Spreads of London interbank offered rates, or Libor, over comparable-maturity overnight index swap rates--a measure of stress in short-term bank funding markets--remained relatively narrow (figure 42). However, forward agreements for short-term U.S. dollar funding starting three months hence jumped in mid-June as concerns increased regarding the exposures of some European banks to peripheral European sovereign debt. In addition, some European financial institutions faced reduced access to U.S. dollar funding, as evidenced by their declining issuance of commercial paper in the United States and rates on their paper that remain noticeably elevated compared with rates paid by other issuers. In commercial paper markets more broadly, spreads of yields on lower-quality A2/P2-rated paper over those on higher-quality AA-rated nonfinancial paper edged slightly higher, both at overnight and 30-day tenors; spreads of yields on AA-rated asset-backed commercial paper over those on AA-rated nonfinancial paper remained narrow (figure 43).
In repurchase agreement (repo) transactions, haircuts on securities used as collateral were, on balance, little changed over the first half of the year. The Federal Deposit Insurance Corporation's implementation on April 1 of a change in its deposit insurance assessment system--which, for the first time, effectively assessed premiums on the nondeposit liabilities of large banks--reduced banks' demand for short-term funding, putting downward pressure on short-term rates.11 Money market rates softened further in late June, with rates in secured funding markets near zero; investors pointed to a shortage of collateral and higher demand for safe, liquid assets as factors contributing to the decline.
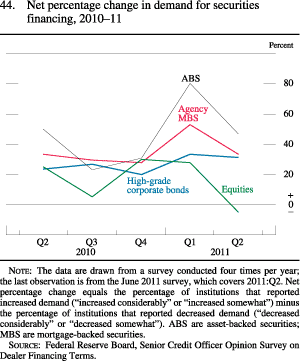
Information from the Federal Reserve's quarterly SCOOS suggested a continued gradual easing in credit terms for most types of counterparties in securities financing and over-the-counter (OTC) derivatives markets in the first half of the year. Dealers indicated that the easing came primarily in response to more-aggressive competition from other institutions and an improvement in general market liquidity and functioning. The easing of terms occurred primarily for securities financing transactions, while nonprice terms on OTC derivatives transactions were little changed on balance. Dealers also reported a continued increase in demand for funding for most types of securities, excluding equities (figure 44).
The use of dealer-intermediated leverage appears to have increased from its very low level reached during the financial crisis. Responses to special questions included in the SCOOS in March 2011 and June 2011 also tended to corroborate the view that dealer-intermediated leverage had increased somewhat over the past six months among both hedge funds and traditionally unlevered investors. Nonetheless, respondents to the June survey reported that the overall use of leverage remained at levels roughly midway between the pre-crisis peak and the post-crisis trough. That the usage of dealer-intermediated leverage is still well below the peak appears consistent with other evidence, including current triparty and securities lending activity, a lack of any meaningful issuance of structured finance products other than CLOs, and no sign of a pickup in financing instruments that embed significant leverage, such as total return swaps. Responses to another special question on the June 2011 SCOOS indicated that there was some unused funding capacity under existing agreements for all types of institutional clients, and that unused capacity had generally increased since the beginning of 2011. This finding suggests that leverage is constrained by counterparties' risk appetites rather than funding availability. With the pullback from risk-taking and turn in market sentiment in June (after responses to the June SCOOS were filed), leverage use appears to have declined. Hedge funds saw an erosion of the returns posted during the first few months of the year, leaving their returns roughly flat for the year to date.
Measures of liquidity and functioning in most financial markets suggest that conditions were generally stable during the first half of 2011. In the Treasury market, various indicators, such as differences in the prices between alternative securities with similar remaining maturities and spreads between yields on on-the-run and off-the-run issues, suggest that the market continued to operate normally and that the implementation and subsequent completion of the Federal Reserve's program of purchases of longer-term Treasury securities did not have an adverse effect on market functioning. Bid-asked spreads and dealer transaction volumes were within historically normal ranges. Estimates of the bid-asked spreads in corporate bond markets were steady at low levels, and the dispersion of dealer quotes in the CDS market reached the lowest level since the financial crisis. In the secondary market for leveraged loans, bid-asked spreads also moved modestly lower, on net, over the first half of the year.
Banking Institutions
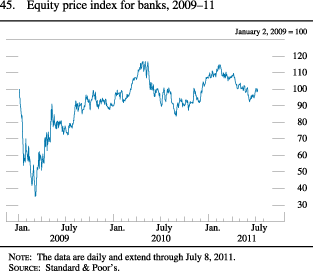
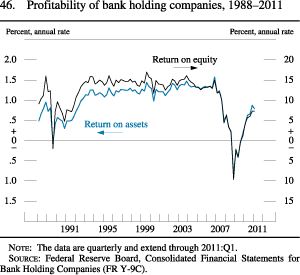
After a relatively positive first quarter, market sentiment toward the banking industry dimmed in the second quarter against the backdrop of the more guarded economic outlook and heightened uncertainty over future regulatory requirements for financial institutions. As a result, equity prices of commercial banks fell markedly, significantly underperforming the broader stock market over the first half of the year (figure 45). Measures of the profitability of the banking industry in the first quarter remained at levels noticeably below those that prevailed before the financial crisis (figure 46). A decline in pre-provision net revenue was about offset by a further reduction in loan loss provisions, which presumably reflected the improvement in most measures of the quality of banks' assets.12 However, net charge-offs exceeded provisions for the fifth consecutive quarter, and loan loss reserves remained low relative to delinquent loans and charge-offs. Net interest margins slid a bit, while a decline in banks' income from deposit fees was offset by gains in income from trading activities. About 50 of the roughly 6,500 banks in the United States failed in the first half of the year, fewer than the approximately 70 failures in the second half of 2010.
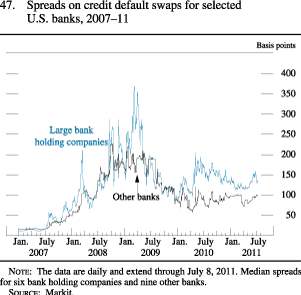
Indicators of credit quality at commercial banks improved in the first quarter of 2011; the overall delinquency rate on loans held by such banks fell somewhat and charge-off rates declined. Median spreads on CDS written on banking institutions, which reflect investors' assessments of and willingness to bear the risk that those institutions will default on their debt obligations, were about unchanged, on net, for a group of six of the largest banks and slightly narrower for a group of nine other banks (figure 47). CDS spreads for foreign banking organizations with a presence in U.S. markets widened some, owing to concerns about developments in Europe and the organizations' exposures to sovereign European debt.
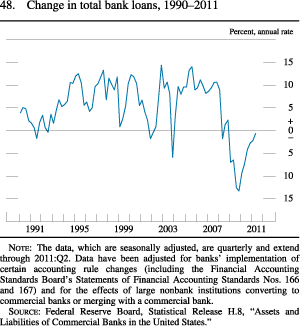
Credit provided by domestic banks and the U.S. branches and agencies of foreign banks decreased slightly further in the first half of this year, as banks' holdings of securities were about flat and an increase in C&I loans to businesses was more than offset by declines in real estate loans and consumer loans (figure 48). C&I loan balances rose vigorously over the first half of the year; most of this increase was concentrated at large domestic banks and branches and agencies of foreign banks, consistent with the easing of credit conditions for large corporate borrowers seen in other credit markets. In contrast, available proxies for lending to small businesses continued to suggest considerable weakness, likely reflecting constraints on both the demand for, and the supply of, such credit. CRE loans contracted sharply, especially those funding construction and land development activities. On the household side, banks' holdings of closed-end residential mortgages declined as banks sold large quantities of such loans to the GSEs. Moreover, originations trailed off with the end of the refinancing wave that occurred last fall, when interest rates declined in anticipation of the Federal Reserve's second round of large-scale asset purchases. Bank lending through home equity lines also remained extraordinarily weak, reflecting in part tight lending standards amid declines in home prices that cut further into home equity. Both credit card and other consumer loans from banks contracted, on balance, over the first half of the year, albeit at a much slower pace in the second quarter than in the first. Banks' holdings of securities were little changed over the first half of the year, as an increase in holdings of agency MBS was about offset by declines in holdings of Treasury and other securities.
Regulatory capital ratios of bank holding companies rose further as large institutions prepared to meet future requirements that are expected to be more stringent than those currently in place. The Basel III framework agreed to by the governors and heads of supervision of countries represented on the Basel Committee on Banking Supervision will raise required capital ratios, tighten the definition of regulatory capital, and increase the risk weights assigned to some assets and off-balance-sheet exposures. The Basel III framework will also strengthen banks' liquidity requirements. In addition, the Basel Committee is expected to release later this summer a proposal to require that global systemically important banks hold additional capital to reduce the potential economic and financial effect of the failure of such banks. This proposal would be consistent with the requirement of the Dodd–Frank Wall Street Reform and Consumer Protection Act that bank holding companies with more than $50 billion in assets be subject to additional capital and liquidity requirements.
Monetary Aggregates and the Federal Reserve's Balance Sheet
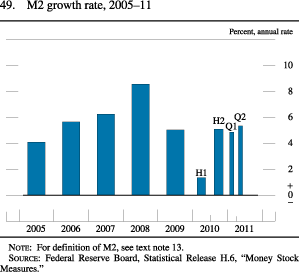
The M2 monetary aggregate expanded at a moderate annual rate of 5 percent in the first half of 2011 (figure 49).13 Liquid deposits, the largest component of M2, continued to rise at a solid pace, while investors extended their reallocation away from other lower-yielding M2 assets. Balances held in small time deposits and retail money market mutual funds contracted to their lowest levels since 2005 as their yields remained extremely low. The currency component of the money stock increased at an annual rate of 10 percent in the first half of the year, likely driven by both further strong demand from abroad and solid domestic demand. The monetary base--which is roughly equal to the sum of currency in circulation and the reserve balances of depository institutions held at the Federal Reserve--increased rapidly in the first half of the year, reflecting an expansion of reserve balances that resulted from the Federal Reserve's longer-term security purchase program and a reduction in the Treasury Department's Supplementary Financing Account as well as the strong increase in currency.
The size of the Federal Reserve's balance sheet rose to $2.9 trillion as of July 6, 2011, about $450 billion more than at the end of 2010 (table 1). Holdings of Treasury securities rose more than $600 billion for the year to date as a result of the FOMC's decisions to reinvest the proceeds from paydowns of agency debt and agency MBS in longer-term Treasury securities, announced at the August 2010 FOMC meeting, and to purchase an additional $600 billion of longer-term Treasury securities by the end of the second quarter of 2011, announced at the November 2010 FOMC meeting. In contrast, holdings of agency debt and agency MBS declined about $115 billion as securities either matured or experienced principal prepayments related to mortgage refinancing activity.
1. Selected components of the Federal Reserve balance sheet, 2010-11
| Balance sheet item | Dec. 29, 2010 | July 6, 2011 |
|---|---|---|
| Total assets | 2,423,457 | 2,874,049 |
| Selected assets | ||
| Credit extended to depository institutions and dealers | ||
| Primary credit | 58 | 5 |
| Central bank liquidity swaps | 75 | 0 |
| Credit extended to other market participants | ||
| Term Asset-Backed Securities Loan Facility (TALF) | 24,704 | 12,488 |
| Net portfolio holdings of TALF LLC | 665 | 757 |
| Support of critical institutions | ||
| Net portfolio holdings of Maiden Lane LLC, Maiden Lane II LLC, and Maiden Lane III LLC 1 | 66,312 | 59,637 |
| Credit extended to American International Group, Inc. | 20,282 | ... |
| Preferred interests in AIA Aurora LLC and ALICO Holdings LLC | 26,057 | ... |
| Securities held outright | ||
| U.S. Treasury securities | 1,016,102 | 1,624,515 |
| Agency debt securities | 147,460 | 115,070 |
| Agency mortgage-backed securities (MBS) 2 | 992,141 | 908,853 |
| Total liabilities | 2,366,855 | 2,822,382 |
| Selected liabilities | ||
| Federal Reserve notes in circulation | 943,749 | 990,861 |
| Reverse repurchase agreements | 59,246 | 67,527 |
| Deposits held by depository institutions | 1,025,839 | 1,663,022 |
| Of which: Term deposits | 5,113 | 0 |
| U.S. Treasury, general account | 88,905 | 67,270 |
| U.S. Treasury, Supplementary Financing Account | 199,963 | 5,000 |
| Total capital | 56,602 | 51,667 |
Note: LLC is a limited liability company.
1. The Federal Reserve has extended credit to several LLCs in conjunction with efforts to support critical institutions. Maiden Lane LLC was formed to acquire certain assets of The Bear Stearns Companies, Inc. Maiden Lane II LLC was formed to purchase residential mortgage-backed securities from the U.S. securities lending reinvestment portfolio of subsidiaries of American International Group, Inc. (AIG). Maiden Lane III LLC was formed to purchase multisector collateralized debt obligations on which the Financial Products group of AIG has written credit default swap contracts. Return to table
2. Includes only MBS purchases that have already settled. Return to table
... Not applicable.
Source: Federal Reserve Board, Statistical Release H.4.1, "Factors Affecting Reserve Balances of Depository Institutions and Condition Statement of Federal Reserve Banks."
Use of regular discount window lending facilities, such as the primary credit facility, continued to be minimal. Loans outstanding under the Term Asset-Backed Securities Loan Facility (TALF) declined from $25 billion at the end of 2010 to $12 billion in mid-2011 as improved conditions in securitization markets resulted in prepayments of loans made under the facility. The facility, which was established to assist financial markets in accommodating the credit needs of consumers and businesses by facilitating the issuance of ABS collateralized by a variety of consumer and business loans, was closed to new lending in June 2010. All remaining TALF loans are current on their payments and will mature no later than March 30, 2015.
In the first half of this year, the Federal Reserve reduced some of its exposures from lending facilities established during the financial crisis to support specific institutions. On January 14, 2011, in conjunction with the closing of a recapitalization plan that terminated the Federal Reserve's assistance to American International Group, Inc. (AIG), AIG repaid the credit extended by the Federal Reserve under the revolving credit line, and the Federal Reserve was paid in full for its preferred interests in the special purpose vehicles AIA Aurora LLC and ALICO Holdings LLC. Neither the revolving credit facility nor the preferred interests held in connection with the revolving credit facility generated any loss to the Federal Reserve or taxpayers. The portfolio holdings of Maiden Lane LLC, Maiden Lane II LLC, and Maiden Lane III LLC--entities that were created during the crisis to acquire certain assets from The Bear Stearns Companies, Inc., and AIG to avoid the disorderly failures of those institutions--declined, on net, primarily as a result of principal payments and asset sales. Of note, the Federal Reserve Bank of New York (FRBNY) sold a total of $10 billion in current face value of residential mortgage-backed securities out of the Maiden Lane II portfolio; competitive sales of these securities were conducted through the FRBNY's investment manager.14 The estimated fair values of the portfolios of the three Maiden Lane LLCs continue to exceed the corresponding loan balances outstanding to each limited liability company from the FRBNY.
Only small draws on U.S. dollar liquidity swap arrangements between the Federal Reserve and foreign central banks have been made since their reestablishment in May 2010, and there have been no draws on them since early March of this year.
On the liability side of the Federal Reserve's balance sheet, reserve balances held by depository institutions rose about $640 billion over the first half of the year to $1.7 trillion as of July 6. Federal Reserve notes in circulation rose from $944 billion to $991 billion. The Treasury reduced the balance in its Supplementary Financing Account at the Federal Reserve to $5 billion early in the year as part of its efforts to maximize flexibility in its debt management as the statutory debt limit approached. Balances in the Treasury's general account at the Federal Reserve also declined. Reverse repurchase agreements executed with foreign official and international accounts were generally steady. As part of its ongoing program to expand the range of tools available to drain reserves, the Federal Reserve conducted three 28-day, $5 billion auctions of term deposits to depository institutions as well as a series of small-scale, real-value triparty reverse repurchase operations with eligible primary dealer and money market fund counterparties.
On March 22, the Federal Reserve System released audited financial statements for 2010 for the combined Federal Reserve Banks, the 12 individual Reserve Banks, the limited liability companies that were created to respond to strains in financial markets, and the Board of Governors. The Reserve Banks reported comprehensive income of close to $82 billion for the year ending December 31, 2010, an increase of $28 billion from 2009. The increase was attributable primarily to interest earnings on the Federal Reserve's holdings of agency debt and MBS, acquired largely in 2009. The Reserve Banks transferred $79 billion of the $82 billion in comprehensive income to the U.S. Treasury in 2010, a record high and $32 billion more than was transferred in 2009.
International Developments
In the first half of the year, developments abroad have largely been dominated by several shocks, including the political turmoil in the MENA region, a major earthquake and tsunami in Japan, heightened fiscal stresses in Europe, and swings in commodity prices. In the face of these shocks, global financial markets were fairly resilient and foreign economic activity held up. Foreign real GDP accelerated in the first quarter, most notably in the EMEs, where performance has continued to outpace that in the advanced foreign economies (AFEs). Recent data indicate that foreign economic growth slowed in the second quarter, but the recovery from the global recession continued.International Financial Markets
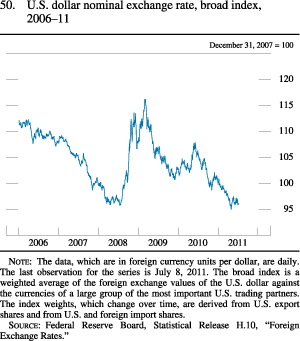
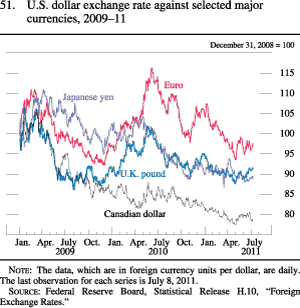
Spurred in part by monetary policy tightening abroad and fears that the pace of economic recovery in the United States was slowing, the foreign exchange value of the dollar declined over much of the first half of the year (figure 50). The lower level of the dollar is consistent with a weakening of the safe-haven demands that had boosted it during the global financial crisis; however, the dollar has moved slightly higher since May on heightened concerns over the fiscal problems in Europe and uncertainties about global economic growth. On net, the dollar is about 3-3/4 percent lower on a trade-weighted basis against a broad set of currencies over the first half of the year. Following Japan's earthquake, as traders anticipated that Japanese investors would need to repatriate funds, the yen appreciated sharply, reaching a record high versus the dollar (figure 51). In response, the Group of Seven (G-7) countries conducted coordinated sales of yen in the foreign exchange markets on March 18. The yen more than reversed its steep appreciation immediately following the intervention.
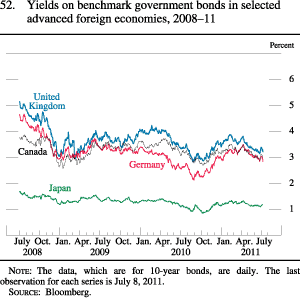
Ten-year sovereign yields in the AFEs generally rose early in the year on expectations that continued economic recovery and greater inflationary pressures would prompt monetary policy tightening. However, since April, yields have begun to retreat (figure 52). On net, yields for Germany, Canada, and the United Kingdom are down slightly from the end of last year.
Fiscal and financial stresses worsened in Greece, Portugal, and Ireland over the first half of the year, with the major credit rating agencies downgrading significantly these countries' sovereign credit ratings. The spreads of yields on Greek, Portuguese, and Irish bonds over those on German bonds soared as market confidence in the ability of these three countries to meet their fiscal obligations diminished (figure 53). Following a €78 billion rescue package by the EU and the International Monetary Fund (IMF) in early May, spreads for Portuguese bonds stabilized but soon rose again amid the high-profile discussions by European officials on a possible restructuring of Greek debt. In late June, Greece approved a new austerity and privatization package, opening the door for approval of a €12 billion EU–IMF disbursement needed to meet upcoming payments. Although spreads for Greek, Portuguese, and Irish bonds declined some following these developments, they have since risen as Moody's Investors Service downgraded Portugal's sovereign debt rating to junk status and EU officials continued to seek commitments from private creditors to roll over maturing Greek debt. Movements in spreads for the sovereign debts of Italy and Spain have been more muted, but they have moved up in recent months.
Equity prices in the AFEs generally continued to rise through the first few months of this year, falling sharply after Japan's earthquake on March 11 but, outside of Japan, recouping their losses afterward. By early May, increased uncertainties about global economic growth and heightened concerns over the sovereign debt problems in Europe prompted a pullback in equity prices. However, the passage of Greece's austerity and privatization legislations in late June, which assuaged market concerns about an imminent Greek default, prompted some renewed demand for risky assets; equity prices in most of the AFEs were, on net, at about their levels at the start of the year (figure 54). In the EMEs, equity prices had also risen early in the year, but, as in the AFEs, they began to pull back by early May. On net, over the first half of the year, equity prices are down in Latin America but are up in emerging Asia (figure 55).
Bank stock prices in Europe have declined nearly 9 percent since the start of the year. CDS premiums for European banks remained significantly higher than those of nonfinancial firms with similar credit ratings. European banks experienced large losses during the global financial crisis, and their lending exposure to Greece, Ireland, and other vulnerable European economies remains a concern. In addition, some banks in the core European countries, such as France and Germany, still have considerable dollar funding needs. Most peripheral European banks have only limited access to market funding and have relied on ECB funding instead. In Japan, banks have not experienced crisis-related losses nearly as large as those incurred by European institutions, but Japanese bank profits have been persistently weaker, reflecting the fragile state of Japan's economy.
The newly created European Banking Authority is in the process of completing an EU-wide stress test of large European banks. The methodology used in this year's test is broadly similar to that of the stress tests conducted by the Committee of European Banking Supervisors last year. The results of the stress test are expected to be released on July 15 of this year. In anticipation of the test, some European banks took steps to raise additional capital in recent months.
The Financial Account
Net purchases of U.S. securities by foreign private investors slowed in the first quarter from the pace of 2010, in part because of reduced safe-haven demand for U.S. Treasury securities. Foreign investors, on net, sold both U.S. agency and corporate bonds in the first quarter, in contrast to purchases of these securities in the second half of last year, but they continued to make large purchases of U.S. equities (figure 56). U.S. investors increased the pace of their purchases of foreign securities, especially foreign equities (figure 57).
Banks located in the United States registered strong net inflows from abroad in the first quarter following small net inflows in the fourth quarter of last year. These recent net inflows primarily reflect increased net borrowing from affiliated banking offices abroad and are in marked contrast to sizable net lending abroad from U.S. banks in the first half of 2010, when dollar funding pressures in European interbank markets had contributed to increased reliance on funding from U.S. counterparties (figure 58).
Inflows from foreign official investors eased somewhat in late 2010 and continued at a moderate pace in the first quarter this year. Such inflows continued to come primarily from countries seeking to counteract upward pressure on their currencies by purchasing U.S. dollars in foreign currency markets. These countries then used the proceeds to acquire U.S. assets, mainly Treasury and U.S. agency securities. Available data through May indicate that foreign official inflows slowed a bit further in the second quarter.
Advanced Foreign Economies
The pace of economic recovery in the AFEs picked up in early 2011 following a soft patch in the second half of 2010, but performance was uneven across countries. Real GDP rose at a solid pace in the first quarter in Canada, boosted by a surge in investment. In the euro area, economic activity was strong in Germany and France but remained generally weak in the peripheral countries, as concerns about sovereign debt sustainability continued to weigh on economic growth. In the United Kingdom, output rebounded in the first quarter of this year from a contraction in the fourth quarter of 2010, but the pace was restrained by declines in households' real incomes as inflation increased. Japan's economic activity was also bouncing back from its dip in the fourth quarter of last year until the earthquake and ensuing tsunami and nuclear disaster caused first-quarter real GDP to contract sharply.
The disaster in Japan damaged production facilities, disrupted supply chains, and reduced electricity generation capacity. In addition, spending on consumer durables and capital investment fell sharply, reflecting a substantial slump in consumer and business confidence. The Japanese authorities responded swiftly to support the economy. The Bank of Japan injected record amounts of liquidity into money markets, doubled the size of its asset purchase program to ¥10 trillion, set up a ¥1 trillion loan program for firms in disaster-hit areas, and expanded by ¥500 billion the funds for an existing program aimed at supporting economic growth. The Japanese Diet approved a ¥4 trillion supplementary budget to fund the construction of temporary housing, the restoration of damaged infrastructure, and the provision of low-interest loans to small businesses. Japan also requested a coordinated intervention of G-7 countries' central banks in foreign exchange markets to stem the appreciation of the yen. Supported by the various official actions, the financial system continued to operate smoothly and reconstruction activity has begun, setting the stage for an economic recovery in the second half of the year.
Supply disruptions due to the Japanese earthquake weighed on economic growth in other AFEs, and other incoming data corroborate that economic activity in the AFEs slowed in the second quarter. The composite purchasing managers indexes have moved lower in recent months across the AFEs. In addition, business confidence has turned down, and the underlying momentum in consumer spending has remained weak in the euro area.
A surge in energy and food prices and, in some cases, higher value-added taxes lifted headline inflation rates in the major foreign economies earlier in the year (figure 59). Twelve-month headline inflation rose to 4-1/2 percent in the United Kingdom and to about 3-3/4 percent and 2-3/4 percent in Canada and the euro area, respectively. In Japan, the rise in commodity prices pushed inflation above zero. Excluding the effects of commodity price movements and tax changes, inflation in the AFEs has remained relatively subdued amid considerable economic resource slack. With the recent pullback in commodity prices, overall inflation also appears to be stabilizing.
Monetary policy remained accommodative in all the major AFEs, and market participants appear to expect only gradual tightening (figure 60). After having kept its benchmark policy rate at 1 percent since May 2009, the ECB raised it twice--by 25 basis points in April and by another 25 basis points in early July--citing upside risks to the inflation outlook. The Bank of Canada, which began to tighten last year, has paused so far this year, maintaining its target for the overnight rate at 1 percent. The Bank of England kept its policy rate at 0.5 percent and the size of its Asset Purchase Facility at £200 billion.
Emerging Market Economies
The EMEs continued to expand at a strong pace in the first quarter of 2011, boosted by both exports and domestic demand. Exports were lifted by sustained global demand. Domestic demand was supported by macroeconomic policies that remained generally accommodative despite recent tightening and by robust household income amid strong labor market conditions. Recent data indicate that growth moderated in the second quarter, but to a still-solid pace, reflecting governments' policies to cool the economies that were running unsustainably fast, a deceleration in activity in the advanced economies, and spillover effects of the Japanese earthquake.
The Chinese economy expanded at a strong pace in the first half of 2011, although economic growth slowed a bit compared with the second half of last year, largely due to measures by authorities to rein in the economy. Headline consumer prices were up 6.4 percent in June from a year earlier, led by a rise in food prices. This year, Chinese authorities have raised required reserve ratios for all banks 300 basis points--the requirement for large banks now stands at 21.5 percent. Authorities have also raised the benchmark one-year bank lending rate 3/4 percentage point. Over the first half of the year, the Chinese renminbi has appreciated, on net, about 2-1/2 percent against the dollar. However, on a real multilateral, trade-weighted basis, which gauges the renminbi's value against the currencies of China's major trading partners and adjusts for differences in inflation rates, the renminbi has depreciated. Nonetheless, strong domestic demand led import growth in the first half of this year to exceed export growth, and consequently, China's trade surplus narrowed.
Elsewhere in emerging Asia, the vigorous Chinese economy provided impetus to exports for several countries, and domestic demand was also robust. Accordingly, economic activity was upbeat in the first quarter, with several countries, including Hong Kong, Singapore, and Taiwan, all posting double-digit annualized growth rates. Economic activity was also upbeat in India. Available indicators for the second quarter suggest that the pace of expansion slowed but remained solid.
In Mexico, a country with stronger economic linkages to the United States than most EMEs, performance continued to lag that of other EMEs. Reported first-quarter real GDP rose at an annual rate of only 2 percent. By contrast, first-quarter real GDP rose robustly in Brazil and in other South American countries, supported by generally accommodative macroeconomic policies and the tailwind from gains in commodity prices.
Higher food prices pushed up consumer price inflation in the EMEs earlier in the year. As food price pressures subsequently eased, 12-month inflation stabilized and began to retreat in several countries. In the midst of elevated inflation and strong economic growth, the stance of macroeconomic policy in the EMEs has been tightened further to mitigate the risks of overheating. In the first half of the year, many EMEs tightened monetary policy by raising policy rates and reserve requirement ratios several times, and progress was also made on the removal of the fiscal support measures enacted at the height of the global financial crisis.
Footnotes
2. A mortgage is defined as seriously delinquent if the borrower is 90 days or more behind in payments or the property is in foreclosure. Return to text
3. The Federal Reserve, the Office of the Comptroller of the Currency, the Office of Thrift Supervision, and the Federal Deposit Insurance Corporation conducted an in-depth interagency review of practices at the largest mortgage servicing operations to examine foreclosure practices generally, but with an emphasis on the breakdowns that led to inaccurate affidavits and other questionable legal documents being used in the foreclosure process. The review found, among other things, critical weaknesses in foreclosure-governance practices, foreclosure-documentation processes, and oversight and monitoring of third-party law firms and other vendors. Based on the findings from the review, the agencies issued enforcement actions by consent against 14 mortgage servicers in April 2011 to address the significant deficiencies in mortgage-servicing and foreclosure practices. See Board of Governors of the Federal Reserve System (2011), "Federal Reserve Issues Enforcement Actions Related to Deficient Practices in Residential Mortgage Loan Servicing and Foreclosure Processing," press release, April 13, www.federalreserve.gov/newsevents/press/enforcement/20110413a.htm; and Board of Governors of the Federal Reserve System (2011), "Statement for the Record: On Mortgage Servicing," testimony submitted to the Subcommittees on Financial Institutions and Consumer Credit and on Oversight and Investigations, Committee on Financial Services, U.S. House of Representatives, Washington, July 7, www.federalreserve.gov/newsevents/testimony/statement20110707a.htm. Return to text
4. The SLOOS is available on the Federal Reserve Board's website at www.federalreserve.gov/boarddocs/SnLoanSurvey. Return to text
5. The Credit Card Act includes some provisions that place restrictions on issuers' ability to impose certain fees and to engage in risk-based pricing. Return to text
6. Issued by the Financial Accounting Standards Board (FASB), Statements of Financial Accounting Standards Nos. 166 (Accounting for Transfers of Financial Assets, an Amendment of FASB Statement No. 140) and 167 (Amendments to FASB Interpretation No. 46(R)) became effective at the start of a company's first fiscal year beginning after November 15, 2009, or, for companies reporting earnings on a calendar-year basis, after January 1, 2010. The amendments required many credit card issuers to bring securitizations onto their balance sheets and therefore to hold more capital against them. Return to text
7. The SCOOS is available on the Federal Reserve Board's website at www.federalreserve.gov/econresdata/releases/scoos.htm. Return to text
8. On May 16, the Secretary of the Treasury declared a "debt issuance suspension period" for the Civil Service Retirement and Disability Fund, permitting the Treasury to redeem a portion of existing Treasury securities held by that fund as investments and to suspend issuance of new Treasury securities to that fund as investments. The Treasury also began suspending some of its daily reinvestment of Treasury securities held as investments by the Government Securities Investment Fund of the Federal Employees' Retirement System Thrift Savings Plan. Return to text
9. The Build America Bond program, authorized under the ARRA, allowed state and local governments to issue taxable bonds for capital projects and receive a subsidy payment from the Treasury for 35 percent of interest costs. Return to text
10. When interest rates are close to zero, determining the point at which financial market quotes indicate that the federal funds rate will move above its current range can be challenging. The path described in the text is the mean of a distribution calculated from derivatives contracts on federal funds and Eurodollars. The asymmetry induced in this distribution by the zero lower bound causes the mean to be influenced strongly by changes in uncertainty regarding the policy path, complicating the interpretation of the expected path. Alternatively, one can use similar derivatives to calculate the most likely, or "modal," path of the federal funds rate, which tends to be more stable. This alternative measure has also moved down, on net, since the beginning of the year, but it suggests a flatter overall trajectory for the target federal funds rate, according to which the effective rate does not rise above its current target range until the second half of 2013. Return to text
11. On April 1, 2011, the Federal Deposit Insurance Corporation implemented changes to its deposit insurance assessment system that broadened the definition of the assessment base and altered assessment rates, especially for large banks. Under the new system, insurance premiums are based on an insured depository institution's total assets less tangible capital--essentially all liabilities--rather than domestic deposits. The new assessment rate schedule continued to assign higher assessment rates to banks that pose greater risks to the insurance system. In the aggregate, the changes in the assessment system were intended to be revenue neutral. Return to text
12. Pre-provision net revenue is the sum of net interest income and noninterest income less noninterest expense. Return to text
13. M2 consists of (1) currency outside the U.S. Treasury, Federal Reserve Banks, and the vaults of depository institutions; (2) traveler's checks of nonbank issuers; (3) demand deposits at commercial banks (excluding those amounts held by depository institutions, the U.S. government, and foreign banks and official institutions) less cash items in the process of collection and Federal Reserve float; (4) other checkable deposits (negotiable order of withdrawal, or NOW, accounts and automatic transfer service accounts at depository institutions; credit union share draft accounts; and demand deposits at thrift institutions); (5) savings deposits (including money market deposit accounts); (6) small-denomination time deposits (time deposits issued in amounts of less than $100,000) less individual retirement account (IRA) and Keogh balances at depository institutions; and (7) balances in retail money market mutual funds less IRA and Keogh balances at money market mutual funds. Return to text
14. Current face value is the remaining principal balance of the mortgage assets underlying the securities, after prepayments and amortizations. Return to text

