Annual Report 2015
Monetary Policy and Economic Developments
As required by section 2B of the Federal Reserve Act, the Federal Reserve Board submits written reports to the Congress that contain discussions of "the conduct of monetary policy and economic developments and prospects for the future." The Monetary Policy Report, submitted semiannually to the Senate Committee on Banking, Housing, and Urban Affairs and to the House Committee on Banking and Financial Services, is delivered concurrently with testimony from the Federal Reserve Board Chair.
The following discussion is a review of U.S. monetary policy and economic developments in 2015, excerpted from the Monetary Policy Report published in February 2016 and July 2015. Those complete reports are available on the Board's website at www.federalreserve.gov/monetarypolicy/files/20160210_mprfullreport.pdf (February 2016) and www.federalreserve.gov/monetarypolicy/files/20150715_mprfullreport.pdf (July 2015).
Other materials in this annual report related to the conduct of monetary policy can be found in section 9, "Minutes of Federal Open Market Committee Meetings," and section 11, "Statistical Tables" (see tables 1-4).
Monetary Policy Report February 2016
Summary
Labor market conditions continued to improve during the second half of 2015 and into early 2016. Payroll employment has increased at a solid average pace of 225,000 per month since June. The unemployment rate, which had reached a high of 10 percent in late 2009, declined from 5.3 percent last June to 4.9 percent in January. Although the unemployment rate now equals the median of Federal Open Market Committee (FOMC) participants' estimates of its longer-run normal level, other considerations suggest that some further improvement in labor market conditions is needed to achieve the Committee's maximum employment mandate. The labor force participation rate remains somewhat below most assessments of its trend, and an unusually large number of people continue to work part time when they would prefer full-time employment.
Inflation remains below the FOMC's longer-run goal of 2 percent: The price index for personal consumption expenditures (PCE) rose only 1/2 percent over the 12 months ending in December. The PCE price index excluding food and energy items, which often provides a better indication of future inflation, also remained subdued, rising 1-1/2 percent over that period. Inflation has been held down substantially by the drop in energy prices; declines in the prices of non-oil imported goods have contributed as well. Meanwhile, survey-based measures of longer-run inflation expectations have drifted down a little since the middle of last year and generally stand near the lower ends of their historical ranges; market-based measures of inflation compensation have fallen and are at low levels.
Real gross domestic product (GDP) is reported to have increased at an annual rate of about 1-1/4 percent over the second half of the year, slower than the first-half pace. The expansion in economic activity reflected continued increases in private domestic final demand, supported by ongoing job gains and accommodative monetary policy. Government purchases rose modestly. By contrast, the rise in the foreign exchange value of the dollar over the past year and a half and the sluggish pace of economic activity abroad have continued to weigh on exports. In addition, the pace of inventory accumulation slowed markedly from its elevated first-half pace, thereby reducing overall GDP growth in the second half of 2015.
Domestic financial conditions have become somewhat less supportive of economic growth since mid-2015. Recent months have been marked by bouts of turbulence in financial markets that largely reflected concerns about the global economic outlook and developments in oil markets. Broad measures of U.S. equity prices have declined, on net, roughly returning these indexes to levels that prevailed during the first half of 2014. And the dollar has strengthened further, on balance, since the summer of 2015. Corporate risk spreads have widened, particularly for lower-rated issuers. Nonetheless, interest rates for investment-grade issuers are generally still low, reflecting declines in yields on longer-term Treasury securities. Moreover, although debt issuance by lower-rated firms has slowed, credit flows to nonfinancial businesses have remained solid since the middle of last year, supported by continued strong bond issuance of higher-rated firms and by bank lending. Household access to credit was mixed, with mortgages and credit cards still difficult to access for some borrowers while student and auto loans remained broadly available, even to borrowers with lower credit scores. Overall, debt growth in the household sector has remained modest and continues to be concentrated among borrowers with strong credit histories.
The U.S. financial system overall has been resilient to the stresses that have emerged since mid-2015, and financial vulnerabilities remain moderate. Regulatory capital ratios and holdings of liquid assets at large banking firms are at historically high levels. Usage of short-term wholesale funding in the financial system is relatively low, and the use of leverage to finance securities purchases has declined somewhat. The ratio of aggregate private nonfinancial credit to GDP is below most estimates of its long-run trend, although leverage of speculative-grade nonfinancial corporations has risen further since the middle of last year and is relatively high. Risk premiums for many asset classes have increased. For instance, the rise in spreads on corporate debt has been larger than would be expected given the evolution of expected defaults. The direct exposures of the largest U.S. banking firms to the oil sector and to emerging market economies are limited. If conditions in those sectors worsen, however, wider stresses could emerge and be transmitted to the United States through indirect global financial linkages.
In December, after holding the federal funds rate near zero for seven years, the FOMC raised the target range for that rate to 1/4 to 1/2 percent. The decision to increase the federal funds rate reflected the Committee's assessment that there had been considerable improvement in the labor market last year and that the Committee was reasonably confident that inflation would move back to 2 percent over the medium term; thus, the criteria set out by the Committee in March 2015 had been met.
The Committee anticipates that economic conditions will evolve in a manner that will warrant only gradual increases in the federal funds rate. This expectation is consistent with the view that the neutral nominal federal funds rate--defined as the value of the federal funds rate that would be neither expansionary nor contractionary if the economy was operating at its productive potential--is currently low by historical standards and is likely to rise only gradually over time, as headwinds to economic growth dissipate slowly and as inflation rises toward the Committee's goal of 2 percent. Consistent with this outlook, in the most recent Summary of Economic Projections (SEP), which was compiled at the time of the December FOMC meeting, FOMC participants projected that the appropriate level of the federal funds rate would be below its longer-run level through 2018. (The December SEP is included as Part 3 of the February 2016 Monetary Policy Report on pages 35-48; it is also included in section 9 of this annual report.)
With respect to its securities holdings, the Committee will continue to reinvest principal payments from its securities portfolio, and it expects to maintain this reinvestment policy until normalization of the level of the federal funds rate is well under way. This policy, by keeping the Committee's holdings of longer-term securities at sizable levels, should help maintain accommodative financial conditions.
The Committee has emphasized that the actual path of monetary policy will depend on how incoming data affect the economic outlook. In determining the timing and size of future adjustments to the target range of the federal funds rate, the Committee will assess realized and expected economic conditions relative to its objectives of maximum employment and 2 percent inflation. Stronger growth or a more rapid increase in inflation than the Committee currently anticipates would likely call for faster increases in the federal funds rate; conversely, if conditions prove weaker, a lower path of the federal funds rate would likely be appropriate.
To move the federal funds rate into the new target range announced in December, the Federal Reserve raised the rate of interest paid on required and excess reserve balances and also employed an overnight reverse repurchase agreement facility. The effective federal funds rate was moved successfully into the increased target range. The FOMC remains confident that it has the tools it needs to adjust short-term interest rates as appropriate.
Part 1: Recent Economic and Financial Developments
The labor market continued to improve during the second half of last year and early this year. Payroll employment has increased 225,000 per month, on average, since June. The unemployment rate fell from 5.3 percent in June to 4.9 percent in January and thus has reached the median estimate among Federal Open Market Committee (FOMC) participants of the level of unemployment that is considered to be normal in the longer run. Even so, the relatively low labor force participation rate and the unusually large number of people working part time who would prefer full-time employment suggest that some cyclical weakness is still present in the labor market. Since mid-2014, a steep drop in crude oil prices has exerted significant downward pressure on overall inflation, and declines in the prices of non-oil imported goods have held down inflation as well. The price index for personal consumption expenditures (PCE) increased only 1/2 percent during the 12 months ending in December, a rate that is well below the FOMC's longer-run objective of 2 percent; the index excluding food and energy prices rose 1-1/2 percent over the same period. Both survey- and market-based measures of inflation expectations have moved down since June. Meanwhile, real gross domestic product (GDP) increased at an annual rate of 1-1/4 percent over the second half of 2015, slower than in the first half. The growth in GDP has been supported by accommodative monetary policy, favorable consumer confidence, and the boost to household purchasing power from lower oil prices. However, lower oil prices have also exerted downward pressure on domestic investment in the energy sector. In addition, sluggish growth abroad and the higher foreign exchange value of the dollar have weighed on exports, and financial conditions more generally have become somewhat less supportive of economic growth. Concerns about economic conditions abroad and the energy sector have contributed to lower equity prices and higher borrowing rates for some businesses.
Domestic Developments
The labor market has continued to improve . . .
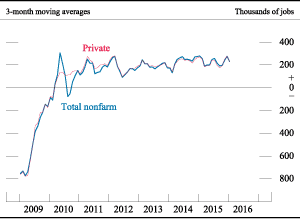
Labor market conditions strengthened further across a variety of dimensions over the second half of 2015 and early this year. Payroll employment gains remained robust, averaging about 235,000 per month over the second half of last year, similar to the gains over the first half; factoring in the January increase of about 150,000, monthly gains since June have averaged about 225,000 (figure 1). The increase in 2015 followed an even faster pace of job gains in 2014, and, in total, some 5-3/4 million jobs were added over the two years. In addition, the unemployment rate--which had reached 10 percent in late 2009--declined from 5.3 percent in June 2015 to 4.9 percent in January of this year; this level is 3/4 percentage point lower than a year earlier and is equal to the median of FOMC participants' estimates of its longer-run normal level (figure 2). Broader measures of labor underutilization, such as those including individuals who are classified as marginally attached to the labor force, declined by similar amounts. (A "marginally attached" individual is defined as someone who is not looking for work currently and therefore treated as not in the labor force, but who wants and is available for work and has looked for a job in the past 12 months.)
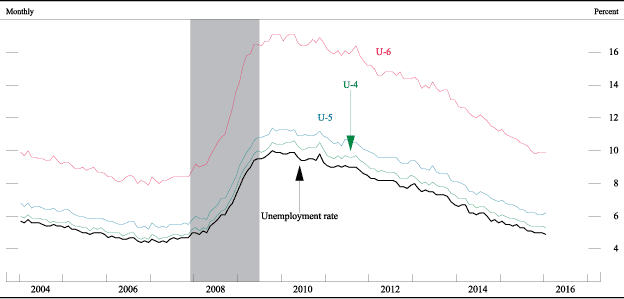
Note: U-4 measures total unemployed plus discouraged workers, as a percent of the labor force plus discouraged workers. Discouraged workers are a subset of marginally attached workers who are not currently looking for work because they believe no jobs are available for them. U-5 measures total unemployed plus all marginally attached to the labor force, as a percent of the labor force plus persons marginally attached to the labor force. Marginally attached workers are not in the labor force, want and are available for work, and have looked for a job in the past 12 months. U-6 measures total unemployed plus all marginally attached workers plus total employed part time for economic reasons, as a percent of the labor force plus all marginally attached workers. The shaded bar indicates a period of business recession as defined by the National Bureau of
Economic Research.
Source: Department of Labor, Bureau of Labor Statistics.
. . . though some labor market slack likely remains . . .
While payroll employment and the unemployment rate have improved further since mid-2015, the labor force participation rate fell from an average of 62.7 percent of the working-age population during the second quarter of 2015 to 62.5 percent in the fourth quarter; the participation rate moved back up to 62.7 percent in January. Changing demographics--most notably the increasing share of older people in the population, who are less likely to be in the labor force--and other longer-run structural changes in the labor market have continued to push down the participation rate even as cyclical forces have been pushing it up. That said, labor force participation appears to remain a little weaker than can be explained by structural factors alone, pointing to the likelihood that some slack remains in this dimension of labor utilization. In addition, although the share of workers who are employed part time but would like to work full time has fallen noticeably since June, it is still relatively high, indicating some scope for improvement on this dimension as well.
. . . while labor compensation has shown some tentative signs of accelerating . . .
As the labor market has continued to improve, the rates of increase in some measures of hourly labor compensation have begun to pick up while others remain relatively subdued. For example, average hourly earnings for all employees increased 2-1/2 percent over the 12 months ending in January, above the 2 percent pace seen throughout most of the recovery. In addition, compensation per hour in the business sector--a volatile measure derived from the labor compensation data in the national income and product accounts, or NIPA--is reported to have increased more quickly in 2015 than its average pace throughout most of the recovery. In contrast, the employment cost index for private industry workers, which measures both wages and the cost to employers of providing benefits, increased about 2 percent over the 12 months ending in December, similar to the pace seen throughout most of the recovery. All of these measures of compensation are increasing at slower rates than those seen prior to the recession. This deceleration probably reflects a variety of factors, including the slower growth of productivity, the slower pace of inflation, and perhaps some remaining slack in the labor market. Despite the continued relatively small increases in nominal wages, the recent very low inflation led to a noticeably larger wage gain last year on a purchasing-power-adjusted (or so-called real) basis than had been evident earlier in the expansion.
. . . and productivity growth has been lackluster
Over time, increases in productivity are a key determinant of the rise in real wages and living standards. Labor productivity in the business sector increased at an annual rate of just 1/2 percent in 2015 and at an average annual rate of just 1 percent since the last business cycle peak in 2007. The average pace since 2007 is a little below the 1974-95 average and well below the pace during the period from the mid-1990s to 2007. The reasons behind the slower productivity performance in recent years are not well understood, but one factor seems to be the slower pace of capital accumulation.
Falling oil prices continue to hold down overall consumer prices . . .
Consumer price increases have remained muted and below the FOMC's longer-run objective of 2 percent. As discussed in the box "Effects of Movements in Oil Prices and the Dollar on Inflation" on pages 8-9 of the February 2016 Monetary Policy Report, crude oil prices have plummeted since June 2014, and the dollar has moved appreciably higher; both factors have contributed importantly to the low inflation readings of the past year.
Since July, the price of crude oil has fallen appreciably further, on net, with the spot price of Brent crude oil dropping below $35 per barrel, a level last seen more than a decade ago (the blue line in figure 3). Futures prices have also dropped significantly and indicate that market participants expect only modest price increases over the next few years. Although concerns about global growth have contributed to the fall in prices, much of the recent decline can be attributed to the abundance of global supply. Reductions in U.S. production have been slower and smaller than expected, and OPEC has abandoned its official production target in favor of maintaining robust production despite declining prices and the likely increase in Iranian oil exports in the coming months. The drop in crude oil prices continues to pass through to gasoline prices: The national average of retail gasoline prices (on a seasonally adjusted basis) moved down from more than $2.50 per gallon in June to about $2.00 per gallon in January.
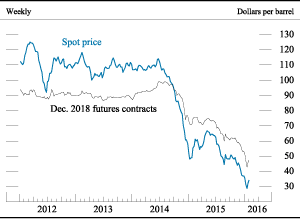
Note: The data are weekly averages of daily data and extend through February 4, 2016.
Source: NYMEX.
Largely because of the decline in energy prices, overall consumer price inflation, as measured by the PCE price index, was running at just 1/4 percent for the 12 months ending in June 2015; the 12-month change remained near that pace until year-end, when it edged up to 1/2 percent as some of the sharpest declines from a year earlier fell out of the 12-month calculation (figure 4).
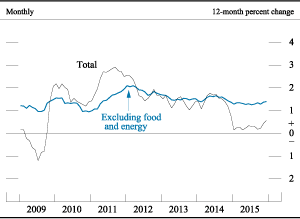
Note: The data extend through December 2015; changes are from one year earlier.
Source: Department of Commerce, Bureau of Economic Analysis.
Food prices were little changed over the past six months after edging down during the first half of 2015. Consumer food prices were held down in 2015 by falling food commodity prices, but futures markets suggest that these commodity prices will flatten out, implying that this source of downward pressure on consumer food price inflation is likely to wane.
. . . but even outside of the energy and food categories, inflation has remained subdued
As is also discussed in the box "Effects of Movements in Oil Prices and the Dollar on Inflation" on pages 8-9 of the February 2016 Monetary Policy Report, another important factor holding down inflation has been the behavior of import prices. After declining sharply in the first half of 2015, non-oil import prices continued to fall in the second half, albeit at a slightly more modest pace; the further declines in the second half reflected lower commodity prices as well as additional increases in the foreign exchange value of the dollar (figure 5). In addition, slack in labor and product markets likely placed downward pressure on inflation, although this factor has probably waned significantly. For all of these reasons, inflation for items other than food and energy (so-called core inflation) remained modest. Core PCE prices rose about 1-1/2 percent over the 12 months ending in December, similar to the increase in 2014.
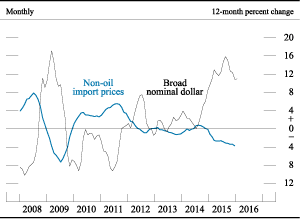
Note: The data for non-oil import prices extend through December 2015.
Source: Department of Labor, Bureau of Labor Statistics; Federal Reserve Board, Statistical Release H.10, "Foreign Exchange Rates."
Survey- and market-based measures of inflation expectations have moved down since June
Wage- and price-setting decisions are likely influenced by expectations for inflation. Survey measures of longer-term inflation expectations have been quite stable over the past 15 years but appear to have moved down some lately, including over the past 6 months, to the lower end of their historical ranges. This decline has occurred both for the measure of inflation expectations over the next 5 to 10 years as reported in the University of Michigan Surveys of Consumers and for the median expectation for the annual rate of increase in the PCE price index over the next 10 years from the Survey of Professional Forecasters, conducted by the Federal Reserve Bank of Philadelphia (figure 6). Market-based measures of medium- (5-year) and longer-term (5-to-10-year-ahead) inflation compensation derived from the difference between yields on nominal Treasury securities and Treasury Inflation-Protected Securities moved down further, on net, over the second half of the year after having declined notably between mid-2014 and mid-2015. Although changes in inflation compensation could reflect changes in expected inflation, they also may reflect a variety of other considerations, including an inflation risk premium, liquidity premiums, and other factors. 1
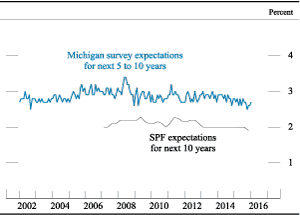
Note: The Michigan survey data are monthly. The SPF data for inflation expectations for personal consumption expenditures are quarterly and extend from 2007:Q1 through 2015:Q4.
Source: University of Michigan Surveys of Consumers; Federal Reserve Bank of Philadelphia, Survey of Professional Forecasters (SPF).
Economic activity expanded at a moderate pace in the second half of 2015
Real GDP is reported to have increased at an annual rate of 1-1/4 percent in the second half of last year, slower than the first-half pace (figure 7). As in the first half of the year, economic activity during the second half was supported by solid gains in private domestic final purchases--that is, final purchases by households and businesses--and by modest increases in government purchases of goods and services. By contrast, aggregate demand continued to be held down by weak export performance, reflecting the rise in the foreign exchange value of the dollar and sluggish foreign economic growth. In addition, inventory investment slowed markedly from its elevated first-half pace, thereby reducing overall GDP growth in the second half of 2015.
Figure 7. Change in real gross domestic product, gross domestic income, and private domestic final purchases
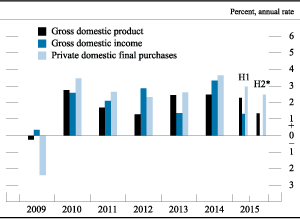
* Gross domestic income is not yet available for 2015:H2.
Source: Department of Commerce, Bureau of Economic Analysis.
Gains in income and wealth are supporting consumer spending . . .
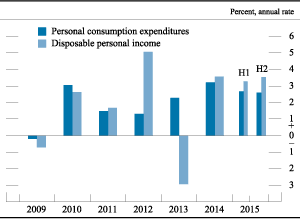
Real personal consumption expenditures rose at an annual rate of 2-1/2 percent in the second half of 2015, about the same as the first-half pace (figure 8). These increases have been supported by income gains from the improving labor market as well as the fall in gasoline and other energy prices, which has bolstered consumers' purchasing power. As a result, real disposable income--that is, income after taxes and adjusted for price changes--rose a robust 3-1/2 percent in 2015 after a similar gain in 2014.
Consumer spending last year was also likely supported by further increases in household net worth. Although the value of corporate equities edged down last year, prices of houses--which are owned much more widely than are corporate equities--posted significant gains, and the wealth-to-income ratio remained elevated relative to its historical average. In nominal terms, national house price indexes are now close to their peaks of the mid-2000s, but relative to rents, house price valuations are much lower than a decade ago.
Coupled with low interest rates, the rise in incomes has lowered debt payment burdens for many households. The household debt service burden--the ratio of required principal and interest payments on outstanding household debt to disposable income, measured for the household sector as a whole--has remained at a very low level by historical standards. As interest rates rise, the debt burden will move up only gradually, as most household debt is in fixed-interest products.
. . . as is credit availability
Consumer credit continued to expand moderately through late 2015, as lending standards for both auto lending and student loans remained accommodative. In addition, credit card lending has been rebounding since early last year. Standards and terms on credit cards are still relatively tight for riskier borrowers, although there has been some modest increase in access for borrowers with subprime credit histories. Delinquencies on credit card and auto loans are still near historical lows, in part due to the tight standards.
Consumer confidence remains high
Household spending has also been supported by favorable consumer sentiment. For the past year or so, the overall index of consumer sentiment from the University of Michigan Surveys of Consumers has registered levels comparable to those that prevailed before the recession. Rising real incomes, partly driven by falling energy prices and improvements in the labor market, have likely driven up consumer confidence. These same factors are probably behind the more upbeat expectations that households report for real income changes over the next year or two, which are now near pre-recession levels.
Residential construction has improved modestly
The gradual recovery in residential construction activity continued over the second half of last year. Both single- and multifamily housing starts registered moderate increases in 2015 (figure 9). Sales of new and existing homes also rose moderately, abstracting from the temporary plunge in existing home sales in November, which reportedly reflected a lengthening in closing times due to new mortgage disclosure rules. But while multifamily starts have recovered to their pre-recession level, single-family construction continues to be well below its earlier pace. The level of housing starts is still being held down by a meager pace of household formation, tighter-than-average mortgage credit supply, and shortages of skilled labor and other inputs in the construction sector.
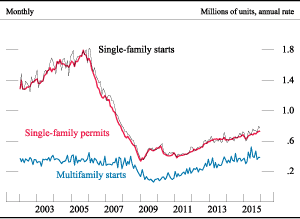
Note: The data extend through December 2015.
Source: Department of Commerce, Bureau of the Census.
Although the October 2015 and January 2016 Senior Loan Officer Opinion Survey on Bank Lending Practices (SLOOS) reports suggest that a gradual easing of bank lending standards has continued over the past six months, mortgage credit is still difficult to access for borrowers with low credit scores, undocumented income, or high debt-to-income ratios. 2 For borrowers who can obtain credit, interest rates on mortgages remain near their historical lows, although they inched up, on net, over the second half of the year. In 2015, outstanding mortgage debt rose for the first time since the recession as mortgage originations for home purchases increased and write-downs of mortgage debt continued to ebb.
Overall business investment has slowed as a result of a sharp drop in investment in the energy sector
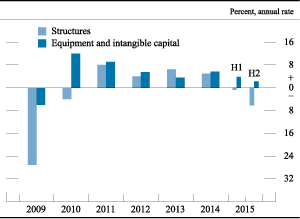
Business investment (private nonresidential fixed investment) rose at an annual rate of only 1/2 percent during the second half of 2015 after increasing at a 3 percent pace during the first half of the year (figure 10). Spending on equipment rose modestly, and a bit faster than during the first half of 2015, but spending on intangibles, such as research and development, and investment in structures outside of drilling and mining flattened out after posting strong gains during the first half of the year. Investment in structures used in the energy sector continued to fall precipitously, as the drop in oil prices has scuttled investment in higher-cost oil and gas wells. For the year as a whole, the pace of overall business investment slowed compared with 2014, mostly as a result of the drop in the energy sector. Investment has been supported by low interest rates and financing conditions that are still generally accommodative, though somewhat less so than earlier.
Corporate financing conditions have become somewhat less supportive
Domestic financial conditions for nonfinancial firms have become somewhat less supportive of growth since last June, particularly for non-investment-grade firms. Equity prices have declined and bond spreads have widened amid concerns about the global economic outlook and oil prices. Downgrades of bonds issued by nonfinancial companies have increased, and the leverage of these companies is near the top end of its range over the past few decades. Nonetheless, profitability has remained high outside the energy sector. Against a backdrop of low interest rates, investment-grade nonfinancial businesses have continued to raise substantial amounts of funds in bond and loan markets since last June, in part to finance mergers and acquisitions activity. Speculative-grade bond issuance also was solid for much of 2015 but diminished toward the end of the year as spreads widened notably, particularly for firms in the energy sector.
Loan demand remained strong across most major categories through the end of 2015. Of note, demand for commercial real estate (CRE) loans strengthened further and issuance of commercial mortgage-backed securities (CMBS) remained robust. Credit conditions tightened for this sector as concerns about credit quality led to wider spreads on CMBS and, according to the results of the October and January SLOOS reports, a moderate number of banks had tightened lending standards for CRE loans, particularly for construction and land development. A modest fraction of banks also reported having tightened lending standards for commercial and industrial loans to firms of all sizes since the second quarter.
The drag from federal fiscal policy has ended . . .
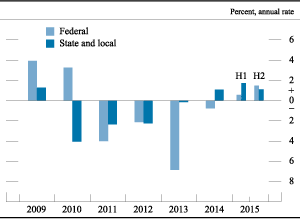
After being a drag on aggregate demand during much of the expansion, federal fiscal policy has shifted to a more neutral stance as fiscal consolidation efforts have abated. During 2015, policy actions had little effect on taxes and transfers, and real federal purchases of goods and services edged up
(figure 11).
The federal budget deficit narrowed further in fiscal year 2015 to 2-1/2 percent of GDP, largely reflecting the increase in tax receipts owing to the ongoing economic expansion as well as the modest increase in purchases. A deficit of this size is small enough to stabilize the ratio of the debt held by the public to nominal GDP; that said, the current level of that ratio is elevated relative to its average over the post-World War II period. The Congressional Budget Office projects the deficit to move up to about 3 percent of GDP in fiscal 2016.
. . . and state and local government expenditures are rising moderately
Fiscal conditions of most state and local governments continue to improve gradually. Tax revenues have been rising moderately, supported by the expansion of economic activity and increasing house prices. These governments boosted spending at a moderate rate in 2015. In particular, real state and local purchases of goods and services rose 1-1/2 percent last year, as employment posted another modest gain and real construction spending rose markedly for the first time since the recession.
In contrast, net exports still held down growth in gross domestic product slightly
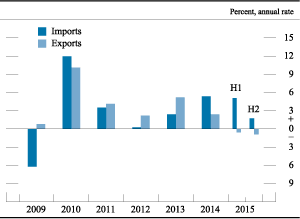
Exports held about flat in the second half of 2015, weighed down by the appreciation of the dollar
and by soft foreign economic growth (figure 12). Although the stronger dollar made imports more affordable, import growth was also relatively subdued. Imports for inputs related to oil exploration and production were particularly weak, consistent with steep declines in that industry. In all, real net trade continued to be a drag on real GDP growth in the second half of 2015. Although the real trade balance deteriorated, the nominal trade balance was little changed in 2015 in part because the value of imports declined, largely because of the decline in oil prices. Still, the current account deficit widened a bit to near 3 percent of nominal GDP as U.S. net investment income declined.
Financial Developments
The expected path for the federal funds rate over the next several years declined
Despite further strengthening in labor market conditions and a range of other indicators that market participants viewed as consistent with continued expansion in the U.S. economy, market-based measures of the expected path of the federal funds rate over the next several years have moved down, on balance, since the middle of last year. Contributing to this shift were concerns about the foreign economic outlook and global disinflationary pressures, as well as Federal Reserve communications anticipating that economic conditions will warrant only gradual increases in the federal funds rate. Survey-based measures of the expected path of policy also moved down. According to the results of the most recent Survey of Primary Dealers, conducted by the Federal Reserve Bank of New York just prior to the January FOMC meeting, respondents' expectations for the federal funds rate target at the end of this year and next year were lower than those reported last June. Market-based measures of uncertainty about the policy rate approximately one to two years ahead declined, on balance, from their mid-2015 levels.
Longer-term Treasury yields decreased
Yields on longer-term nominal Treasury securities have declined since the middle of last year on net (figure 13). The decreases in nominal yields largely reflected reductions in inflation compensation; yields on long-term inflation-protected Treasury securities were little changed. Participants in the U.S. Treasury market reportedly were particularly attentive to developments abroad, especially turbulence in Chinese financial markets, and to fluctuations in oil prices. Consistent with the changes in yields on Treasury securities, yields on 30-year agency mortgage-backed securities (MBS)--an important determinant of mortgage interest rates--decreased, on balance, over the second half of 2015 and early 2016.
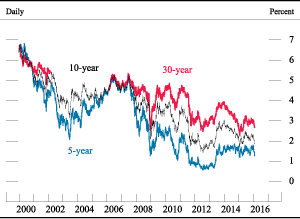
Note: The Treasury ceased publication of the 30-year constant maturity series on February 18, 2002, and resumed that series on February 9, 2006.
Source: Department of the Treasury.
Broad equity price indexes decreased . . .
Since the middle of last year, amid considerable volatility, broad measures of U.S. equity prices have decreased notably, on net, as concerns about the foreign economic outlook appeared to weigh on risk sentiment and the outlook for corporate earnings growth (figure 14). Stock prices for companies in the energy and basic materials sectors dropped sharply, reflecting the continued fall in oil and other commodity prices. Implied volatility for the overall
S&P 500 index, as calculated from options prices, increased, on balance, since the middle of last year; at times, its movement was notable.
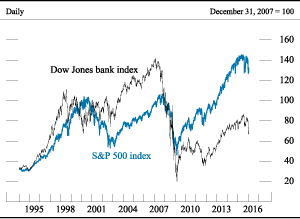
Note: For Dow Jones Indices licensing information, see the note on the Contents page of the February 2016 Monetary Policy Report.
Source: The Dow Jones Bank Index and the S&P 500 Index are a product of S&P Dow Jones Indices LLC and/or its affiliates.
. . . and risk spreads on speculative-grade corporate bonds moved up substantially, particularly for firms in the energy sector
Credit spreads in the corporate sector have widened across the credit spectrum. The spread of yields on investment-grade corporate bonds to yields on Treasury securities of comparable maturity rose moderately, and credit spreads on speculative-grade bonds widened substantially. Spreads for firms in the energy sector increased particularly sharply, reflecting the further drops in the price of oil since late June. Mutual funds investing in speculative-grade bonds experienced significant outflows over the second half of 2015 and early 2016, and, in December, redemptions from one such fund were suspended. During the second half of last year, the respondents to the Senior Credit Officer Opinion Survey on Dealer Financing Terms reported a moderate deterioration in liquidity and market functioning in speculative-grade corporate bonds and some tightening of the terms under which dealers were willing to provide financing to clients against such bonds. 3 In addition, some metrics of corporate bond market liquidity suggest a slight deterioration over the second half of 2015 and early 2016, though most indicators remain at levels comparable with those seen prior to the crisis. For further discussion of corporate bond markets and other financial stability issues, see the box "Developments Related to Financial Stability" on pages 20-21 in the February 2016 Monetary Policy Report.
Short-term funding markets continued to function well
Short-term dollar funding markets have functioned smoothly during the second half of 2015 and early 2016. Markets for unsecured offshore dollar funding and repurchase agreements, or repos, generally did not exhibit signs of stress. Year-end funding pressures were modest.
Money market participants continued to focus on the Federal Reserve's use of its monetary policy tools. These tools proved effective in raising the federal funds rate following the FOMC's decision to increase the target range in December, while other money market rates also moved up broadly in line with the increase in the federal funds target range. For a detailed discussion, see the box "Monetary Policy Implementation following the December 2015 FOMC Meeting" on page 34 of the February 2016 Monetary Policy Report.
Treasury market functioning and liquidity conditions in the mortgage-backed securities market were generally stable
Indicators of Treasury market functioning have remained broadly stable over the second half of 2015 and early 2016. A variety of liquidity metrics--including bid-asked spreads and bid sizes--have displayed no notable signs of liquidity pressures over the same period. In addition, Treasury auctions generally continued to be well received by investors.
Liquidity conditions in the agency MBS market were also generally stable. Dollar-roll-implied financing rates for production coupon MBS--an indicator of the scarcity of agency MBS for settlement--suggested limited settlement pressures over the second half of 2015 and early 2016.
Bank credit has continued to expand and bank profitability rose further
Aggregate credit provided by commercial banks increased at a solid pace in the second half of 2015 (figure 15). The expansion in bank credit was mainly driven by strong growth in loans coupled with an increase in banks' holdings of agency MBS. The growth of loans on banks' books was generally consistent with the SLOOS reports of increased loan demand for many loan categories.
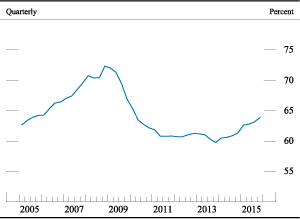
Source: Federal Reserve Board, Statistical Release H.8, "Assets and Liabilities of Commercial Banks in the United States"; Department of Commerce, Bureau of Economic Analysis.
Measures of bank profitability remained below their historical averages but improved slightly during the third quarter of 2015 (the latest available data), supported by lower noninterest expenses. Net interest margins were about unchanged, on average, during the third quarter. Delinquency and charge-off rates for most major loan types were generally stable, near or at their lowest levels since the financial crisis.
Among large bank holding companies (BHCs), despite generally positive third- and fourth-quarter earnings reports, equity prices have decreased markedly, on balance, since the middle of last year. The decline in bank equity prices likely reflected concerns about global growth, the effects of a flatter yield curve on the outlook for bank profitability, and potential losses due to the decrease in energy prices. Credit default swap (CDS) spreads for large BHCs increased on net.
The M2 measure of the money stock has increased at an average annualized rate of about 6 percent since last June, about the same pace registered in the first half of 2015 and faster than nominal GDP growth. Demand for liquid deposits has continued to boost M2 growth.
Municipal bond markets functioned smoothly, but some issuers remained strained
Credit conditions in municipal bond markets have generally remained stable since the middle of last year. Over that period, the MCDX--an index of CDS spreads for a broad portfolio of municipal bonds--and ratios of yields on 20-year general obligation municipal bonds to those on longer-term Treasury securities edged up on net.
Nevertheless, significant financial strains were still evident for some issuers. In particular, Puerto Rico, which continued to face challenges from subdued economic performance, severe indebtedness, and other fiscal pressures, defaulted on some bond issues not backed by guarantees from the commonwealth and is seeking to restructure its debt.
International Developments
The dollar continued to strengthen . . .
The foreign exchange value of the dollar rose further, on net, since the middle of last year, bringing its increase since mid-2014, when the most recent run-up began, to over 20 percent by the beginning of 2016 (figure 16). Expectations that the Federal Reserve would soon start increasing its policy interest rates, even while most foreign central banks maintained or expanded monetary policy accommodation, boosted the value of the dollar. (For more discussion, see the box "Monetary Policy Divergence in the Advanced Economies " on page 24 of the February 2016 Monetary Policy Report.) The dollar has also appreciated against the renminbi since last summer, when the People's Bank of China (PBOC) announced it was changing its policy to allow market forces to play a greater role in determining the renminbi's exchange rate. The PBOC allowed the renminbi to depreciate 3 percent against the dollar in August and another 1-1/2 percent after the turn of the year. These developments, which contributed to intensified uncertainty about China's exchange rate policy and the prospects for its economy, fostered episodes of global market turbulence that further boosted the dollar. Investors became more focused on downside risks to prospects for growth in China and, by implication, global growth. These concerns about growth, along with still-strong oil production and high inventories, contributed to a sharp drop in commodity prices, which in turn weighed on the currencies of several commodity-exporting countries.
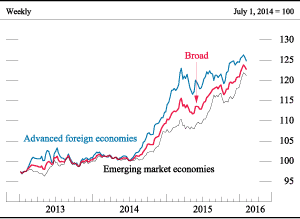
Note: The data, which are in foreign currency units per dollar, are weekly averages of daily data and extend through February 4, 2016.
Source: Federal Reserve Board, Statistical Release H.10, "Foreign Exchange Rates."
. . . while equity prices and foreign sovereign bond yields have declined
Triggered in part by the unexpected devaluation of the renminbi and an ensuing increase in concerns about global economic growth, equity indexes have dropped, on net, in most emerging market economies (EMEs) and advanced foreign economies (AFEs) since the beginning of the summer. In particular, Chinese stock prices tumbled more than 40 percent despite official interventions, including circuit breakers and bans on stock sales, that were intended to mute some of the downward pressure. The fall in Brazilian stock prices was also very sharp, as global market turbulence as well as domestic developments, including a corruption scandal, declining output, and persistent high inflation, prompted stock prices to fall nearly 25 percent since last summer.
As in the United States, 10-year sovereign yields declined in most AFEs, likely in part because of increasing concerns about potential deflationary pressure amid falling commodity prices (figure 17). In the euro area, Greek sovereign yields, which had risen sharply in the first half of the year, declined substantially as an agreement was reached last summer between the European Union and Greece. In contrast, bond spreads in a number of EMEs rose modestly, on net, in the second half of the year before moving up more steeply after the start of 2016 amid a widespread increase in risk aversion.
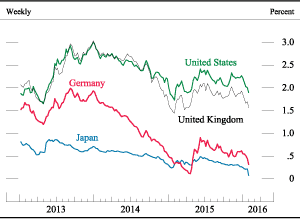
Note: The data are weekly averages of daily data and extend through February 4, 2016.
Source: Bloomberg.
Growth in the emerging market economies moved back up from earlier in 2015 . . .
Following weak growth in the first half of 2015, economic activity in the EMEs improved in the second half, as the pace of growth picked up in Asia and Latin America. However, growth has been held back in part by exports from EMEs, which declined appreciably early in 2015 and remain subdued on average.
Economic activity in most of emerging Asia, which had been restrained in the first half of the year by soft external demand and by the outbreak of MERS (Middle East Respiratory Syndrome) in South Korea, picked up in the second half, as the drag from these pressures subsided. In China, GDP growth is reported to have held steady around 7 percent in the second half of the year, boosted in part by relatively strong growth in services. However, weak manufacturing, as well as the financial market volatility noted previously, led to a pronounced heightening of concerns about the economy during the second half of the year.
In Latin America, the decline in commodity prices, along with other macroeconomic challenges, continued to weigh on the economic activity of several countries. In Mexico, the economy continued to grow at a moderate pace in the second half of 2015, supported by improving household demand. However, low oil prices have pressured public finances, and manufacturing exports faltered toward the end of the year. In Brazil, the economy is undergoing its most severe recession in decades. Tight monetary policy in response to high inflation, low commodity prices, and the fallout from a high-profile corruption scandal eroded business confidence and contributed to a collapse in investment.
Inflation remained subdued in many EMEs, as the continuing decline in commodity prices contributed to a moderation of headline inflation. Consequently, some central banks, including those of Korea and India, loosened monetary policy to support growth. In China, the PBOC also lowered its benchmark rate and cut the reserve requirement ratio in August and October to address weakness in the economy. In contrast, faced with inflationary pressures stemming partly from their depreciating currencies, Brazil, Chile, and Colombia raised their policy rates in the second half of 2015.
. . . and in the advanced foreign economies, economic activity expanded at a moderate pace
In Canada, where low oil prices induced a mild contraction earlier in the year, economic activity rebounded in the third quarter as exports recovered and business-sector investment contracted at a slower pace. That said, more recent indicators of growth weakened markedly during the fourth quarter. In contrast, in the euro area, Japan, and the United Kingdom, economic activity grew moderately in the third quarter, and recent indicators for fourth-quarter growth, such as purchasing managers indexes, have largely held steady.
As in the United States, inflation remained low in most advanced foreign economies. Further declines in commodity prices weighed on inflation in the AFEs; in the euro area, Japan, and the United Kingdom, consumer prices changed little in 2015. Over the same period, consumer prices rose about 1-1/2 percent in Canada, reflecting the boost to import prices from the sharp depreciation of the Canadian dollar over the past year.
With inflation low, AFE central banks maintained highly accommodative monetary policies, and some signaled their intention to maintain large balance sheets well into the future. The European Central Bank, in addition to lowering its deposit rate further into negative territory, announced an extension of the intended duration of its asset purchase program through at least March 2017 and that it would reinvest principal payments for as long as necessary. The Bank of England announced that it will start shrinking its balance sheet only after its policy rate rises to about 2 percent from its current level of 1/2 percent. Meanwhile, in response to weak economic performance earlier in 2015, the Bank of Canada cut its policy rate further. More recently, the Bank of Japan cut the interest rate that it pays on a portion of banks' current account deposits to negative 0.1 percent.
Part 2: Monetary Policy
In December, the Federal Open Market Committee (FOMC) raised the target range for the federal funds rate by 1/4 percentage point after seven years in which that rate had been held near zero. The FOMC's decision reflected the considerable improvement in the labor market last year and the Committee's assessment that, even with the modest reduction in policy accommodation, the labor market would continue to strengthen and inflation would return over the medium term to the FOMC's 2 percent objective. Monetary policy remains accommodative, and the Committee expects that economic conditions will warrant only gradual increases in the federal funds rate. However, the actual path of the federal funds rate will depend on the economic outlook as informed by incoming data.
The FOMC raised the federal funds rate target range in December . . .
Since last March, the FOMC had anticipated that it would be appropriate to increase the federal funds rate when it had seen further improvement in the labor market and was reasonably confident that inflation would move back to 2 percent over the medium term. In December, the FOMC, judging that these criteria had been met, raised the target range for the federal funds rate to 1/4 to 1/2 percent (figure 18). 4
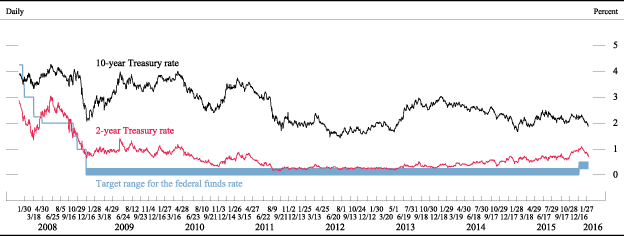
Note: The 2-year and 10-year Treasury rates are the constant-maturity yields based on the most actively traded securities. The dates on the horizontal axis are those of regularly scheduled Federal Open Market Committee meetings.
Source: Department of the Treasury; Federal Reserve Board.
The Committee's decision to raise the federal funds rate recognized the time it takes for policy actions to affect future economic outcomes; if the FOMC delayed the start of policy normalization for too long, a relatively abrupt tightening of policy might eventually be needed to keep the economy from overheating and inflation from significantly overshooting the Committee's 2 percent objective. Such an abrupt tightening could disrupt financial markets and perhaps even inadvertently push the economy into recession.
. . . but monetary policy remains accommodative
Even after the increase in the federal funds rate late last year, the stance of monetary policy remains accommodative. The FOMC anticipates that economic conditions will evolve in a manner that will warrant only gradual increases in the federal funds rate, and that the federal funds rate is likely to remain, for some time, below the levels that are expected to prevail in the longer run.
This expectation is consistent with the view that the neutral nominal federal funds rate--defined as the value of the federal funds rate that would be neither expansionary nor contractionary if the economy was operating at its productive potential--is currently low by historical standards and is likely to rise only gradually over time. One indication that the neutral federal funds rate is low is that U.S. economic growth has been only moderate in recent years despite the very low level of the federal funds rate and the Federal Reserve's very large holdings of longer-term securities. Had the neutral rate been running closer to the average level estimated to have prevailed in recent decades, these policy actions would have been expected to foster a much more rapid economic expansion.
An array of persistent economic headwinds have weighed on aggregate demand since the financial crisis; these headwinds included, at various times, limited access to credit for some borrowers, contractionary fiscal policy, and weak growth abroad coupled with a significant appreciation of the dollar. Although the overall restraint imposed by such headwinds has declined over the past few years, the effects of some headwinds have remained significant. As these effects abate further, the neutral federal funds rate should gradually move higher over time. (For a discussion of how the neutral federal funds rate is likely to evolve over time, see the box "The Neutral Federal Funds Rate in the Longer Run" on pages 32-33 of the February 2016 Monetary Policy Report.)
Another reason that the Committee expects only a gradual increase in the federal funds rate will be warranted is that, with the federal funds rate near zero, the FOMC can respond more readily to upside surprises to inflation, economic growth, and employment than to downside shocks. This asymmetry suggests that it is appropriate to be more cautious in normalizing the stance of monetary policy than would be the case if short-term nominal interest rates were appreciably above zero.
In part reflecting this concern, the FOMC continued to reinvest principal payments from its securities portfolio, and the Committee expects that this reinvestment policy will be maintained until normalization of the level of the federal funds rate is well under way. Maintaining sizable holdings of longer-term securities should help support accommodative financial conditions and reduce the risk that the Committee would not be able to deliver sufficient accommodation by lowering the federal funds rate in the event of future adverse shocks.
The FOMC expects that, supported by an accommodative monetary policy, economic activity will continue to expand at a moderate pace and the labor market will continue to strengthen. Inflation is expected to remain low in the near term, in part because of recent further declines in energy prices, but to rise to 2 percent over the medium term as the transitory effects of declines in energy and import prices dissipate and the labor market strengthens further. In light of the current shortfall of inflation from 2 percent, the Committee is carefully monitoring actual and expected progress toward its inflation goal.
The FOMC's policy decisions will continue to be data dependent
Although the Committee expects that economic conditions will warrant only gradual increases in the federal funds rate, the Committee has emphasized that the actual path of monetary policy will depend on how incoming data affect the economic outlook. In determining the timing and size of future adjustments to the target range, the Committee will assess realized and expected economic conditions relative to its objectives of maximum employment and 2 percent inflation. Stronger growth or a more rapid increase in inflation than the Committee currently anticipates would likely call for faster increases in the federal funds rate; conversely, if conditions prove weaker, a lower path of the federal funds rate would likely be appropriate. Similarly, the timing of a change in the reinvestment policy will depend on economic developments and their implications for progress toward the FOMC's goals of maximum employment and price stability. In assessing realized changes in economic conditions and forming its outlook, the Committee will take into account a wide range of measures, including measures of labor market conditions, indicators of inflation pressures and inflation expectations, and readings on financial and international developments.
The size of the Federal Reserve's balance sheet has remained stable
With the continuation of the Committee's reinvestment policy, the Federal Reserve's total assets have held steady at around $4.5 trillion (figure 19). Holdings of U.S. Treasury securities in the System Open Market Account (SOMA) have remained at $2.5 trillion, and holdings of agency debt and agency mortgage-backed securities at approximately $1.8 trillion. Consequently, total liabilities on the Federal Reserve's balance sheet were largely unchanged.
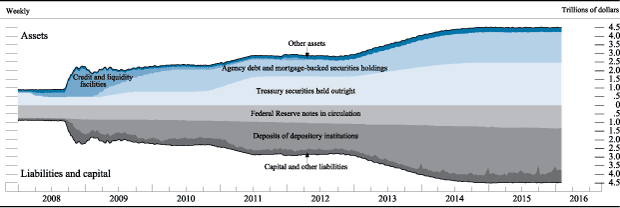
Note: "Credit and liquidity facilities" consists of primary, secondary, and seasonal credit; term auction credit; central bank liquidity swaps; support for Maiden Lane, Bear Stearns, and AIG; and other credit facilities, including the Primary Dealer Credit Facility, the Asset-Backed Commercial Paper Money Market Mutual Fund Liquidity Facility, the Commercial Paper Funding Facility, and the Term Asset-Backed Securities Loan Facility. "Other assets" includes unamortized premiums and discounts on securities held outright. "Capital and other liabilities" includes reverse repurchase agreements, the U.S. Treasury General Account, and the U.S. Treasury Supplementary Financing Account. The data extend through February 3, 2016.
Source: Federal Reserve Board, Statistical Release H.4.1, "Factors Affecting Reserve Balances."
Given the Federal Reserve's large securities holdings, interest income on the SOMA portfolio has continued to support substantial remittances to the U.S. Treasury Department. Preliminary results indicate that the Reserve Banks provided for payments of $97.7 billion of their estimated 2015 net income to the Treasury. In addition, the Reserve Banks transferred to the Treasury $19.3 billion from their capital surplus as required by an amendment to the Federal Reserve Act contained in the Fixing America's Surface Transportation Act of 2015. Remittances from 2008 through 2015 total about $600 billion on a cumulative basis--an average of about $75 billion a year, compared with about $25 billion a year, on average, over the decade prior to 2008.
The Committee continued to focus on the implementation of monetary policy
Consistent with the FOMC's Policy Normalization Principles and Plans published on September 17, 2014, the Federal Reserve used interest paid on reserve balances and also employed an overnight reverse repurchase agreement (ON RRP) facility to implement its decision in December to raise the target range for the federal funds rate. 5 Specifically, the Board of Governors raised the interest rate paid on required and excess reserve balances to 1/2 percent, while the FOMC authorized ON RRP operations at an offering rate of 1/4 percent. (For further information, see the box "Monetary Policy Implementation following the December 2015 FOMC Meeting" on page 34 of the February 2016 Monetary Policy Report.) In addition, the Board of Governors approved an increase in the discount rate (the primary credit rate) to 1 percent.
Along with the decision to increase the target range for the federal funds rate, the FOMC also temporarily suspended the aggregate cap on ON RRP transactions, indicating that ON RRP operations would be undertaken in amounts limited only by the value of Treasury securities held outright in the SOMA that are available for such operations and by a per-counterparty limit of $30 billion per day. Nonetheless, total reverse repurchase agreement transactions with the Federal Reserve have remained near levels observed prior to the increase in the target range for the federal funds rate and the suspension of the aggregate cap. The Committee intends to phase out this facility when it is no longer needed to help control the federal funds rate.
The Federal Reserve also continued to test the operational readiness of other policy tools. Three Term Deposit Facility operations were conducted in the second half of 2015. The operations offered either
7- or 14-day deposits at a floating rate of 1 basis point over the interest rate on excess reserves. In these operations, deposit volumes declined slightly from previous tests with similar parameters.
Monetary Policy Report July 2015
Summary
The overall condition of the labor market continued to strengthen over the first half of 2015, albeit at a more moderate pace than in 2014. So far this year, payroll employment has increased by about 210,000 on average per month compared with the robust 260,000 average in 2014, and the unemployment rate has declined about 1/4 percentage point to 5.3 percent in June, close to most Federal Open Market Committee (FOMC) participants' estimates of its longer-run normal level. Other measures of labor market activity also point to ongoing improvement in labor market conditions even as they continue to suggest that further improvement is needed to achieve the Committee's maximum employment mandate. In particular, the labor force participation rate has generally been holding steady but nevertheless remains below most assessments of its trend, and the number of people working part time when they would prefer full-time employment has declined further but remains elevated. And, while some measures of labor compensation are starting to rise more rapidly, they nevertheless remain consistent with the view that labor resources likely are still not being fully utilized.
Consumer price inflation remains below the FOMC's longer-run goal of 2 percent. The price index for personal consumption expenditures (PCE) edged up only 1/4 percent over the 12 months ending in May, held down by the pass-through of a sizable decline in crude oil prices over the second half of last year. However, consumer energy prices appear to have stabilized in recent months. Changes in the PCE price index excluding food and energy items, which are often a better indicator of where overall inflation will be in the future, also remained relatively low; this index rose 1-1/4 percent over the 12 months ending in May, partly restrained by declines in the prices of non-energy imported goods. Meanwhile, survey-based measures of longer-run inflation expectations have remained relatively stable; market-based measures of inflation compensation have moved up somewhat from their lows earlier this year but remain below levels that prevailed until last summer.
Real gross domestic product is reported to have been little changed in the first quarter of this year. Some of this weakness likely reflected temporary factors that will reverse over the coming quarters. Indeed, a number of recent spending indicators suggest that economic activity increased at a moderate pace in the second quarter. The economic expansion continues to be supported by rising incomes resulting from ongoing job gains, accommodative monetary policy, and generally favorable financial conditions. Furthermore, the sizable drop in oil prices since last summer has been a substantial benefit to households, although the negative side of that decline has been quite evident in cutbacks in the energy sector of our economy. In addition, the sluggish pace of economic activity abroad, together with the appreciation of the dollar, has weighed on net exports.
The Committee expects that, with appropriate policy accommodation, economic activity will expand at a moderate pace and labor market conditions will continue to move toward levels the Committee judges to be consistent with its dual mandate of maximum employment and price stability. In addition, the Committee anticipates that, with stable inflation expectations and strengthening economic activity, inflation will rise gradually over the medium term toward the Committee's 2 percent objective. Those expectations are reflected in the June Summary of Economic Projections (SEP), which provides projections of the individual FOMC participants and is included as Part 3 of the July 2015 Monetary Policy Report on pages 37-50; it is also included in section 9 of this annual report.
Domestic financial conditions have generally remained supportive of economic growth. After having declined notably in 2014, longer-term interest rates have increased somewhat, on net, over the first half of the year, but they remain at historically low levels. Broad measures of U.S. equity prices have been little changed, on balance, this year after having risen considerably in recent years. Credit flows to large nonfinancial businesses have remained solid, and financing generally appears to have become available to small businesses as well. Credit conditions for households have been mixed: While the availability of mortgage loans continues to expand gradually, mortgages remain relatively difficult to obtain for some individuals, and credit card lending standards and terms are tight for borrowers with below-prime scores. Meanwhile, auto and student loans continued to be widely available, and outstanding balances of such loans have continued to rise significantly.
Financial vulnerabilities in the United States overall have remained moderate since the previous Monetary Policy Report. Capital and liquidity positions at the largest banking firms have remained strong, maturity transformation outside the banking system has continued to trend lower, and debt growth by the household sector has been modest. Valuation pressures in many fixed-income markets, while having eased, have remained notable; prices and valuation measures for commercial real estate have increased further; and borrowing by lower-rated businesses has continued at a rapid rate. Although market participants have expressed concerns about the resilience of liquidity during stress events, a variety of metrics do not suggest a significant deterioration in market liquidity; the Federal Reserve is watching developments closely. Foreign developments, such as the situation in Greece and financial conditions in China, could pose some risks to the United States if they lead to broader strains in those regions.
The FOMC has continued to judge that a high degree of policy accommodation remains appropriate to support continued progress toward maximum employment and price stability. As a result, it has maintained the exceptionally low target range of 0 to 1/4 percent for the federal funds rate and has kept the Federal Reserve's holdings of longer-term securities at their current elevated levels to help maintain accommodative financial conditions. The Committee has reiterated that in deciding how long to maintain the current target range for the federal funds rate, it will consider a broad set of indicators to assess realized and expected progress toward its objectives. Since its April meeting, the Committee has stated it anticipates that raising the target range for the federal funds rate will be appropriate when it has seen further improvement in the labor market and is reasonably confident that inflation will move back to its 2 percent objective over the medium term. In the June SEP, most policymakers anticipated that these conditions would be met sometime this year. The Committee continues to expect that, even after employment and inflation are near mandate-consistent levels, economic conditions may, for some time, warrant keeping the target federal funds rate below levels the Committee views as normal in the longer run.
The Federal Reserve has continued to plan for the eventual normalization of the stance and conduct of monetary policy, including by testing the operational readiness of the policy tools to be used. The FOMC remains confident that it has the tools it needs to raise short-term interest rates when doing so becomes appropriate.
Part 1: Recent Economic and Financial Developments
Labor market conditions continued to improve over the first half of 2015, although at a more moderate pace than last year. Gains in payroll employment since the start of the year have averaged close to 210,000 per month, somewhat below last year's average pace, while the unemployment rate edged down slightly to 5.3 percent in June, close to most Federal Open Market Committee (FOMC) participants' estimates of its longer-run normal level. Since last summer, a steep drop in crude oil prices has exerted downward pressure on overall inflation, and price increases for other goods and services have been subdued, partly reflecting declines in prices for imported non-energy goods. The price index for personal consumption expenditures (PCE) increased only 1/4 percent during the 12 months ending in May, a rate that is well below the FOMC's longer-run objective of 2 percent; the index excluding food and energy prices was up 1-1/4 percent over this period. Survey-based measures of longer-run inflation expectations have been fairly stable, whereas measures of inflation compensation derived from financial market quotes, while up from their lows earlier this year, remain below the levels that prevailed prior to last summer. Meanwhile, real gross domestic product (GDP) was reported to have been little changed in the first quarter of this year. Some of this weakness likely was the result of temporary factors, and recent indicators suggest that economic activity picked up in the second quarter; even so, the pace of output growth appears to have slowed so far this year, on average, relative to its pace last year. The economic expansion continues to be supported by rising real incomes driven by gains in employment and, recently, lower oil prices; by improving consumer and business confidence; and by accommodative monetary policy and generally favorable financial conditions. However, the low level of oil prices also pushed down investment spending in the energy sector early this year, and sluggish growth abroad and the higher foreign exchange value of the dollar have weighed on U.S. exports.
Domestic Developments
The labor market has continued to improve but at a more gradual pace . . .
Labor market conditions strengthened further over the first half of 2015 but at a more moderate pace than last year. Payroll employment gains have averaged about 210,000 per month so far this year, a solid pace but down from an average of 260,000 jobs per month in 2014. The unemployment rate has continued to edge lower and reached 5.3 percent in June, 1/4 percentage point lower than in December; in 2014, the unemployment rate declined more rapidly. In addition, the share of unemployed who have been out of work for more than six months has declined noticeably this year. After falling steeply during the recession and the early part of the recovery, the labor force participation rate has remained roughly flat since late 2013, although it ticked lower in June. The continued stability of the participation rate likely represents cyclical improvement relative to its declining trend, which reflects ongoing demographic trends such as the aging of members of the baby-boom generation into their retirement years. With employment rising and the participation rate holding steady, the employment-to-population ratio edged up further over the first half of this year. Furthermore, the job openings rate has continued to move up this year and now stands above its pre-recession level, and the quits rate, which is often considered a measure of workers' confidence in labor market opportunities, has remained at relatively high levels. Unemployment insurance claims are now very low.
. . . and some labor market slack remains . . .
With these improvements, the labor market has shown further progress toward the Committee's maximum employment mandate. Nevertheless, as described in the box "Slack in the Labor Market" on pages 6-7 of the July 2015 Monetary Policy Report, other labor market indicators are consistent with more slack in resource utilization than is indicated by the unemployment rate alone. In particular, although these measures have improved, the participation rate remains below most assessments of its trend, and the share of workers who are employed part time but would like to work full time is still high; in large part for this reason, the more comprehensive U-6 measure of labor underutilization remains elevated relative to the unemployment rate.
. . . while compensation has shown some signs of accelerating . . .
As the labor market has continued to improve, increases in some measures of hourly labor compensation have begun to pick up but, nonetheless, remain relatively subdued. The employment cost index (ECI) for private-industry workers, which measures both wages and the cost of employer-provided benefits, rose 2-3/4 percent over the 12 months ending in March, up from gains of about 2 percent that had prevailed over the past few years. Two other prominent measures of compensation--average hourly earnings and business-sector compensation per hour--have increased a bit more slowly than the ECI over the past year and have shown little sign of acceleration. Since the recession began, the gains in all three of these measures of nominal compensation have fallen well short of their pre-recession averages, and growth of real compensation has fallen short of productivity growth over much of this period. That said, the drop in energy prices boosted real wage growth over the past year.
. . . and productivity growth has been especially weak
Labor productivity in the business sector is reported to have declined in both the fourth quarter of 2014 and the first quarter of 2015, as the recovery in hours worked progressed even as output growth slowed. Over such short periods, however, productivity growth is often quite volatile, both because of difficulties in measuring output and hours and because other transitory factors may affect productivity growth from quarter to quarter. Taking a longer view, output per hour in the business sector has risen at an average annual rate of 1-1/4 percent since the recession began in late 2007, a gain that is modest by historical standards. The relatively slow pace of productivity growth since 2007 reflects, in part, the sustained weakness in capital investment over the recession and recovery period; consequently, productivity gains may improve in the future as investment in productivity-enhancing capital equipment and research and development strengthens.
A plunge in crude oil prices has held down consumer prices . . .
Overall consumer price inflation has slowed to near zero over the past year, well below the FOMC's longer-run objective of 2 percent. In May, the 12-month change in the overall PCE price index was only 1/4 percent, down from 1-3/4 percent in May 2014. This deceleration importantly reflects the sharp drop in oil and farm commodity prices over this period as well as declines in non-energy import prices. However, energy prices have stabilized in recent months, with the result that one-month changes in overall PCE prices have firmed somewhat.
After plunging in the second half of 2014, the spot price of crude oil moved up somewhat in the first half of 2015, reflecting in part a sharp decline in investment in the U.S. energy sector. Over the past few weeks, prices have moved lower as both U.S. and foreign oil production have been stronger than expected and as concerns about global growth persist. As of early July, at below $60 per barrel, the spot price of Brent crude oil remains at about half of its mid-2014 peak. Moreover, oil futures prices suggest that market participants expect only a moderate increase in oil prices over the next couple of years as global demand firms and North American supply growth slows. The large cumulative drop in crude oil prices was fully passed through to lower retail prices for gasoline and other energy products early this year. More recently, gasoline prices have increased somewhat, although prices at the pump remain at levels substantially below those of last summer.
Food commodity prices have fallen considerably from their levels of a year ago, and the gradual pass-through of these costs to the retail level has led to declines in consumer food prices over the first five months of this year. Meanwhile, non-oil import prices have been declining sharply so far this year, reflecting lower commodity prices as well as the rise since last summer in the exchange value of the dollar.
. . . and outside of the energy and food categories, inflation has remained subdued
Inflation for items other than food and energy (so-called core inflation) has remained relatively low. Core PCE prices rose about 1-1/4 percent over the 12 months ending in May, down slightly from its year-earlier pace. Falling import prices likely held down core inflation over the past year, and lower oil prices and easing prices for commodities more generally may have played a role in holding down firms' costs and prices. In addition, ongoing slack in labor and product markets has likely placed downward pressure on inflation, although with the improving labor market, the effect of this factor likely is waning.
Survey-based measures of longer-term inflation expectations have remained stable . . .
Because inflation expectations likely factor into wage- and price-setting decisions, the Federal Reserve tracks a variety of indicators of these expectations. Survey-based measures of longer-term inflation expectations have been quite stable over the past 15 years. Readings on inflation expectations over the next 5 to 10 years, as reported in the University of Michigan Surveys of Consumers, have continued to move within a narrow range, and, in the Survey of Professional Forecasters, conducted by the Federal Reserve Bank of Philadelphia, the median expectation for the annual rate of increase in the PCE price index over the next 10 years has been unchanged at 2 percent. Furthermore, in the Survey of Primary Dealers, conducted by the Federal Reserve Bank of New York, distributions of inflation expectations 5 to 10 years ahead have also remained stable.
. . . while market-based measures of inflation compensation have declined since last summer
In contrast, market-based measures of longer-term inflation compensation--derived from inflation swaps or from differences between yields on nominal Treasury securities and Treasury Inflation-Protected Securities (TIPS)--declined noticeably between the middle of 2014 and early this year, and, while they have retraced part of that decline in recent months, they remain below the levels that prevailed prior to last summer. Deducing the sources of changes in inflation compensation is difficult because such movements reflect not only expected inflation, but also an inflation risk premium--the compensation that holders of nominal securities demand for bearing inflation risk--as well as other factors. Nevertheless, one cannot rule out a decline in inflation expectations among market participants since last summer.
Economic activity slowed earlier this year
Real GDP is reported to have been little changed in the first quarter of this year after increasing 2-1/2 percent in 2014. Some of this weakness likely reflected temporary disruptions due to unusually severe winter weather and a labor dispute at West Coast ports; in addition, residual seasonality in some components of GDP may have held down measured first-quarter growth. 6 Both of these factors would tend to boost measured GDP growth over the remainder of the year. Indeed, a number of recent spending indicators suggest that economic activity rose moderately in the second quarter.
However, some of the slowdown in GDP growth relative to its pace last year likely reflects somewhat more persistent factors. In particular, expectations that the relative strength of the U.S. economy will lead to an earlier normalization of monetary policy than in our trading partners have contributed to a substantial appreciation of the dollar over the past year. The appreciation, combined with sluggish foreign growth, is weighing on the demand for U.S. exports. And the sizable drop in oil prices since last summer has led to marked cutbacks in investment in the energy sector of our economy even though those price declines have been a substantial benefit to households. These factors also contributed to the 2-3/4 percent annual rate of decline in industrial production in the first five months of this year. Despite the drag on production from these headwinds, the economic expansion continues to be supported by accommodative financial conditions--including the low cost of borrowing for many households and businesses--and by increases in households' real incomes spurred by continuing job gains and the earlier decline in oil prices.
Net exports were a substantial drag on real GDP growth in the first quarter
Exports fell markedly in the first quarter, held back by lackluster growth abroad, the appreciation of the dollar, and transitory factors, including the West Coast port labor dispute. In contrast, imports grew briskly in the first quarter, supported in part by the stronger dollar. As a result, net exports were an unusually large drag on real GDP growth. Trade data through May suggest that exports recovered from their first-quarter drop and import growth slowed, pointing to a small negative contribution from net exports in the second quarter. The current account deficit widened a bit to 2.6 percent of nominal GDP in the first quarter of this year but remains near its narrowest readings since the late 1990s.
Gains in income and wealth are supporting consumer spending . . .
The rate of growth in consumer spending slowed during this year's harsh winter but has picked up in recent months. Smoothing through these monthly fluctuations, real consumer spending increased at an average annual rate of 2-3/4 percent over the first five months of this year, about the same as its average pace over 2014. The ongoing improvement in the labor market has supported income growth, and low gasoline prices have boosted households' purchasing power. As a result, real disposable personal income--that is, income after taxes and adjusted for price changes--increased at an annual rate of nearly 4 percent over the first five months of this year, a slightly faster pace than in 2014.
Coupled with low interest rates, the rise in incomes has reduced debt payment burdens for many households. The household debt service ratio--that is, the ratio of required principal and interest payments on outstanding household debt to disposable personal income--has remained at a very low level by historical standards.
Consumer spending growth also continues to be supported by increases in household net worth. Over the first half of this year, broad measures of U.S. equity prices were little changed, on balance, after having risen considerably in recent years, and house prices moved up further. Buoyed by cumulative increases in home and equity prices, aggregate household net worth has risen appreciably from its levels during the recession and its aftermath to more than six times the value of disposable personal income.
. . . as is credit availability for consumers that remains generally favorable
Consumer credit has continued to expand this year. Auto and student loans remain widely available even to borrowers with lower credit scores, and outstanding balances of such loans expanded significantly through May. Credit card borrowing slowed early this year, likely reflecting weak retail activity, but has rebounded in recent months. However, credit card availability remains unusually tight for borrowers with below-prime credit scores.
Consumer confidence remains high
Indicators of consumer sentiment suggest that confidence among households remains high. The Michigan survey's index of consumer sentiment--which incorporates households' views about their own financial situations as well as broader economic conditions--moved up noticeably over the second half of 2014 as oil prices plunged and labor market conditions improved and has remained upbeat so far this year. Responses to the Michigan survey's question about households' expectations of real income changes over the next year or two have also moved up over the past year to their highest levels since before the recession.
The pace of homebuilding has improved only slowly
The recovery in residential investment continued at a gradual pace over the first half of this year. Smoothing through the effects of harsh winter weather, single-family housing starts have edged up since last summer, while sales of new and existing homes have been trending up, on balance, over the past year. In addition, multifamily construction activity has recovered to its pre-recession level, reflecting a shift in demand toward rental units. All told, real residential investment looks set to post a moderate gain over the first half of the year. Nevertheless, overall construction activity remains well below its pre-recession levels, likely due to a rate of household formation that, notwithstanding tentative signs of a recent pickup, has generally run quite low relative to demographic norms since the recession.
The slow advances in single-family construction and home sales have likely been supported, at least to some degree, by low interest rates and a gradual easing in mortgage credit. In the April Senior Loan Officer Opinion Survey on Bank Lending Practices (SLOOS), banks reported having eased lending standards for a number of categories of residential mortgage loans in the first quarter. 7 Even so, loans remain difficult to obtain for potential borrowers with low credit scores as well as for any potential borrowers that cannot meet a number of other requirements, such as fully documenting their income and meeting debt-to-income ratios. Meanwhile, for qualified borrowers, interest rates for 30-year fixed mortgages remain near their historical lows despite having moved up somewhat, on net, over the first half of the year. Increases in house prices and mortgage rates have been balanced out by rising household incomes, with the result that standard measures of housing affordability have stayed flat at relatively high levels over the first half of this year. With the number of mortgage originations for home purchase still well below pre-crisis levels, aggregate net mortgage debt growth has continued to be quite sluggish.
Overall business investment has turned down as investment in the energy sector has plunged
Business investment (that is, private nonresidential fixed investment) fell at an annual rate of 2 percent in the first quarter, reflecting a sizable decline in investment in the equipment and structures used in the drilling and mining sector. The number of drilling rigs in operation has fallen precipitously this year in response to the earlier steep drop in crude oil prices, and a number of oil and gas companies have announced plans to cut capital expenditures this year. As a result, activity has also slowed markedly in sectors that supply oil production companies, including steel and certain types of machinery. The drop in drilling and mining investment subtracted more than 1/2 percentage point from first-quarter real GDP growth, and, with the contraction in that sector continuing, it likely took a similar amount off of GDP growth in the second quarter.
Business outlays for structures outside of the energy sector also declined in the first quarter, while spending on equipment and intellectual property products (E&I) increased at a modest 3-1/2 percent annual rate. Forward-looking indicators, such as orders and shipments of capital goods and surveys of business conditions, point to continued modest gains in E&I investment in the second quarter. Overall business investment has been supported by low interest rates and generally accommodative financial conditions but has been held back by slowing business output growth, which reflects, in part, weakening exports by domestic businesses due to the stronger dollar.
Corporate financing conditions were generally favorable
Financing conditions for nonfinancial firms remained solid in the first half of the year. Although corporate profits as reported by the Bureau of Economic Analysis declined in the first quarter, profitability stayed high, and default rates on nonfinancial corporate bonds were generally low. Nonfinancial businesses have raised substantial amounts of funds in bond, equity, and loan markets so far this year, in part to finance a recent pickup in mergers and acquisitions activity. Bond issuance by both investment- and speculative-grade firms has remained quite strong, as firms continued to take advantage of historically low interest rates. Commercial and industrial loans on banks' books have expanded at a solid pace this year, in part reflecting narrower loan spreads. Meanwhile, financing conditions for small businesses continued to improve, although the growth of small business loans remained subdued, evidently reflecting still-tepid demand for credit from small business owners. In the first quarter, some banks with loans to firms in the oil and gas drilling or extraction sectors indicated they were reducing existing lines of credit to these firms and tightening standards on new loans or lines of credit.
In the commercial real estate (CRE) sector, financing remained broadly available. CRE loans on banks' books increased appreciably this year through May, consistent with stronger loan demand and a further easing of lending standards reported in the April SLOOS. Banks also reported that, over the past 12 months, they had eased spreads, increased maximum loan sizes, and extended the maximum maturity on such loans. Issuance of commercial mortgage-backed securities (CMBS) continued to be robust, and the spreads of CMBS rates over Treasury rates remained narrow.
The drag from federal fiscal policy has waned . . .
Fiscal policy at the federal level had been a factor restraining GDP growth for several years. However, the contractionary effects of fiscal policy changes eased appreciably last year as the restraining effects of the 2013 tax increases abated, transfers increased from the Affordable Care Act, and federal purchases flattened out after falling sharply from 2011 through 2013.
The federal unified deficit narrowed further this year, reflecting both previous years' spending cuts and an increase in tax receipts resulting from the ongoing economic expansion. Federal receipts have edged up to around 18 percent of GDP, their highest level in more than a decade. Meanwhile, nominal federal outlays as a share of GDP have flattened out at about 20 percent, still a little above the levels that prevailed before the start of the recession. As a result, the budget deficit currently stands at about 2-1/2 percent of GDP, down considerably from its peak at nearly 10 percent during the recession. Overall federal debt held by the public stabilized as a share of GDP in 2014 and early 2015, albeit at a relatively high level.
. . . and state and local government expenditures are rising anemically
The expansion of economic activity and further gains in house prices--which should help boost property tax revenues over time--continue to support a gradual improvement in the fiscal positions of most state and local governments. Consistent with slowly improving finances, states and localities expanded employment slightly, on average, over 2014 and the first half of this year following several years of declines. In addition, these governments have increased outlays for construction projects somewhat over this period.
Financial Developments
Market expectations for the path of the federal funds rate over the next several years declined . . .
Despite the continued improvement in labor market conditions, market participants' expectations for the path of policy rates over the next several years shifted downward in the first half of 2015. Contributing to this shift were weak data on real economic activity in the first quarter of this year and Federal Reserve communications that were seen as more accommodative than expected--including the downward revisions to FOMC participants' projections for the federal funds rate, real GDP growth, inflation, and the longer-run unemployment rate, particularly in March. On balance, market-based measures of the expected path of the federal funds rate through late 2016 have flattened. The expected timing of the initial increase in the federal funds rate has been pushed out from mid-2015 toward the end of the year, although the expected pace of increases in the federal funds rate after 2016 is now somewhat faster. In the Survey of Primary Dealers and the Survey of Market Participants conducted by the Federal Reserve Bank of New York just prior to the June FOMC meeting, respondents judged that the initial increase in the target federal funds rate was most likely to occur at the FOMC's September 2015 meeting, about one quarter later than they had expected last December. 8 Meanwhile, as the anticipated date of the beginning of normalization has become closer, measures of policy rate uncertainty based on interest rate derivatives have continued to edge higher.
. . . and longer-term Treasury yields have remained low
Yields on longer-term Treasury securities have risen notably since early February, reversing the downward trend over the previous 13 months. However, they remain at historically low levels. On net, yields on 10- and 30-year nominal Treasury securities are 16 basis points and 43 basis points, respectively, above their levels at the end of 2014. The increases were most pronounced in longer-horizon forward rates. For example, the five-year forward rate five years ahead rose 42 basis points over the first half of 2015 and in early July after falling nearly 2 percentage points in 2014. U.S. Treasury yields continued to be especially sensitive to foreign monetary policy and political developments and movements in core European sovereign yields (for more details, see the section "International Developments"). Uncertainty about long-term interest rates has also risen somewhat amid higher realized volatility of long-term yields, fluctuations in oil prices, and uncertainties surrounding the global outlook.
Consistent with moves in the yields on longer-term Treasury securities, yields on 30-year agency mortgage-backed securities (MBS)--an important determinant of mortgage interest rates--have increased about 20 basis points, on balance, so far in 2015.
Liquidity conditions in the Treasury and agency MBS markets were generally stable . . .
Indicators of Treasury market functioning remained broadly stable over the first half of 2015. While market commentary increasingly pointed to a possible deterioration in liquidity in these markets, a variety of liquidity metrics--including bid-asked spreads and bid sizes--have displayed no notable signs of liquidity pressures over the past half-year. Moreover, Treasury auctions generally continued to be well received by investors. (See the box "Liquidity Conditions in the Bond Market" on pages 20-21 of the July 2015 Monetary Policy Report.)
As in the Treasury market, liquidity conditions in the agency MBS market were generally stable. Dollar-roll-implied financing rates for production-coupon MBS--an indicator of the scarcity of agency MBS for settlement--suggested limited settlement pressures in these markets over the first half of 2015.
. . . as were short-term funding markets
Conditions in short-term dollar funding markets also remained broadly stable during the first half of 2015. Both unsecured and secured money market rates have stayed at modestly higher levels since late 2014 but continued to be close to the average rates observed since the federal funds rate reached its effective lower bound. Secured money markets generally functioned smoothly, but rates in these markets experienced some volatility in the first half of 2015, particularly around quarter-ends, consistent with moderate quarter-end funding pressures. Unsecured offshore dollar funding markets generally did not exhibit signs of stress.
Money market participants continued to focus on the ongoing testing of the Federal Reserve's monetary policy tools. The overnight reverse repurchase agreement (ON RRP) operations have continued to provide a soft floor for money market rates, and the combination of term and ON RRP operations supported these rates around quarter-ends.
Broad equity price indexes and stock market volatility were both little changed, on net, and risk spreads on speculative-grade corporate bonds narrowed slightly
Despite higher interest rates and notable declines in Wall Street analysts' projections for corporate earnings, broad measures of U.S. equity prices were little changed, on balance, over the first half of the year. Stock prices for firms in the utilities sector, which are more sensitive to interest rates, fell substantially. Implied volatility for the S&P 500 index, as calculated from options prices, was little changed, on net, and remained below its historical median level.
Corporate bond spreads for investment-grade firms were little changed and stayed close to their historical average levels. Spreads for speculative-grade bonds narrowed modestly--in part because of improvements for energy firms--and are somewhat below their historical norms. (For further related discussion, see the box "Developments Related to Financial Stability" on pages 24-25 of the July 2015 Monetary Policy Report.)
Bank credit expanded and bank profitability improved slightly
Aggregate credit provided by commercial banks increased at a solid pace in the first quarter of 2015. The expansion in bank credit reflected moderate loan growth coupled with continued expansion of banks' holdings of securities. The growth of loans on banks' books was generally consistent with the SLOOS reports of increased loan demand for most loan categories and further easing of lending standards for real estate loans over the first quarter of 2015. Meanwhile, delinquency and charge-off rates continued to improve across most major loan types.
Measures of bank profitability remained below their historical averages but improved slightly in the first quarter of 2015. Several subcomponents of noninterest income increased, although declining net interest margins continued to put downward pressure on the profitability of banks. Equity prices of large domestic bank holding companies (BHCs) have increased modestly, on net, since the end of last year. Credit default swap (CDS) spreads for large BHCs were about unchanged on balance.
The M2 measure of the money stock has increased at an average annualized rate of about 6 percent since January, somewhat faster than the pace of nominal GDP growth. Demand for liquid deposits and currency has continued to boost M2 growth.
Municipal bond markets functioned smoothly, but some issuers remained strained
Credit conditions in municipal bond markets have generally remained stable since the end of last year. Over that period, the MCDX--an index of CDS spreads for a broad portfolio of municipal bonds--increased slightly, while ratios of yields on 20-year general obligation municipal bonds to those on comparable-maturity Treasury securities moved down a bit.
Nevertheless, significant financial strains were still evident for some issuers. In particular, Puerto Rico, which continued to face challenges from subdued economic performance, severe indebtedness, and other fiscal pressures, could reportedly seek to restructure at least part of its debt.
International Developments
Sovereign bond yields are higher . . .
After declining, on balance, during the first few months of the year, sovereign yields in the advanced foreign economies (AFEs) began to climb rapidly in late April. In Germany, long-term yields traded at record lows in mid-April, in part in response to the initiation of the public-sector purchase program of the European Central Bank (ECB). However, the 10-year government bond yield subsequently rose about 60 basis points. Most of this rise appeared to reflect an increase in the term premium, which had likely become very low earlier in the year. However, the timing of this increase has no clear explanation. The rise in German yields also appeared to reflect higher expected short-term rates, which rose, at least in part, in response to euro-area inflation data that came in higher than had been expected. (For more discussion, see the box "Monetary Policy and Interest Rates in Advanced Economies" on page 27 of the July 2015 Monetary Policy Report.) More recently, however, German yields have moved back down some in reaction to developments in Greece.
Sovereign yields rose even more in other euro-area countries, especially in Greece. Since the previous report, negotiations among the Greek government, other European authorities, and the International Monetary Fund (IMF) over official financial assistance to Greece have been protracted. In late June, Greek authorities decided to hold a referendum on their creditors' proposals, stalling negotiations and resulting in the cash-strapped Greek government missing a payment of €1-1/2 billion in principal to the IMF. With fears of a potential exit from the euro area and acute problems at Greek banks accelerating withdrawals of Greek bank deposits, Greek authorities declared a bank holiday and imposed capital controls. Negotiations resumed after Greek citizens voted to reject the creditor proposals, but the closure of the banks contributed to a further deterioration of economic conditions in Greece. Over the previous weekend, Greece and its creditors reached a preliminary agreement to begin negotiations on a new financing and adjustment program, subject to Greece completing several prior actions. Greek sovereign spreads spiked at the end of June, and Italian and Spanish sovereign spreads rose modestly. These spreads have since retraced substantially; as a result, Greek spreads remain somewhat wider since mid-February, and Italian and Spanish spreads are little changed.
. . . and the dollar remains well above levels of a year ago
The foreign exchange value of the dollar rose appreciably in the second half of 2014 and early 2015. It has changed little, on balance, since then. The dollar is stronger against emerging market economy (EME) currencies since February, as U.S. yields have risen and concerns about economic prospects for the EMEs mounted.
Equities in Europe and Japan have moved higher this year, buoyed by encouraging macroeconomic data. The Nikkei increased roughly 15 percent, boosted by stronger-than-expected consumer price releases and strong corporate earnings in addition to continued quantitative easing. EME equity prices are also generally higher. Notably, the Shanghai Composite index has been unusually volatile. It soared 60 percent in the first five months of 2015, reportedly reflecting repeated monetary policy easing measures and increased investor leverage. However, since mid-June, the index has dropped about 20 percent, on net, even while Chinese authorities have introduced a number of measures to stem the decline, including the People's Bank of China providing direct liquidity support to fund stock purchases.
In numerous foreign economies, economic growth stepped down in the first quarter
Economic growth slowed in the first quarter in many of our main trading partners. In China, weakness in exports and the real estate sector led to a significant step-down in GDP growth in the first quarter. Weak exports also constrained growth in Mexico and the United Kingdom. GDP contracted around 1/2 percent in Brazil. And, in Canada, real GDP also contracted in the first quarter, in part because lower oil prices weighed on investment in the energy sector and severe winter weather depressed consumption. Recent economic data for the second quarter have been mixed.
By contrast, in the euro area and Japan, economic growth picked up during the first quarter of 2015, and data thus far point to solid growth during the second quarter. Growth in these economies continues to receive support from highly accommodative monetary policies and lower commodity prices. Nevertheless, the situation in Greece remains a concern for the euro area.
After falling significantly at the beginning of the year, foreign inflation began to recover but remained low
Largely reflecting the plunge in oil prices last year, headline inflation fell further early in the year in the AFEs and the EMEs. However, as energy prices rebounded during the first half of the year, monthly foreign inflation readings also began to turn up. Nevertheless, 12-month inflation in a number of major trading partners remained substantially below their central banks' target, including in the euro area, Japan, and the United Kingdom.
In response, foreign central banks maintained highly accommodative monetary policies
A number of foreign central banks eased monetary policy. Some central banks cut policy rates, including those in Canada, China, India, and Korea. In several cases, including in Denmark, Sweden, and Switzerland, these cuts included moves that left policy rates negative. In addition to cutting benchmark rates, the People's Bank of China also lowered the reserve requirement ratio. The ECB launched a program to purchase public-sector securities, and the Bank of Japan continued to purchase assets at a rapid pace. Meanwhile, the Bank of England kept its policy rate at the historically low level of 0.5 percent, where it has been since March 2009.
Part 2: Monetary Policy
To support further progress toward maximum employment and price stability, the Federal Open Market Committee (FOMC) has kept the target federal funds rate at its effective lower bound and maintained the Federal Reserve's holdings of longer-term securities at sizable levels. At its two most recent meetings, the Committee indicated that it will be appropriate to raise the target range for the federal funds rate when it has seen further improvement in the labor market and is reasonably confident that inflation will move back to its 2 percent objective over the medium term. The Federal Reserve has continued to plan for the eventual normalization of monetary policy, including by testing the operational readiness of the policy tools to be used.
To support further progress toward its statutory objectives, the FOMC has kept the target federal funds rate at its lower bound . . .
The FOMC has maintained the target range of 0 to 1/4 percent for the federal funds rate to support continued progress toward its statutory objectives of maximum employment and price stability. The Committee has further reiterated that, in determining how long to maintain this target range, it will assess realized and expected progress toward its objectives. This assessment will continue to take into account a wide range of information, including measures of labor market conditions, indicators of inflation pressures and inflation expectations, and readings on financial and international developments. Based on its assessment of those factors, the Committee maintained the judgment at its January meeting that it could be patient in beginning to normalize the stance of monetary policy, and it stated at its March meeting that a start of the normalization process remained unlikely at its April meeting.9 Chair Yellen indicated that, subsequent to the April meeting, the FOMC would determine the timing of the initial increase in the target federal funds rate on a meeting-by-meeting basis, depending on its assessment of incoming economic information and its implications for the economic outlook.10
Specifically, the FOMC anticipates that it will be appropriate to raise the target range for the federal funds rate when it has seen further improvement in the labor market and is reasonably confident that inflation will move back to its 2 percent objective over the medium term. While the Committee has not decided on the timing of the initial increase in the target range for the federal funds rate, according to the June Summary of Economic Projections (SEP), 15 of the 17 policymakers anticipated that conditions may warrant a first increase in the federal funds rate target sometime this year. (The June SEP is included as Part 3 of the July 2015 Monetary Policy Report on pages 37-50; it is also included in section 9 of this annual report.)
The Committee has reiterated that, when it decides to begin to remove policy accommodation, it will take a balanced approach consistent with its longer-run goals of maximum employment and inflation of 2 percent. Even after the initial increase in the target federal funds rate, the Committee's policy is likely to remain highly accommodative in order to support continued progress toward its objectives of maximum employment and 2 percent inflation.
In addition, the Committee continues to anticipate that, even after employment and inflation are near mandate-consistent levels, economic conditions may, for some time, warrant keeping the target federal funds rate below levels the Committee views as normal in the longer run. As pointed out by Chair Yellen in her recent press conferences, FOMC participants provide a number of explanations for this view, with many citing the residual effects of the financial crisis.11 These effects are expected to ease gradually, but they are seen as likely to continue to constrain spending and credit availability for some time.
. . . and stressed that its policy decisions will be data dependent
In her recent speeches and press conferences, Chair Yellen emphasized that, while the return of the federal funds rate to a more normal level is likely to be gradual, forecasts of the appropriate path of the federal funds rate are conditional on individual projections for economic output, inflation, and other factors, and the Committee's actual policy decisions over time will be data dependent. The FOMC does not intend to embark on any predetermined course of tightening following an initial decision to raise the federal funds rate target range. Accordingly, if the expansion proves to be more vigorous than currently anticipated and inflation moves higher than expected, then the appropriate path would likely follow a higher and steeper trajectory; conversely, if conditions were to prove weaker, then the appropriate trajectory would be lower and less steep.
The size of the Federal Reserve's balance sheet has remained stable
The Committee has maintained its existing policy of reinvesting principal payments from its holdings of agency debt and agency mortgage-backed securities (MBS) in agency MBS and of rolling over maturing Treasury securities at auction. This policy, by keeping the Federal Reserve's holdings of longer-term securities at sizable levels, is expected to help maintain accommodative financial conditions by putting downward pressure on longer-term interest rates and supporting mortgage markets. In turn, those effects are expected to contribute to progress toward both the maximum employment and price-stability objectives of the FOMC.
After the conclusion of the large-scale asset purchase program at the end of October 2014 and with the continuation of the Committee's reinvestment policy, the Federal Reserve's total assets have held steady at around $4.5 trillion. Holdings of U.S. Treasury securities in the System Open Market Account (SOMA) have remained at $2.5 trillion, and holdings of agency debt and agency MBS at $1.8 trillion. Consequently, total liabilities on the Federal Reserve's balance sheet were largely unchanged.
Given the Federal Reserve's large securities holdings, interest income on the SOMA portfolio has continued to support substantial remittances to the U.S. Treasury Department. The Federal Reserve provided $96.9 billion of such distributions to the Treasury in 2014 and $21.7 billion during the first quarter of 2015. 12 Remittances total over $500 billion on a cumulative basis since 2008.
The FOMC continued to plan for the eventual normalization of monetary policy . . .
FOMC meeting participants have continued their discussions about the eventual normalization of the stance and conduct of monetary policy. 13 The participants emphasized that, during the early stages of policy normalization, it will be a priority to ensure appropriate control over the federal funds rate and other short-term interest rates. Consequently, the discussions involved various tools that could be used to control the level of short-term interest rates, even while the balance sheet of the Federal Reserve remains very large, as well as approaches to eventually normalizing the size and composition of the Federal Reserve's balance sheet.
As was the case before the crisis, the Committee intends to adjust the stance of monetary policy during normalization primarily through actions that influence the level of the federal funds rate and other short-term interest rates. The Committee indicated that, when economic conditions warrant the commencement of policy firming, the Federal Reserve intends to continue to target a range for the federal funds rate that is 25 basis points wide, set the interest rate it pays on excess reserves (the IOER rate) equal to the top of the target range for the federal funds rate, and set the offering rate associated with an overnight reverse repurchase agreement (ON RRP) facility equal to the bottom of the target range for the federal funds rate. The Committee will further allow aggregate capacity of the ON RRP facility to be temporarily elevated to support policy implementation and will use other tools, such as term operations, as necessary. The Committee expects that it will be appropriate to reduce the capacity of the facility fairly soon after it commences policy firming. Regarding the balance sheet, the Committee intends to reduce securities holdings in a gradual and predictable manner primarily by ceasing to reinvest repayments of principal on securities held in the SOMA. The Committee noted that economic and financial conditions could change, and that it was prepared to make adjustments to its normalization plans if warranted. (For more information, see the box "Policy Normalization Principles and Plans: Additional Details" on page 35 of the July 2015 Monetary Policy Report.)
. . . including by testing the policy tools to be used
The Federal Reserve continued to test the operational readiness of its policy tools, conducting daily ON RRP operations and a series of term RRP operations. At its March meeting, the Committee approved further tests of term RRP operations over quarter-ends through January 2016. 14 In addition, the Federal Reserve conducted two further series of Term Deposit Facility (TDF) operations. In these TDF operations, the Federal Reserve eliminated the three-day lag between the execution of an operation and settlement that existed in previous tests. These operations showed that bank demand for term deposits continues to be strong even for incremental increases in yield.
To date, testing has progressed smoothly, and, in particular, short-term market rates have generally traded above the ON RRP rate, which suggests that the facility will be a useful supplementary tool for the FOMC in addition to the IOER rate to control the federal funds rate during the normalization process. Overall, testing operations reinforced the Federal Reserve's confidence in its view that it has the tools necessary to tighten policy at the appropriate time.
References
1. For further discussion of inferring inflation expectations from market-based measures, see the box "Challenges in Interpreting Measures of Longer-Term Inflation Expectations" in Board of Governors of the Federal Reserve System (2015), Monetary Policy Report (Washington: Board of Governors, February), www.federalreserve.gov/monetarypolicy/mpr_20150224_part1.htm. Return to text
2. The SLOOS is available on the Board's website at www.federalreserve.gov/boarddocs/snloansurvey. Return to text
3. More information on the Senior Credit Officer Opinion Survey on Dealer Financing Terms is available on the Board's website at www.federalreserve.gov/econresdata/releases/scoos.htm. Return to text
4. See Board of Governors of the Federal Reserve System (2015), "Federal Reserve Issues FOMC Statement," press release, December 16, www.federalreserve.gov/newsevents/press/monetary/20151216a.htm. Return to text
5. See Board of Governors of the Federal Reserve System (2014), "Federal Reserve Issues FOMC Statement on Policy Normalization Principles and Plans," press release, September 17, www.federalreserve.gov/newsevents/press/monetary/20140917c.htm. Return to text
6. Residual seasonality is the presence of a predictable seasonal pattern in data that have already been seasonally adjusted. For recent discussions of this issue, see Jason Furman (2015), "Second Estimate of GDP for the First Quarter of 2015," Council of Economic Advisers Blog, May 29, www.whitehouse.gov/blog/2015/05/29/second-estimate-gdp-first-quarter-2015; and
Charles E. Gilbert, Norman J. Morin, Andrew D. Paciorek, and Claudia R. Sahm (2015), "Residual Seasonality in GDP," FEDS Notes (Washington: Board of Governors of the Federal Reserve System, May 14), www.federalreserve.gov/econresdata/notes/feds-notes/2015/residual-seasonality-in-gdp-20150514.html. The Bureau of Economic Analysis discusses its plans to revise seasonal adjustment procedures for GDP in its upcoming annual revision in Stephanie H. McCulla and Shelly Smith (2015), "Preview of the 2015 Annual Revision of the National Income and Product Accounts," Bureau of Economic Analysis, Survey of Current Business (June), www.bea.gov/scb/pdf/2015/06%20June/0615_preview_of_2015_annual_revision_of_national_income_and_product_accounts.pdf. Return to text
7. The SLOOS is available on the Board's website at www.federalreserve.gov/boarddocs/snloansurvey. Return to text
8. The results of the Survey of Primary Dealers and of the Survey of Market Participants are available on the Federal Reserve Bank of New York's website at www.newyorkfed.org/markets/primarydealer_survey_questions.html ![]() and www.newyorkfed.org/markets/survey_market_participants.html
and www.newyorkfed.org/markets/survey_market_participants.html ![]() , respectively. Return to text
, respectively. Return to text
9. See Board of Governors of the Federal Reserve System (2015), "Federal Reserve Issues FOMC Statement," press release, January 28, www.federalreserve.gov/newsevents/press/monetary/20150128a.htm; and Board of Governors of the Federal Reserve System (2015), "Federal Reserve Issues FOMC Statement," press release, March 18, www.federalreserve.gov/newsevents/press/monetary/20150318a.htm. Return to text
10. See Board of Governors of the Federal Reserve System (2015), "Transcript of Chair Yellen's FOMC Press Conference," March 18, www.federalreserve.gov/mediacenter/files/FOMCpresconf20150318.pdf; and Board of Governors of the Federal Reserve System (2015), "Transcript of Chair Yellen's Press Conference," June 17, www.federalreserve.gov/mediacenter/files/FOMCpresconf20150617.pdf. Return to text
11. See Board of Governors, "Transcript of Chair Yellen's FOMC Press Conference," March 18, and Board of Governors, "Transcript of Chair Yellen's Press Conference," June 17, in note 5. Return to text
12. See Board of Governors of the Federal Reserve System (2015), "Federal Reserve System Publishes Annual Financial Statements," press release, March 20, www.federalreserve.gov/newsevents/press/other/20150320a.htm; and Board of Governors of the Federal Reserve System (2015), Quarterly Report on Federal Reserve Balance Sheet Developments (Washington: Board of Governors, May), www.federalreserve.gov/monetarypolicy/files/quarterly_balance_sheet_developments_report_201505.pdf. Return to text
13. See Board of Governors of the Federal Reserve System (2015), "Minutes of the Federal Open Market Committee, March 17-18, 2015," press release, April 8, www.federalreserve.gov/newsevents/press/monetary/20150408a.htm; and Board of Governors of the Federal Reserve System (2015), "Minutes of the Federal Open Market Committee, April 28-29, 2015," press release, May 20, www.federalreserve.gov/newsevents/press/monetary/20150520a.htm. Return to text
14. See Board of Governors, "Minutes of the Federal Open Market Committee, March 17-18, 2015," in note 8. Return to text
