FEDS Notes
January 10, 2019
The Information in Interest Coverage Ratios of the US Nonfinancial Corporate Sector
Francisco Palomino, Stephen Paolillo, Ander Perez-Orive, and Gerardo Sanz-Maldonado1
- Summary
The interest coverage ratio (ICR)--defined as the ratio of earnings before interest and taxes to interest expenses--is an indicator of the ability of a company to make interest payments using internal cash flows. As such, numerous studies suggest that the level of the ICR can be an important indicator of financial distress with valuable insights for government policy decisions. For instance, some studies argue that monetary policy operates in part by affecting corporate ICRs because changes in the policy interest rate tend to affect interest expenses and corporate profits in the opposite direction.2 These studies also show that the transmission of monetary policy is stronger when ICRs are low.3 The literature, however, is less clear on what value of an ICR should be considered critically low.4
Using firm-level data, we find significant variability in interest coverage ratios--across firms and economic sectors and across time--that suggests that critical ICR levels depend on firm- or sector-specific economic conditions. In fact, simple regressions of default rates on ICRs show that the same ICR level is associated with different default rates across industries. Based on this evidence, we turn to study ICR thresholds specified in debt contract covenants. These are thresholds below which there is a technical default and, as such, can be interpreted as distress ICR levels. We build a model that predicts these ICR distress thresholds for each firm using industry fixed effects and firm balance sheet variables, and find significant threshold variability across firms and sectors and across time. We use the model estimates to construct an economy-wide ICR-based corporate vulnerability index that tracks the share of corporate debt in firms' balance sheets with an ICR below their relevant distress thresholds. This index displays a very strong countercyclical pattern since the 1970s and particularly high levels in the late 1980s and in the Great Recession. In addition, our index is useful in explaining the variance in the 1-8 quarter ahead growth of six indicators of economic activity: payroll employment, the civilian unemployment rate, the index of industrial production, private domestic fixed investment, real GDP, and aggregate default rates. The index has better predictive power at long horizons than the Excess Bond Premium (EBP) and the FRB of Chicago National FCI (NFCI), suggesting that it captures features of financial conditions that have very persistent effects on economic activity.
- Aggregate and Sectoral Interest Coverage Ratios
We construct annual interest coverage ratios from 1970 to 2017 at firm, industry, and aggregate levels for the US nonfinancial corporate sector using the Standard & Poor's Compustat database.5 The ICR of a specific firm in a fiscal year is calculated as the ratio of earnings before interest and taxes (EBIT) for the firm in that year to its interest expenses in the same year. Similarly, the ICR for a particular group of firms (e.g. an industry or the entire nonfinancial corporate sector) is calculated as the ratio of the aggregate EBIT for the group of firms to the aggregate interest expenses of the group.
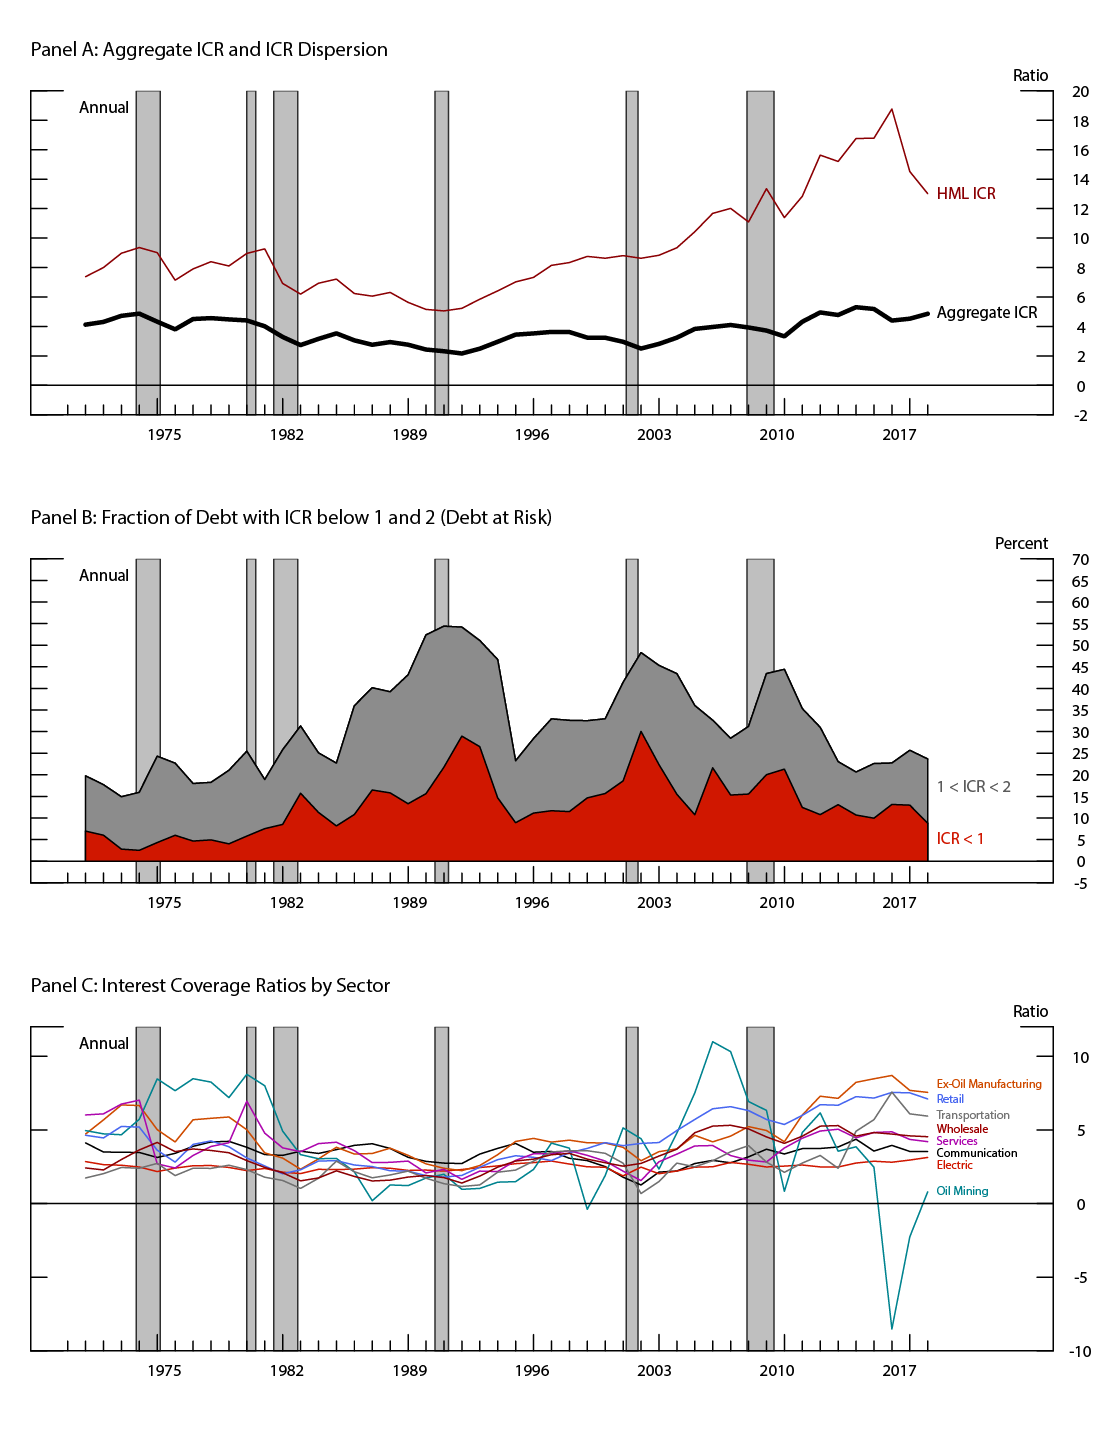
Table 1 reports several ICR descriptive statistics for the US non-financial corporate sector (labeled as "All") and for its constituent industries. The average ICR column shows that the nonfinancial corporate sector in our sample has an average ICR of around 3.7; that is, EBIT covers almost 4 times interest expenses, on average. The column also shows some variation across industries in average ICRs, with industries with low average ICRs such as Electricity (2.5) and Transportation (2.7), and industries with high average ICRs such as Ex-Oil Manufacturing (4.7) and Retail (4.3). The next two columns in Table 1 report averages of measures of dispersion in ICRs within a group. Our first dispersion measure, the column labeled "HML ICR," is the average difference in the ICR of a group of firms with high ICRs and a group of firms with low ICRs for each sector. Each year, the groups with high and low ICR firms are formed by including those firms with the highest and lowest ICRs for that year, respectively. Each group is determined such that the fraction of the debt of its constituent firms is 25 percent of the total debt in the sector.6 Our second dispersion measure is the percentage of debt in the sector with an ICR less than 2. We refer to this debt as "debt at risk." While HML ICR captures both upward and downward dispersion in ICRs across firms in a sector, the percentage of debt at risk only captures downward dispersion. The two measures show significant average dispersion in aggregate and across industries. The average HML ICR for the nonfinancial corporate sector is about 9.4, or around 2.5 times the average ICR. In addition, about one third of the firms--measured by debt size--in the corporate sector has ICRs lower than 2, on average. Across industries, sectors such as Electricity and Communications have low average HML ICRs, and industries such Ex-Oil Manufacturing and Services have significantly higher average HML ICRs. The average percentages of debt at risk also vary across industries, reaching as low as 24 percent for Communications and as high as 47 percent for Services. In sum, there is significant variation across firms and industries in interest coverage ratios.
Table 1: Interest Coverage Ratio Statistics: 1970-2017
| Sectors | Average ICR | ICR Dispersion | Correlation with Output Gap | |||
|---|---|---|---|---|---|---|
| HML ICR | Percentage of Debt at Risk (ICR<2) | Average ICR | HML ICR | Percentage of Debt at Risk (ICR<2) | ||
| All | 3.71 | 9.35 | 31.66 | -0.02 | -0.14 | -0.04 |
| Communication | 3.35 | 5.09 | 23.93 | -0.31 | 0.03 | 0.14 |
| Electric | 2.49 | 2.92 | 23.17 | 0.01 | -0.06 | 0.37 |
| Ex-Oil Manufacturing | 4.71 | 12.95 | 33.06 | 0.01 | -0.14 | 0.00 |
| Oil mining | 3.89 | 10.07 | 37.14 | 0.07 | -0.11 | -0.07 |
| Retail | 4.25 | 8.67 | 31.59 | -0.02 | 0.01 | -0.03 |
| Services | 3.73 | 12.20 | 46.64 | 0.04 | -0.06 | -0.24 |
| Transportation | 2.72 | 8.06 | 45.22 | 0.18 | -0.16 | -0.18 |
| Wholesale | 3.27 | 7.57 | 38.58 | -0.06 | -0.19 | -0.16 |
Note: "All" refers to the whole nonfinancial corporate sector. Industries are constructed based on division SIC codes. Data is filtered to only include firms with leverage greater than 5%, interest expenses greater than 500 million, and a non-missing ICR.
Source: S&P Global Market Intelligence, Compustat.
For all panels: Shaded bars designate recessions as defined by the NBER.
Source: S&P Global Market Intelligence, Compustat.
There is also significant variation in interest coverage ratios over time, as shown in Figure 1. Panel A shows that the aggregate ICR has fluctuated between 2 and 6 since 1970, and tends to decrease during recessions. However, the contemporaneous correlation of this variable and the output gap in Table 1 is weak.7 Panel A also shows that the difference between firms with high and low ICRs, as measured by HML ICR, has fluctuated between 6 and 20 percent. Interestingly, this difference has widened persistently from levels around 5 in the early 1990s to around 19 percent in 2015, suggesting increased dispersion in ICRs over time. As in the case of the aggregate ICR, the HML ICR tends to decline during recessions. Panel B of Figure 1 shows the evolution of the fraction of debt risk over time, measured for levels of ICR less than 1 and between 1 and 2. Both fractions show a similar pattern: the fraction of debt at risk tends to increase during recessions. Additionally, there is a large variability in the dispersion of ICRs, as the fraction of debt of firms with ICR less than 2 has fluctuated between 20 and 50 percent over time. Panel C of Figure 1 shows the evolution over time of ICRs across industries, highlighting significant differences in the variability and cyclicality of these ICRs. While the ICR in sectors such as Communications tends to be stable over time, the ICR of sectors such as Oil Mining is very volatile. Variation across industries is also suggested by the correlations of the fraction of debt at risk with the output gap in the last column of Table 1, this fraction tends to be procyclical in sectors such as Electricity, and countercyclical for Services. In general, however, these correlations are low.
- Interest Coverage Ratios and a Corporate Vulnerability Index
The significant variability we report in ICRs over time and across and within industries suggests that the critical level of ICR below which a firm is in financial distress may also vary across firms and depend on conditions particular to the firm or its industry. For instance, while an ICR of 3 can be a level of concern for a particular firm, the same level could be very adequate for another firm. Some firms that enjoy stable cash flows and easy access to external finance (they hold large amounts of collateral, for example) might be able to manage persistently low ICRs. On the other hand, firms with risky cash flows and poor access to external funds might need to maintain high ICRs to be considered creditworthy and financially stable. In this section, we study the link between ICRs and different distress indicators to introduce an economy-wide ICR-based measure of the share of vulnerable corporate debt--defined as the share of corporate debt in firms' balance sheets with an ICR below their relevant distress threshold. First, we link default rates to interest coverage ratios to illustrate how critical ICR thresholds vary across industries. Second, we study the determinants of the minimum ICR thresholds written into loan covenants to construct our vulnerability index.
- Critical ICR Thresholds Based on Default Rates
Damodaran (2014) suggests that ICRs can be used to estimate the probability of default for firms or debt with no credit rating. We follow this approach and run contemporaneous regressions of default rates on interest coverage ratios for the nonfinancial corporate sector and for its individual industries. We find significant negative coefficients in these regressions for most sectors, indicating that lower ICRs are associated to higher default rates. The R-squared of the significant regressions are between 0.12 (Transportation) and 0.49 (Oil Mining). For those sectors with significant regression coefficients, we compute the level of ICR that corresponds to a particular default rate. Figure 2 shows significant differences across sectors for these ICR levels using default rates of 1.5 percent and 3 percent. For instance, for the nonfinancial corporate sector (All), an ICR around 3.4 is associated with a default rate of 1.5 percent and an ICR around 1.7 is associated with a default probability of 3 percent. The corresponding ICR levels for Communications are around 3.3 and 2.8, respectively, and for Retail are around 5.1 and 2.7, respectively. These differences imply that the same ICR level is associated to different default rates across sectors, and that the sensitivity of default rates to changes in ICR levels is different across sectors. This result highlights that a simple reading of a low ICR level for a firm may provide a misleading signal of distress. To overcome this limitation, we analyze ICR threshold levels in debt covenants.
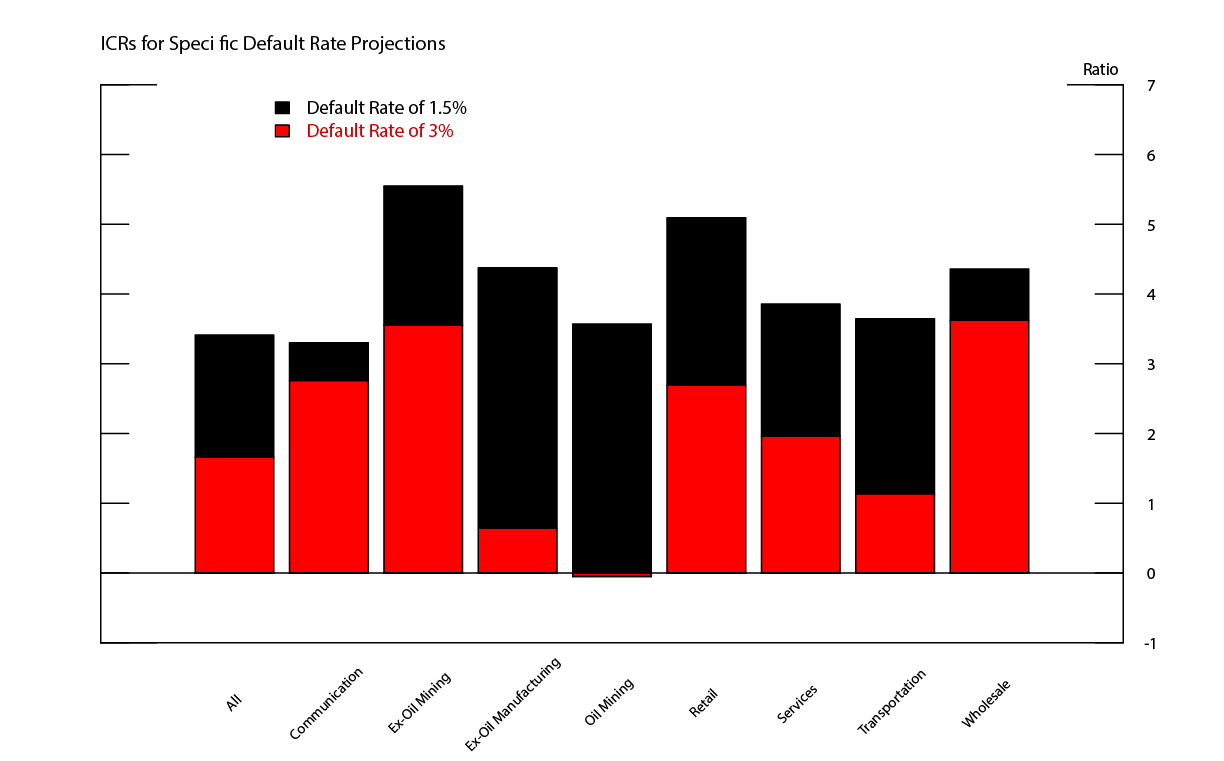
Source: S&P Global Market Intelligence, Compustat; Moody's Analytics, Inc., CreditView.
- Critical ICR Thresholds Based on Debt Covenants
Some lenders specify in their debt contract covenants an ICR threshold below which the borrower is considered to be in technical default. These contractual thresholds can be thought of as distress levels of ICRs. We obtain detailed information on covenants on new loan originations from LPC DealScan. Some descriptive statistics of loan covenant thresholds for ICRs by industry are displayed in Table 2. There is large cross-industry variation in ICR thresholds for loans in different industries. Risky industries with poor access to external debt financing (such as Computer Equipment, Chemicals, or Business Services) require large ICRs, while safer industries with easy access to credit (Credit Institutions, Investment Companies, or Communications Companies) are allowed to have lower ICRs.
Table 2: Interest Coverage Ratios Thresholds in Loan Covenants
| Industry | Median ICR Covenant | 10th Percentile | 90th Percentile |
|---|---|---|---|
| Top Three | |||
| Security & Commodity Brokers | 4.00 | 1.75 | 5.00 |
| Chemical & Allied Products | 3.00 | 1.60 | 4.00 |
| Industrial Machinery & Equipment | 3.00 | 1.55 | 4.00 |
| Bottom Three | |||
| Holding & Other Investment Offices | 2.00 | 1.50 | 2.75 |
| Communications | 2.00 | 1.25 | 3.00 |
| Nondepository Institutions | 1.00 | 1.10 | 2.75 |
Note: Loan covenant ICR thresholds for the top 3 and bottom three 2-digit SIC industries in terms of their median ICR thresholds.
Source: Thomson Reuters LPC Dealscan.
We use DealScan information in combination with detailed firm-level data from Compustat to generate a predictive regression of the relevant ICR threshold at the firm level. Our firm-level predictors include industry, firm size, book leverage, cash holdings, and profitability. Table 3 displays the regression results and shows that large firms with low leverage and high cash holdings and profits are more likely to face higher ICR thresholds in their loan contracts.8 The regressions include industry fixed effects (at the 2-digit SIC level) that capture a significant amount of the variation.
Table 3: Regression of Distress ICR Thresholds on Firm Characteristics
Predicting ICR Covenants - Regression Results
| Book Leverage | Cash/Assets | Assets | Profitability | Industry Dummies | Constant |
|---|---|---|---|---|---|
|
-0.00671** (0.00320) |
0.751*** (0.112) |
0.0890*** (0.00674) |
4.083*** (0.367) |
Yes |
1.615*** (0.205) |
Observations: 7,183
R-squared: 0.146
Standard errors in parentheses. *** p<0.01, ** p<0.05, * p<0.1
Source: Thomson Reuters LPC Dealscan; S&P Global Market Intelligence, Compustat.
- A Corporate Debt Vulnerability Index
We use our firm-level predicted ICR thresholds to classify all Compustat firm-year-quarters into "vulnerable" or "not vulnerable". We focus on the DealScan-based ICR thresholds as they allow us to use firm-level information to predict relevant ICR thresholds, as opposed to the default-based indicators, which are calculated at the industry level. We then aggregate every quarter all debt outstanding held by firms whose ICR is below their distress threshold and divide it by the total amount of debt outstanding that quarter in our sample of Compustat firms. The resulting share is our estimate of the aggregate share of vulnerable debt, which we name as the Corporate Debt Vulnerability Index. The evolution of this index over time is shown in Figure 3. This index displays a very strong countercyclical pattern since the 1970s, with particularly high levels in the late 1980s and in the Great Recession.
We evaluate if our corporate debt vulnerability index has predictive power for forecasting future economic activity. To assess the performance of this index, Table 4 reports the ability of the vulnerability index to forecast over 4- and 8-quarter horizon the growth rate of three different measures of real economic activity: payroll employment, private domestic fixed investment, and real GDP.9
Following Gilchrist and Zakrajsek (2012), the forecasting regression is:
$$$$ y_{t+h} - y_t = \beta_0 + \sum_{i=1}^\iota \beta_i \Delta y_{t+1-i} + \gamma_0{Spread}_t + \gamma_1{FFR}_t + \delta {FCI}_t + \varepsilon_{t+h}, $$$$
where yt denotes the indicator of real economic activity at time t (the log of payroll employment, private domestic fixed investment, or real GDP), h is the forecast horizon, $$\Delta$$ is the first-difference operator, $$\iota$$ is the number of lags of the dependent variable, Spread is the slope of the Treasury curve (10-year Treasury yield minus 3-month T-bill), FFR is the level of the real fed funds rate, and FCIt is a financial conditions index, which could be our corporate debt vulnerability index, the Excess Bond Premium (EBP), the FRB of Chicago National FCI (NFCI), or the Moody's BAA-Treasury spread. The data are quarterly, from 1974Q4-2018Q1.
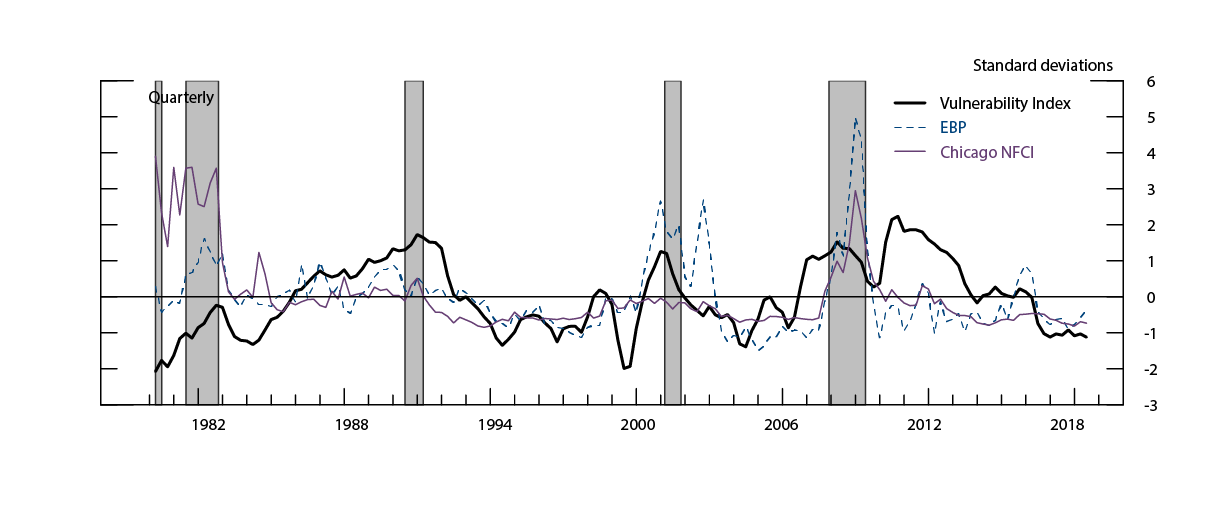
The figure plots the EBP of Gilchrist and Zakrajsek (2012), the Chicago−Fed National Conditions Index, and our Corporate Debt Vulnerability Index. Positive (negative) values of the indices indicate tighter (looser) financial conditions. Shaded areas denote NBER recessions.
Source: S&P Global Market Intelligence, Compustat; Thomson Reuters LPC Dealscan; Federal Reserve Bank of Chicago; Federal Reserve Board.
Each of the three panels in Table 4 has four columns that report results of predictive regressions at different horizons which exclude (columns 1-2) or include (columns 3-4) controls that capture alternative indicators of financial conditions.
The results suggest that our Corporate Debt Vulnerability Index is useful in explaining the variance in the 4 and 8-quarter ahead growth of the three selected indicators of economic activity. An increase in the index--which signals a deterioration of corporate financial conditions--is associated with a decrease in future economic activity. While our index, the Excess Bond Premium (EBP), and the FRB of Chicago National FCI (NFCI) all have economically and statistically significant explanatory power at shorter horizons (4 quarters), our index has superior predictive power at longer horizons (8 quarters), particularly relative to the EBP. This observation suggests that our index captures features of financial conditions that have very persistent effects on economic activity.10
There are at least two channels through which this strong predictive power of our index might come about. First, because the investment of financially constrained firms is sensitive to internal funds, a critical reading of our index--which indicates that many firms are dedicating a large fraction of their operating profits to interest payments--might be associated with low investment by these firms and, in turn, low aggregate output. Second, because many debt contracts feature covenants that limit how low ICRs can go, a critical reading of our index might be associated with an increase in covenant violations. Following a covenant violation, lenders gain control rights over the violating firm's actions and typically reduce investment. It is beyond the scope of this note to study these mechanisms, which we leave for future study.
Table 4: Predictive Regressions Using the Corporate Vulnerability Index
Panel A: Real GDP Growth
| VARIABLES | (1)∆GDPt,t+4 | (2)∆GDPt,t+8 | (3)∆GDPt,t+4 | (4)∆GDPt,t+8 |
|---|---|---|---|---|
| Vulnerability Index |
-15.07*** (3.476) |
-11.39*** (3.276) |
-14.41*** (3.475) |
-10.56*** (3.418) |
| Term Spread |
0.342* (0.185) |
0.493** (0.229) |
0.400** (0.166) |
0.573*** (0.214) |
| Real FFR |
0.0845 (0.157) |
0.0626 (0.119) |
0.115 (0.155) |
0.0694 (0.107) |
| EBP |
-0.824* (0.433) |
-0.448 (0.303) |
||
| NFCI |
0.245 (0.370) |
0.428** (0.192) |
||
| Constant |
8.607*** (1.742) |
6.122*** (1.635) |
8.559*** (1.751) |
5.931*** (1.647) |
| Observations | 164 | 156 | 164 | 156 |
| Adj. R-squared | 0.5163 | 0.5773 | 0.5229 | 0.5875 |
Panel B: Employment Growth
| VARIABLES | (5)∆EMPLt,t+4 | (6)∆EMPLt,t+8 | (7)∆EMPLt,t+4 | (8)∆EMPLt,t+8 |
|---|---|---|---|---|
| Vulnerability Index |
-6.099*** (1.690) |
-5.345*** (1.996) |
-6.523*** (2.023) |
-5.076** (2.294) |
| Term Spread |
0.416*** (0.0856) |
0.430*** (0.0790) |
0.334*** (0.0971) |
0.425*** (0.0924) |
| Real FFR |
0.0486 (0.0714) |
0.102 (0.0643) |
0.113 (0.0828) |
0.122* (0.0672) |
| EBP |
-0.628** (0.241) |
-0.314* (0.169) |
||
| NFCI |
-0.352** (0.176) |
-0.0503 (0.139) |
||
| Constant |
2.371*** (0.636) |
2.313*** (0.713) |
2.853*** (0.807) |
2.264*** (0.845) |
| Observations | 165 | 157 | 165 | 157 |
| Adj. R-squared | 0.4436 | 0.4021 | 0.5191 | 0.4123 |
Panel C: Real Investment Growth
| VARIABLES | (9)∆INVt,t+4 | (10)∆INVt,t+8 | (11)∆INVt,t+4 | (12)∆INVt,t+8 |
|---|---|---|---|---|
| Vulnerability Index |
-43.26*** (10.62) |
-47.34*** (11.10) |
-38.80*** (10.55) |
-41.09*** (11.68) |
| Term Spread |
-0.242 (0.482) |
-0.0744 (0.623) |
-0.294 (0.470) |
0.0529 (0.466) |
| Real FFR |
-0.299 (0.360) |
-0.466 (0.391) |
-0.118 (0.353) |
-0.380 (0.338) |
| EBP |
-6.710*** (1.401) |
-5.060*** (0.935) |
||
| NFCI |
1.064 (0.913) |
2.027*** (0.665) |
||
| Constant |
24.40*** (4.778) |
27.64*** (5.270) |
24.73*** (4.915) |
26.77*** (5.011) |
| Observations | 165 | 157 | 165 | 157 |
| Adj. R-squared | 0.5186 | 0.4223 | 0.6137 | 0.5079 |
Standard errors in parentheses
*** p<0.01, ** p<0.1
Note: 4-quarter ahead and 8-quarter ahead predictive regressions include 5 and 9 lags, respectively, of the corresponding (one-quarter) dependent variable.
- Conclusion
The significant variability in interest coverage ratios across firms and industries and across time suggests that critical levels of ICRs that signal financial distress may also vary substantially and depend on firm- and sector-specific conditions. We use this insight and information in debt contract covenants to construct an index of corporate vulnerability based on the fraction of debt held by firms with ICRs below their relevant distress thresholds. This index is highly countercyclical and has significant power to predict measures of aggregate economic activity at different time horizons up to 8 quarters. A caveat to the analysis is that we focus only on publicly traded firms. It would be interesting to extend the analysis to include private firms.
References
Damodaran, Aswath, 2014. Applied Corporate Finance, 4th edition. Hoboken, NJ: Wiley.
Gertler, Mark and Simon Gilchrist, 1994. Monetary Policy, Business Cycles, and the Behavior of Small Manufacturing Firms. The Quarterly Journal of Economics, Vol. 109, No. 2 (May, 1994), pp. 309-340.
Ben S. Bernanke and Mark Gertler, 1995. Inside the Black Box: The Credit Channel of Monetary Policy Transmission. Journal of Economic Perspectives, vol. 9(4), pages 27-48, Fall.
Ippolito, Ozdagli, and Perez-Orive, 2018. The transmission of monetary policy through bank lending: The floating rate channel. Journal of Monetary Economics, 95, issue C, p. 49-71.
Ashish Kumbhat & Francisco J. Palomino & Ander Perez, 2017. "The Potential Increase in Corporate Debt Interest Rate Payments from Changes in the Federal Funds Rate," FEDS Notes 2017-11-15, Board of Governors of the Federal Reserve System (U.S.).
1. All authors are at the Board of Governors of the Federal Reserve System. The views expressed in this note do not necessarily reflect those of the Board of Governors, or its staff. We thank Chris Hollrah, a former research assistant at the Board, for assistance in an early stage of this project, and Michael Smolyansky, Jie Yang, and Min Wei for their helpful comments. Return to text
2. See Gertler and Gilchrist (1994) and Bernanke and Gerter (1995) for a discussion and evidence of the importance of ICRs for monetary policy transmission. Ippolito, Ozdagli, and Perez-Orive (2018) show that ICRs--and especially those of firms that use floating-rate debt--deteriorate significantly following contractionary monetary policy actions. Return to text
3. Peersman and Smets (2005) find that a lower average ICR in an industry is associated with a greater sensitivity to monetary policy changes. Return to text
4. For instance, the International Monetary Fund in its April 2017 Global Financial Stability Report refers to firms with an ICR of less than 1 as "weak," and firms with an ICR between 1 and 2 as "vulnerable." Kumbhat, Palomino and Perez-Orive (2017) report that the current aggregate ICR for the US nonfinancial corporate sector is above historical norms and, therefore, does not signal significant risks. Return to text
5. Compustat only reports information for publicly traded firms. In addition, we exclude in our calculations firms with a leverage--debt to total assets ratio--of less than 5 percent, interest expenses of less than 500 million dollars, and those with missing information to compute ICRs. We construct industries based on division SIC codes. Return to text
6. Specifically, the low and high ICR groups are constructed based on the first and fourth weighted quantiles of ICRs, respectively, where the weight of each firm is its share of total sector debt. Return to text
7. The output gap is defined as the deviation of output from potential output, measured as: (Real Gross Domestic Product – Real Potential Gross Domestic Product) / Real Potential Gross Domestic Product. Real Gross Domestic Product data are from the U.S. Bureau of Economic Analysis, and Real Potential Gross Domestic Product data are from the U.S. Congressional Budget Office (CBO). Return to text
8. The signs of some of the estimated coefficients are, perhaps, not very intuitive at first glance. For example, one would expect firms that are more likely to be distressed (small, unprofitable firms with high leverage) to face higher ICR thresholds, while the opposite is true in this database. First, it's important to acknowledge that loans feature several price and non-price terms that allow for some substitution between them during the negotiation of the loan contract. Firms might be willing to suffer tight covenants in exchange for lower spreads or longer maturities. Large, profitable firms might be more willing to engage in such a substitution. Second, omitted variables that might be correlated with these explanatory variables might account for part of these observations. For example, large firms are likely to be less volatile and, so, less likely to violate any given covenant and more flexible in their determination. Finally, firms with better creditworthiness might be less concerned about covenant violations. Indeed, Acharya, Almeida, Ippolito, and Perez-Orive (2018) find that large, rated firms are more likely to have their covenant violations waived than their smaller unrated counterparts. Return to text
9. In unreported results, we include additional measures of economic activity (the civilian unemployment rate, the index of industrial production, and aggregate default rates) and additional forecasting horizons (1, 2, 3, 5, 6, and 7 quarters). Our results are robust to these extensions. Return to text
Palomino, Francisco, Stephen Paolillo, Ander Perez-Orive, and Gerardo Sanz-Maldonado (2019). "The Information in Interest Coverage Ratios of the US Nonfinancial Corporate Sector," FEDS Notes. Washington: Board of Governors of the Federal Reserve System, January 10, 2019, https://doi.org/10.17016/2380-7172.2290.
Disclaimer: FEDS Notes are articles in which Board staff offer their own views and present analysis on a range of topics in economics and finance. These articles are shorter and less technically oriented than FEDS Working Papers and IFDP papers.