FEDS Notes
October 12, 2018
The Relationship between Macroeconomic Overheating and Financial Vulnerability: A Narrative Investigation
Elena Afanasyeva, Seung Jung Lee, Michele Modugno, Francisco Palomino 1
Introduction
An overheated economy has the potential to lead to financial imbalances, which in turn could generate or amplify economic distress. In two complementary FEDS notes, we study the link between macroeconomic performance and financial imbalances, focusing on the experience of the United States since the 1960s. In this note, we follow a narrative approach to review historical episodes of significant financial imbalances and examine whether these episodes were linked to macroeconomic overheating. In our second FEDS Note, The Relationship between Macroeconomic Overheating and Financial Vulnerability: A Quantitative Exploration, we look for evidence of a statistical link between measures of economic slack and financial system vulnerability. The complementarities between these two approaches provide a broader characterization of this link. Neither approach highlights a strong direct link between macroeconomic overheating and increased financial vulnerability.
Narrative approach
We rely on a meta-analysis of historical accounts--based on literature summarized in Table 1--to describe whether periods of overheating in the United States economy coincided with or were followed by a buildup of imbalances in the financial system. We also report on whether disturbances resulting from financial imbalances were followed by a material or limited economic downturn.
We look at the narratives of a comprehensive list of financial disturbances since 1960. The disturbances we consider arise from periods of credit crunches, banking crises, and financial market crashes. In our historical accounts, we also include a few episodes of financial stress that emanated from abroad and carried the potential for large adverse spillovers to the United States. Figure 1 highlights the most representative episodes, while Table 1 provides a summary of all analyzed episodes. We focus on the narrative surrounding the shaded historical periods of overheating in which either the unemployment rate in the United States was below the Federal Reserve Board staff's real-time estimate of its natural rate or in which the output gap was positive: 1964:Q1-1970:Q3, 1972:Q2-1974:Q3, 1978:Q1-1980:Q1, 1987:Q2-1990:Q3, 1997:Q2-2001:Q3, and 2005:Q3-2007:Q4.2
At first glance, Figure 1 shows a tendency for significant financial disturbances to occur during periods of macroeconomic overheating, consistent with the hypothesis that investors and intermediaries take greater risks during buoyant economic phases. Indeed, an index of overall financial vulnerability--the Aggregate Financial Vulnerability Index computed by the methodology in Aikman et al. (2015)--shows that vulnerabilities increased in the past two overheating periods.3 However, most of the increase in the Aggregate Financial Vulnerability Index leading up to the most recent Financial Crisis predates the associated overheating period. Furthermore, a more comprehensive account of financial events for a longer time horizon points to a more tenuous relationship between macroeconomic overheating and financial vulnerability in the United States.
Figure 1: Economic Overheating, Selected Financial Disturbances, and the Aggregate Financial Vulnerability Index
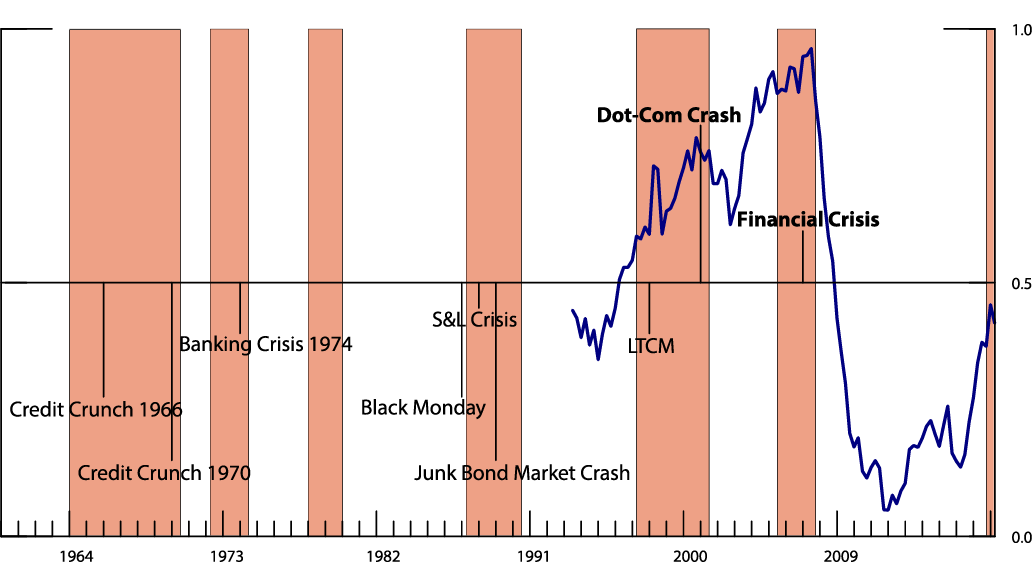
Note: Disturbances with stronger linkages to overheating are highlighted in bold. The Aggregate Financial Vulnerability Index, available since 1993, is computed using the methodology in Aikman et al. (2015).
We describe in chronological order the principal financial disturbance episodes in the context of macroeconomic overheating periods. More detailed references to the academic sources covered in our review are available in Table 1. While we take the view that financial disturbances are signs that an imbalance of some kind was building beforehand, which allows a broad consideration of financial imbalances, we do not precisely date the start of the buildup or quantify its evolution.
1964:Q1-1970:Q3
After a moderate recession, the early 1960s was a period of sustained output growth and a significant decline in the unemployment rate from levels around 7 percent in 1961 to around 4 percent in 1966, about 1 1/2 percentage points lower than its natural rate. This was also a period of high credit growth that coincided with the development of the commercial paper market and negotiable certificate of deposits as new sources of short-term funding. Banks, in turn, relied on such funding to invest more in high yield bonds. In the context of these financial innovations, tightening monetary policy and binding Regulation Q ceilings--which imposed restrictions on the payment of interest on savings and time deposits--contributed to the credit crunches during the 1964-1970 overheating period. The Credit Crunch of 1966 forced nonbank financial intermediaries to sell long-term illiquid assets at sizable losses. The duration of the credit crunch, however, was relatively brief and, indeed, the macroeconomic overheating continued. Afterward, a commercial paper default by Penn Central Transportation Company in 1970 marked the beginning of another Credit Crunch concentrated in the commercial paper market. Although emergency measures by the Federal Reserve Board (such as the suspension of Regulation Q rate ceilings on negotiable CDs of less than three months, and lending banks funds that could be lent to firms) helped avert a major financial crisis, this development effectively resulted in a tightening of lending standards and reduced borrowing capacity for businesses. However, when judged against the pronounced magnitude and duration of the overheating period (with real GDP growth above 4 percent over four years), the accompanying financial disruptions were moderate.
1972:Q2-1974:Q3
Real activity and credit were boosted by the commodity boom, monetary policy easing, and strong global growth in the early 1970s. During this period, real GDP growth averaged around 2 percent annually and the unemployment rate declined around 1 percentage point to levels close to 5 percent, around 1/2 percentage point lower than its natural rate. After this brief overheating period, as interest rates and loan volumes reached high levels, the failure of Franklin National Bank triggered a general pullback by investors that made it difficult even for the largest banks to count on rolling over their commercial paper funding.4 These events triggered the 1974 Banking Crisis that coincided with a severe recession (the unemployment rate climbed to almost 9 percent in June 1975). Although some authors cite this banking crisis as one of the elements contributing to the recession, other factors, such as the first oil shock and the 1973 tightening of U.S. monetary policy, are often cited as more important.
1978:Q1-1980:Q1
During the 1970s, large oil price shocks created significant current account surpluses among oil-exporting countries and current account deficits in many Latin American countries. Large U.S. banks served as intermediaries providing the oil-exporting countries with a liquid place for their funds while lending those funds (in U.S. dollars) to Latin America. During the overheating period of 1978-1980, real GDP growth in the United States averaged about 21/2 percent, starting from a position of already-high resource utilization, and the unemployment rate fell below 6 percent. In 1982, as interest rates were raised aggressively to fight inflation, Mexico was unable to service its outstanding debt to U.S. commercial banks and other creditors, marking the beginning of the Latin American Debt Crisis. Many Latin American countries rescheduled their public debt obligations and put strains on several of the largest banks in the United States.5 Regulatory forbearance in recognizing losses is considered to have been effective at forestalling greater panic and limited the negative macroeconomic consequences for the United States.
1987:Q2-1990:Q3
Concerns about large vulnerabilities in the financial system in the 1980s started to build up well before the overheating period at the end of the decade. During the 1980s expansion, spurred by the development of the speculative (high-yield) bond market, corporate leverage rose significantly. Meanwhile, the unemployment rate went from around 9 percent in early 1984 to around 5.3 percent by the end of 1988, and high interest rates continued to negatively impact the net worth of the Savings and Loan (S&L) sector as mortgages lost considerable value. Although there is a wide range of views about the dating of the onset of the S&L crisis, it is generally acknowledged that regulatory forbearance had the unintended effect of inducing S&Ls to make new and riskier loans other than residential mortgages, which expanded credit further but subsequently led to widespread insolvencies. Despite various interventions, around 1,400 S&Ls and 1,300 banks failed between 1984 and 1991. Some studies cite the S&L crisis as contributing importantly to the 1990-91 recession, while the Stock Market Crash in 1987 and the High-yield (Junk) Bond Market Crash in 1989 did not seem to have had a significant impact. The recession that followed is characterized as mild, as real GDP growth averaged around 1 1/2 percent and the unemployment rate reached a highest level of 7.6 percent in the first half of 1992.
1997:Q2-2001:Q3
The 1990s were characterized by solid economic growth amid various financial disruptions stemming from abroad, such as the Tequila Crisis, the Asian Financial Crisis, and the collapse of Long Term Capital Management.6 Timely coordinated policy interventions are considered to have substantially limited the imprint of these disruptions on economic activity. During this overheating period lasting 5 1/2 years, real GDP growth averaged about 3 3/4 percent and the unemployment rate mostly ranged between 4 and 5 1/2 percent. The expansionary economic conditions contributed to the domestic boom in telecom and internet firms amid euphoria over internet-based technologies, leading to rapidly rising equity prices. Eventually, the reversal in investor sentiment led to the Dot-Com Crash, which triggered a mild recession in the early 2000s, with the unemployment rate increasing from around 4 percent in September 2000 to 6.1 percent in June 2003. This financial episode provides the most compelling example of how overheating can lead to increased financial vulnerabilities and, in turn, how financial events can generate an economic downturn. However, compared with the relatively long overheating period, the accompanying financial disruptions and subsequent recession were modest.
2005:Q3-2007:Q4
During the overheating period from early 2005 to the Great Recession, real GDP growth averaged about 2 percent, fueled by a rapid growth of homebuilding, mortgage credit, and house prices. However, the elevated levels of leverage, exposure to maturity transformation, and wholesale short-term funding at large financial institutions that caused the Financial Crisis of 2007-09 had already built up before the onset of overheating during this period. Aikman et al. (2017), and Lee et al. (forthcoming) show that a comprehensive reading of vulnerabilities in the U.S. financial system was already elevated in 2004. Although some researchers link the buildup of those systemic vulnerabilities to macroeconomic overheating, others see those vulnerabilities as a consequence of independent financial engineering developments. In addition, others believe that accommodative monetary policy contributed to the buildup of financial vulnerability (e.g., Diamond and Rajan (2009) and Adrian and Liang (2018)). The Financial Crisis generated a severe recession with a subsequent sluggish recovery.
The Financial Crisis spread to the euro area resulted in bank bailouts and ballooning government deficits across Europe. A few European countries were unable to repay or refinance their government debt or to bail out over-indebted banks without the assistance of other euro area countries, the ECB, or the IMF, exacerbating weak economic activity in the region. Although the Euro Area Sovereign Debt Crisis, in turn, impacted financial markets in the United States, it is less clear whether there were permanent reverberations on real economic activity.
Conclusion
Although we document a tendency for significant financial disturbances to occur during periods of macroeconomic overheating, a literature review based on historical evidence does not support a strong direct link between macroeconomic overheating and the buildup of systemic financial vulnerabilities. Based on our narrative investigation, the buildup of major financial imbalances leading up to financial disruptions in the United States appears to have stemmed more from financial innovation and the development of different financial markets. Regulatory factors, policy regimes, and other external factors also appear to have played a more important role than macroeconomic overheating in inducing various financial disturbances. In particular, the imbalances that resulted in the S&L Crisis of the late 1980s are generally not considered related to overheating during that period. Although some researchers link the Financial Crisis of 2007-09 to macroeconomic overheating, much of the buildup of systemic vulnerabilities preceded the overheating phase. By contrast, the imbalances that resulted in the Dot-Com bust of the early 2000s--not widely regarded a systemic event--were most clearly associated with the strong performance of the United States economy. Finally, most financial disturbances in the United States since 1960 have left little imprint on the United States economy. In many cases, this may have been due to effective policy or regulatory interventions.
References
Adrian, Tobias and Nellie Liang (2018). "Monetary Policy, Financial Conditions, and Financial Stability." International Journal of Central Banking 14(1): 73 - 131.
Afanasyeva, Elena, Seung Jung Lee, Michele Modugno, and Francisco Palomino (2018). "The Relationship between Macroeconomic Overheating and Financial Vulnerability: A Quantitative Exploration," FEDS Notes. Board of Governors of the Federal Reserve System (US).
Aikman, David, Michael T. Kiley, Seung Jung Lee, Michael G. Palumbo, and Missaka N. Warusawitharana (2015). "Mapping Heat in the U.S. Financial System." Finance and Economics Discussion Series 2015-059. Board of Governors of the Federal Reserve System.
Aikman, David, Michael T. Kiley, Seung Jung Lee, Michael G. Palumbo, and Missaka N. Warusawitharana (2017). "Mapping Heat in the U.S. Financial System." Journal of Banking & Finance 81(C): 36 - 64.
Bordo, Michael, Barry Eichengreen, Daniela Klingebiel, and Maria Soledad Martinez‐Peria (2001). "Is the crisis problem growing more severe?" Economic Policy 16, no. 32: 52-82.
Bordo, Michael D. and Joseph G. Haubrich (2017). "Deep Recessions, Fast Recoveries, and Financial Crises: Evidence from the American Record," Economic Inquiry 55(1): 527 - 541.
Burger, Albert E. (1969). "A historical analysis of the credit crunch of 1966." Federal Reserve Bank of St. Louis Review 51, September: 13-30.
Claessens, Stijn, M. Ayhan Kose, and Marco E. Terrones (2012). "How do business and financial cycles interact?" Journal of International Economics 87: 178 - 190.
Diamond, Douglas W. and Raghuram G. Rajan (2009). "The Credit Crisis: Conjectures about Causes and Remedies." American Economic Review: Papers & Proceedings 99(2): 606-610.
Drehmann, Mathias, Claudio Borio, Leonardo Gambacorta, Gabriel Jimenez, and Carlos Trucharte (2010). "Countercyclical Capital Buffers: Exploring Options." BIS Working paper 317, July 2010.
Drehmann, Mathias, Claudio Borio and K. Tsatsaronis (2012) "Characterising the Financial Cycle: Don't Lose Sight of the Medium Term!" BIS Working Papers, no 380, June 2012.
Field, Alexander J. (2017). "The savings and loan insolvencies and the costs of financial crisis." Research in Economic History, 33: 65-113.
Howard, Greg, Robert Martin, and Beth Anne Wilson (2011). "Are Recoveries from Banking and Financial Crises Really So Different?" International Finance Discussion Papers 1037. Board of Governors of the Federal Reserve System.
Laeven, Luc and Fabian Valencia (2013). "Systemic Banking Crises Database." IMF Economic Review 61(2): 225-270.
Lee, Seung Jung, Kelly E. Posenau, and Viktors Stebunovs (forthcoming). "The Anatomy of Financial Vulnerabilities and Banking Crises." Journal of Banking & Finance.
Lo Duca, Marco, Anne Koban, Marisa Basten, Elias Bengtsson, Benjamin Klaus, Piotr Kusmierczyk, Jan Hannes Lang, Carsten Detken, and Tuomas Peltonen (2017). "A new database for financial crises in European countries." Occasional Paper Series No 13. European Systemic Risk Board.
Kaminsky, Graciela, L., and Carmen M. Reinhart (1999). "The Twin Crises: The Causes of Banking and Balance-of-Payments Problems." American Economic Review, 89(3): 473-500.
Reinhart, Carmen M. and Kenneth S. Rogoff (2009). "This Time is Different: Eight Centuries of Financial Folly." Princeton University Press.
Romer, David (2013). "Preventing the Next Catastrophe: Where Do We Stand?" Paper presented at the Rethinking Macro Policy II: First Steps and Early Lessons Conference. International Monetary Fund.
Schularick, Moritz and Alan M. Taylor (2012). "Credit Booms Gone Bust: Monetary Policy, Leverage Cycles, and Financial Crises: 1870-2008." American Economic Review 102(2): 1029 - 1061.
Wojnilower, Albert (1980). "The Central Role of Credit Crunches in Recent Financial History." Brooking Papers on Economic Activity, 2:1980, 277-339.
Wolfson, Martin H (1994). "Financial crises: Understanding the postwar U.S. experience," Taylor and Francis.
Table 1: Summary of Historical Analysis
| Overheating Episode | Financial Disturbance | Date of Financial Disturbance | Literature Sources Consulted |
|---|---|---|---|
| 1964-1970 | Credit Crunch 1966 | August-September 1966 | Burger (1969); Wojnilower (1980); Bordo and Haubrich (2017) |
| Credit Crunch 1970 | May 1970 | Wojnilower (1980); Bordo and Haubrich (2017) | |
| 1972-1974 | Banking Crisis 1974 | 1974 | Wojnilower (1980); Drehmann et al. (2012); Bordo and Haubrich (2017) |
| 1978-1980 | Latin American Debt Crisis | 1982-1989 | Kaminsky and Reinhart (1999); Drehmann et al. (2012); Bordo and Haubrich (2017) |
| 1987-1990 | S&L Crisis* | 1988-1990 | Bordo et al. (2000); Reinhart and Rogoff (2009); Romer (2013); Drehmann et al. (2012); Schularick and Taylor (2012); Laeven and Valencia (2013); Field (2017) |
| Black Monday | October 1987 | Romer (2013) | |
| Junk Bond Market Crash | October 1989 | Wolfson (1994) | |
| Mexican Crisis (Tequila Crisis) | October 1992 / December 1994 | Kaminsky and Reinhart (1999) | |
| 1997-2001 | Asian Crisis, LTCM, Russia | 1997 Q3 (Asian Crisis); 1998 Q3 (LTCM & Russian Crisis) | Romer (2013) |
| Dot-Com Crash | Spring 2001 | Romer (2013); Bordo and Haubrich (2017) | |
| 2005-2007 | Financial Crisis | 2007-2009 | Diamond and Rajan (2009); Reinhart and Rogoff (2009); Schularick and Taylor (2012); Laeven and Valencia (2013); Bordo and Haubrich (2017) |
| Euro Area Sovereign Debt Crisis | 2009-2011 | Lo Duca et al. (2017) |
Note: The S&L Crisis* is dated to have a far wider range (1984 - 1991) in Reinhart and Rogoff (2009).
1. We thank Alex Martin for excellent research assistance. We thank Mark Carlson, Luca Guerrieri, Michael Kiley, Ed Nelson, and Michael Palumbo for their helpful comments. The note reflects the views of the authors and should not be interpreted as reflecting the views of the Board of Governors of the Federal Reserve System or anyone else associated with the Federal Reserve System. Return to text
2. Non-accelerating inflation rate of unemployment (NAIRU) estimates by the Board staff are publicly available until 2011. The Federal Reserve staff's real-time estimates of the NAIRU should be interpreted with caution since there are multiple definitions of this indicator. The definition used in Federal Reserve Board staff's estimates of the NAIRU has evolved over time, and the "natural rate of unemployment" has become the more common terminology as modelers have moved away from accelerationist views of inflation. For further details, see https://www.philadelphiafed.org/research-and-data/real-time-center/greenbook-data/nairu-data-set.
Output gap is measured as: 100*(Real Gross Domestic Product - Real Potential Gross Domestic Product) / Real Potential Gross Domestic Product. Real Gross Domestic Product data is from the U.S. Bureau of Economic Analysis, and Real Potential Gross Domestic Product data is from the U.S. Congressional Budget Office (CBO). Real potential GDP is the CBO's estimate of the output the economy would produce with a high rate of use of its capital and labor resources. The data are adjusted to remove the effects of inflation. Return to text
3. The Aggregate Financial Vulnerability Index comprises a wide range of potential sources of financial vulnerabilities and leads the credit-to-GDP gap by a year or more. See also Aikman et al. (2017), which show similar results for a slightly expanded set of variables. Return to text
4. This event occurred about the same time as the Herstatt bank failure, which some accounts in the literature point as contributing to tightened financial conditions. Return to text
5. Continental Illinois was one of these banks and its problems were aggravated due to the purchases of risky speculative energy-related loans, which eventually led to its failure in 1984. Return to text
6. Earlier disturbances from abroad during the 1990s include the banking crises in several Scandinavian countries and the withdrawal of the U.K. pound from the European Exchange Rate Mechanism. These episodes appeared to have had minimal spillovers to the U.S. economy and the financial system. Return to text
Afanasyeva, Elena, Seung Jung Lee, Michele Modugno, and Francisco Palomino (2018). "The Relationship between Macroeconomic Overheating and Financial Vulnerability: A Narrative Investigation," FEDS Notes. Washington: Board of Governors of the Federal Reserve System, October 12, 2018, https://doi.org/10.17016/2380-7172.2253.
Disclaimer: FEDS Notes are articles in which Board staff offer their own views and present analysis on a range of topics in economics and finance. These articles are shorter and less technically oriented than FEDS Working Papers and IFDP papers.