
FEDS Notes
 Print
PrintOctober 16, 2015
A Trillion Dollar Question: What Predicts Student Loan Delinquency Risk?
Alvaro Mezza and Kamila Sommer
Over the past ten years, the real amount of student debt owed by American households more than doubled, from about $450 billion to more than $1.1 trillion. As a result of this increase, in 2010 student loan debt surpassed credit card debt as the largest class of non-housing consumer debt. Currently, about 42.5 million borrowers hold student debt, nearly double the number from ten years ago, with average real debt per borrower increasing from about $19,000 to $27,000. A potential consequence of the higher reliance on student debt to finance higher education, coupled with the adverse effects of the Great Recession, is difficulty in meeting these debt obligations. As a possible reflection, the share of student loan balances 90 or more days delinquent increased from 6.7 percent to 11.7 percent.1
Following the rapid increase in student debt and delinquencies, a number of initiatives have been put forth by the Department of Education (DoEd) to help borrowers to manage their debt. For example, new plans tied to borrowers' incomes (the so-called "income-driven" repayment plans) were introduced to help borrowers to lower monthly payments to manageable levels relative to their incomes.2 While income-driven repayment plans are a potentially promising way to alleviate student loan burdens for borrowers, efficient targeting of this at-risk population appears to be a challenge, in part due to existing data limitations.3
Using a unique data set that combines student loan debt and other individual credit variables with individual post-secondary education records, in a new research paper (Mezza and Sommer (2015)4 ) we study predictors of student loan delinquency and, thus, identify variables that could be used to more effectively target borrowers for enrollment in programs designed to mitigate delinquency risk.5
For illustrative purposes, we initially summarize our main findings in the form of bivariate tables. However, the arguments made based on tabulations also hold in a multivariate analysis.6
- Student loan delinquencies7 do not appear to be driven by high levels of student loan debt, but rather by other factors that affect borrowers' ability to repay it.8 As shown in Table 1, borrowers who leave school without a college degree are disproportionately more likely to become delinquent on their student loans, although their student loan burdens are on average relatively low. In marked contrast, graduate degree holders, while generally associated with sizable student loan debt, rarely become delinquent on their student loan debt.9 In particular, not controlling for other factors, the average delinquency rate and student loan balance among those who did not earn a degree are 43.5 percent and $12,524, compared to 6.8 percent and $48,260 for those with earning a Master's or higher degree.10
| Table 1: Average Student Loan Balance and Delinquency Rates by Highest Attained Degree |
|---|
| Max. Degree Attained | Avg. Student Loan Balances ($) | Delinquency Rate |
|---|---|---|
| No Degree | 12,524 | 0.435 |
| Certificate/Associate's Degree | 12,307 | 0.228 |
| Bachelor's Degree | 24,133 | 0.111 |
| Master's or Above | 48,260 | 0.068 |
Note: Tabulations reflect the highest reported attained degree in the sample.
- Attending a for-profit institution, with or without completing a degree, is associated with disproportionately greater risk of future student loan delinquency (Table 2).11 Most notably, not controlling for other factors, student loan borrowers with a degree from a private for-profit institution are on average 2.6 times more likely to become delinquent on their student loan debt than borrowers from public 4-year schools.12 However, even in the for-profit and 2-year public sectors, where delinquencies are prevalent, there is still significant heterogeneity in student delinquency outcomes across specific institutions.13
| Table 2: Delinquency Rate by School Sector and Degree Completion |
|---|
| Sector Type | With Degree | With No Degree |
|---|---|---|
| Public 4-year | 0.103 | 0.409 |
| Public 2-year | 0.166 | 0.464 |
| Private 4-year. not-for-profit | 0.116 | 0.328 |
| Private, for-profit | 0.265 | 0.543 |
| Total | 0.119 | 0.435 |
Note: Tabulations are based on the most recent school sector affiliation. Individuals most recently affiliated with private, 2-year institutions are dropped from the analysis due to limited number of observations.
- A borrower's credit score (even when measured at a time that precedes the borrower's entry into student loan repayment) is highly predictive of future student loan delinquencies and is correlated with both degree non-completion and for-profit attendance.14 In part, this might reflect that borrowers with low credit scores at the time of their entry into repayment tend to be less likely to have a degree and are more likely to have attended a for-profit institution. Table 3 shows that while student loan balances on net rise with borrowers' credit scores, delinquency rates fall. This finding challenges the notion that credit histories of young student loan borrowers are not necessarily well established and, consequently, less likely to be predictive of future credit behavior. Instead, our analysis suggests that borrowers' credit scores observed at or shortly before school exit, if made available to program administrators, could be very effectively used to target borrowers for enrollment in programs designed to mitigate delinquency risk.
| Table 3: Average Student Loan Balance and Delinquency Rate by Borrowers Credit Score Measured Prior to the School Exit |
|---|
| Credit Score | Avg. Student Loan Balances ($) | Delinquency Rate |
|---|---|---|
| 270-499 | 18,927 | 0.592 |
| 500-599 | 22,504 | 0.301 |
| 600-679 | 23,704 | 0.175 |
| 680-729 | 27,454 | 0.090 |
| 730-900 | 25,540 | 0.041 |
| Missing Score | 11,372 | 0.341 |
Note: Tabulations are based on borrowers' credit scores that are on average lagged by one year relative to borrowers' school exit.
To illustrate the three points made above in a multivariate analysis framework, we build a series of statistical models designed to predict the probability that borrowers become delinquent on their student loans within the first 5 years after entering repayment. The models vary in the explanatory variables used to predict delinquency risk, and all of them produce a predicted probability of future student delinquency for every individual in our data set. With these predicted probabilities (as well as data on actual delinquencies experienced by these individual borrowers) in hand, we assess which combination of variables is the most effective in identifying borrowers who eventually became delinquent.15
To assess the relative performance of these models, we construct cumulative delinquency curves --an analytical tool commonly used in the mortgage industry to gauge performance of statistical models predicting mortgage loan delinquency risk. In a nutshell, to construct a cumulative delinquency curve, for each borrower in our data set, we first compute her individual probability of future student loan delinquency based on each model specification. Second, we use these probabilities to rank borrowers from the individual who is associated with the largest risk of future student loan delinquency to the one who is associated with the smallest risk. Thus, the 10 percent riskiest borrowers (as predicted by each model) are located in the bottom decile of the distribution on the X-axis in the cumulative delinquency curve graph in Figure 1. Third, using the actual delinquency data, on the Y-axis, we plot the cumulative portion of the actual realized delinquencies for each percentile of student loan borrowers ranked by their student loan delinquency risk. As such, a point with coordinates (X=10,Y=30) on the graph in Figure 1 implies that the 10 percent of the riskiest borrowers (as predicted by a model) account for 30 percent of all actual student loan delinquencies in the sample.
The black line in Figure 1 shows what a perfect prediction for our sample would look like--about 25 percent of borrowers have ever been delinquent on their student loans in our sample, and these would be interpreted by the best-fitting model as the "riskiest" borrowers based on their observable characteristics. In practice, an estimated model is unlikely to fit the perfect prediction line exactly. However, the model's fit relative to the perfect prediction provides a gauge for assessing how well the model separates borrowers in a high risk of student loan delinquency from their lower-risk counterparts.
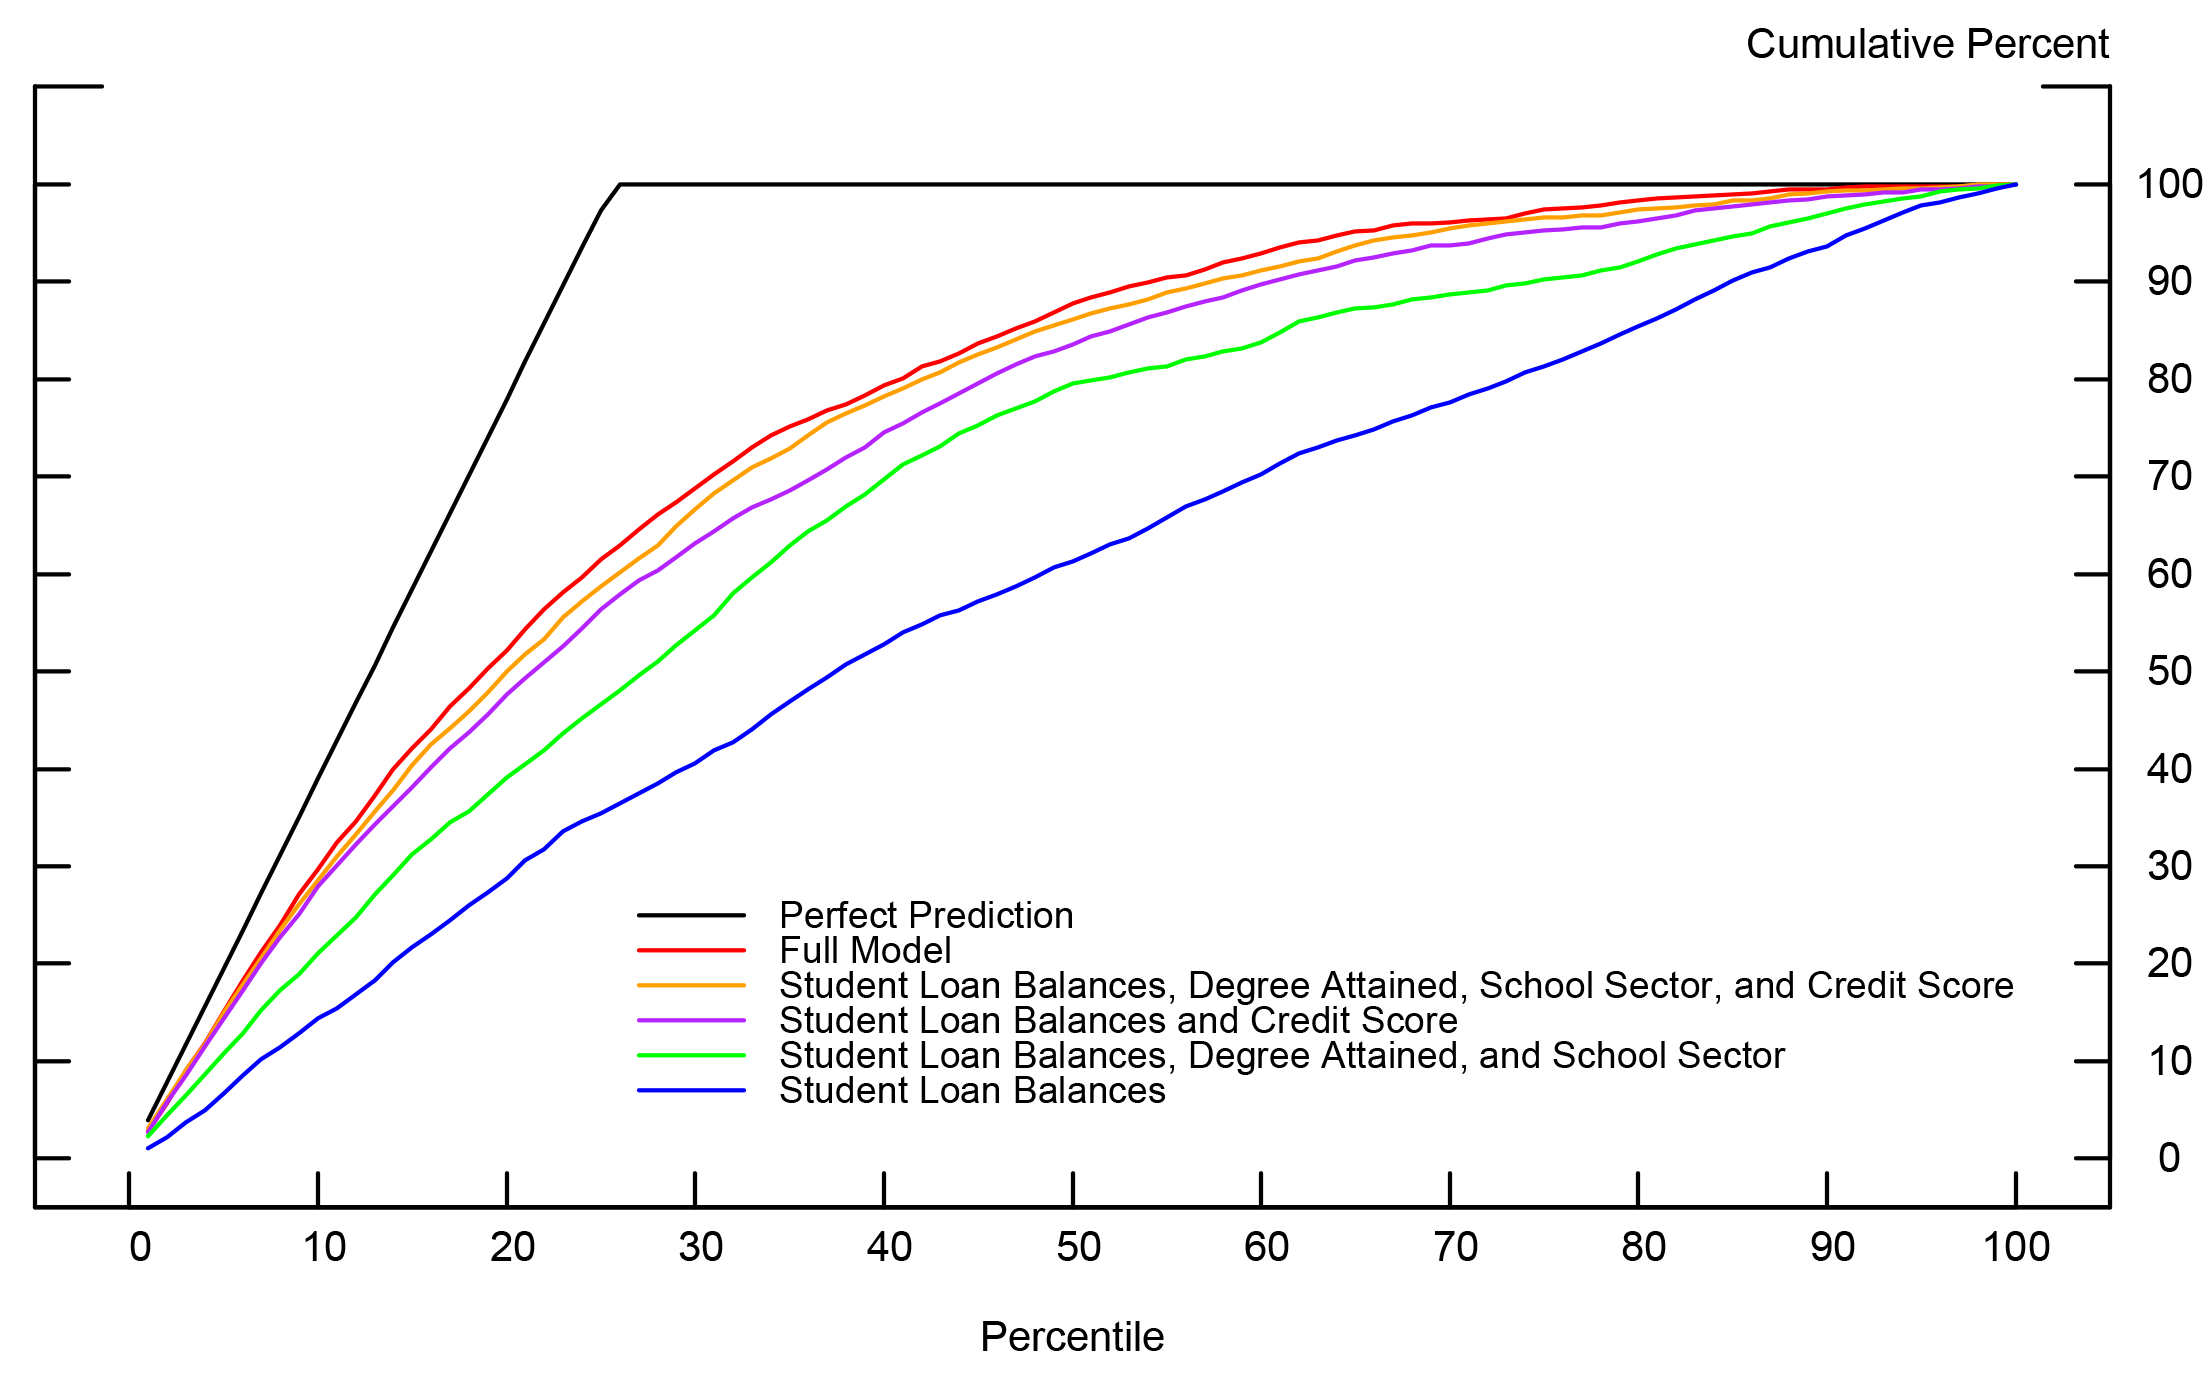
The red line in figure 1 shows the cumulative delinquency curve for our fully-specified model that includes a full set of explanatory variables, many of which might not be readily available to policy makers. By way of summary, these variables include borrower's age when entering repayment, whether a borrower ever received Pell Grants and their average amount, the highest degree attained (including an indicator for those with non-completed college degrees), degree major for those with attained degrees, school sector controls, school-level cohort default rates, credit scores and indicators for missing credit scores, indicators for borrowers with other types of debt (mortgage, auto, credit card), and time dummy variables. 16
The red line shows that our fully-specified model captures 60 percent of all student loan delinquencies among the riskiest 25 percent of student loan borrowers ranked by the model-predicted delinquency risk. This compares quite favorably to a "perfect" model that would in theory capture 100 percent of all student loan delinquencies in the riskiest borrower quartile. In marked contrast, a model that uses only student loan balances (the blue line) captures only about 35 percent of all student loan delinquencies for the riskiest model-predicted quartile. Notably, the fact that the blue line is not far from a 45-degree line indicates that the ability of a model that identifies delinquency risk based on student loan balances is quite limited.
The green line shows the cumulative delinquency curve for a model that includes student loan balances, but also controls for school sectors and the highest attained degree. As these two sets of additional controls are added, the predictive power of the models improves; however, it is still a far cry from the predictive power of the fully-specified model (the red line).
The purple and yellow lines capture the models where borrowers' credit scores (measured prior to borrowers' entry into repayment) are added. The predictive power of these models improves markedly, and converges almost to our fully-specified model (the red line). In other words, the inclusion of credit scores as a predictor of future student loan delinquencies gives even the simplest model a mighty boost, in terms of sample fit. In particular, a simple model that includes only student loan balances and credit scores (the purple line) captures about 57 percent of all student loan delinquencies among the riskiest model-predicted quartile, essentially the same fraction as the fully specified model (red line) and nearly double the fraction of delinquencies captured by its analog that does not employ credit scores (the blue line). In all, our findings suggest that credit scores measured prior to the borrower's entering repayment (unlike student loan balances) are highly effective as a predictor of future delinquency events.
All told, our finding that student loan balances are only a poor predictor of future student loan delinquencies challenges aspects of the popular narrative that frequently link borrowers with high student loan burdens (and often advanced degrees) to student loan debt repayment difficulties. While such anecdotes undoubtedly capture the challenges facing some borrowers, the data show that they are not generally representative of the typical student loan borrower experiencing repayment difficulties. The result also calls into question the efficacy of using student loan balances as a tool to target borrowers for enrollment in income-driven (or other risk-mitigating) programs. Instead, when devising plans for loan modification or enrollment in income-driven repayment plans, targeting could be based on broader credit information. To be sure, our analysis is not designed nor should be interpreted as suggesting that credit scores be used for student loan underwriting; doing so could undermine the objective of equalizing college access opportunities.
For details of this analysis, please, see Mezza and Sommer (2015).
References:
Dynarski, Susan and Daniel Kreisman. "Loans for Educational Opportunity: Making Borrowing Work for Today's Students," Hamilton Project Discussion Paper, 2013.
Hylands, Thomas. "Student Loan Trends in the Third Federal Reserve District," Cascade Focus, 2014.
Looney, Adam and Constantine Yannelis. "A Crisis in Student Loans? How Changes in the Characteristics of Borrowers and in the Institutions They Attended Contributed to Rising Loan Defaults? Brookings Papers on Economic Activity, 2015.
Mezza, Alvaro and Kamila Sommer. "A Trillion Dollar Question: What Predicts Student Loan Delinquencies?" Forthcoming in the FEDS Working Series paper, 2015.
1. Figures based on author's calculations using the NYFed CCP/Equifax data set for 2005:Q2 and 2015:Q2. Nominal amounts are deflated by CPI-U into constant 2015:Q2 dollars. Return to text
2. The two new plans are the Income-Based Repayment (IBR) plan--available since 2009--and the (ii) Pay-As-You-Earn (PAYE) repayment plan--available since 2012. While the two plans vary in some of the eligibility requirements, they both offer low income-based payments tied to discretionary income over a long amortization periods (from 20 to 25 years, depending on the specific plan). Additionally, the Income-Contingent Repayment (ICR) plan has been available for Direct Loan Program (DLP) loan borrowers since the inception of the DLP in 1994. However, the take-up rate of this plan has been historically low and the plan is less generous than the other two new plans recently implemented. Return to text
3. As of 2015:Q2, about 19 percent of borrowers owing about 33 percent of outstanding federal Direct student loan balances are enrolled in income-driven repayment plans (https://studentaid.ed.gov/about/data-center/student/portfolio). These figures include those enrolled in ICR, IBR, and PAYE plans. Interestingly, the enrollment figures indicate that those currently enrolled have higher balances, on average, than the average DLP loan borrower (about $50,000 versus $28,000), suggesting that a significant number of borrowers taking advantage of these plans are borrowers with high balances. As we will show, these are not the borrowers that are most frequently associated with delinquencies and defaults. Return to text
4. The paper includes a detailed description of all the data sources and statistical methods used. Return to text
5. Income-driven repayment plans are intended to make student loan debt more manageable by reducing required monthly payments. While we are not able to measure debt manageability in our data per se, there is likely a link between borrowers' ability to manage their student loan debt in this sense and their delinquency risk. Return to text
6. For the multivariate results, see Mezza and Sommer (2015). Return to text
7. To this end, we define a delinquent borrower as one who ever becomes 120 or more days past due on their student debt payments within five years of entering repayment. Student loan defaults are included in this definition of student loan delinquency. Return to text
8. For corroborating evidence, see Dynarski and Kreisman (2013) or Hylands (2014). Return to text
9. We are not the first to point this out: see, for example, "Student Loan and Defaults: The Facts" by Susan Dynarski, New York Times, June 11, 2015. Return to text
10. Given the non-causal nature of our analysis, this result does not necessarily imply that pushing non-completers to finish their degrees will help them repaying their debt. Return to text
11. For additional evidence on the correlation between the for-profit sector (and, to a lesser degree, the public 2-year sector) and Federal student loan defaults in particular, see Looney and Yannelis (2105). Return to text
12. As was the case with degree non-completers, the positive relationship between delinquency risk and attending a for-profit institution is not necessarily causal. However, for the purpose of identifying characteristics predicting future credit risk, for-profit institution attendance is a relevant variable to consider. Return to text
13. This heterogeneity is better captured by the school-level 2-year cohort default rate (CDR)--a metric constructed by the DoEd that is mainly used to sanction schools with high student loan default rates. The CDR reflects the percentage of borrowers at a given school who enter repayment on federal loans during a particular federal fiscal year and default on their student loan(s) prior to the end of the next fiscal year. For an illustration of this heterogeneity, see Figure 3 in Mezza and Sommer (2015). Return to text
14. To avoid the confounding effects of student loan repayment behavior on credit scores, a lagged credit score measure relative to school exit is used in the analysis. In particular, scores are lagged on average by one year relative to school exit, depending on when we observe credit records and when the school exit occurs for each individual in our sample. More timely credit scores (like those accessed at the time of a borrower's school exit or entry into repayment) are likely to be even more predictive of delinquency risk. The credit score used in this analysis is the TU TransRisk AM Score. Return to text
15. In our analysis, we estimate a probability model (probit). The binary dependent variable--our student loan delinquency measure--takes a value of one if a borrower was ever 120 or more days delinquent on her student loans within five years after entering repayment; zero otherwise. Return to text
16. To be consistent with the CDR information that might be available to the DoEd at the moment when the borrower enters repayment, we lagged the school-level CDR by three years with respect to the year when the borrower entered repayment. Return to text
Please cite as:
Mezza, Alvaro, and Kamila Sommer (2015). "A Trillion Dollar Question: What Predicts Student Loan Delinquency Risk?" FEDS Notes. Washington: Board of Governors of the Federal Reserve System, October 16, 2015. https://doi.org/10.17016/2380-7172.1647
Disclaimer: FEDS Notes are articles in which Board economists offer their own views and present analysis on a range of topics in economics and finance. These articles are shorter and less technically oriented than FEDS Working Papers.
