
FEDS Notes
 Print
PrintDecember 5, 2016
Prices and Depreciation in the Market for Tablet Computers
David Byrne, Wendy Dunn, and Eugenio Pinto1
Introduction
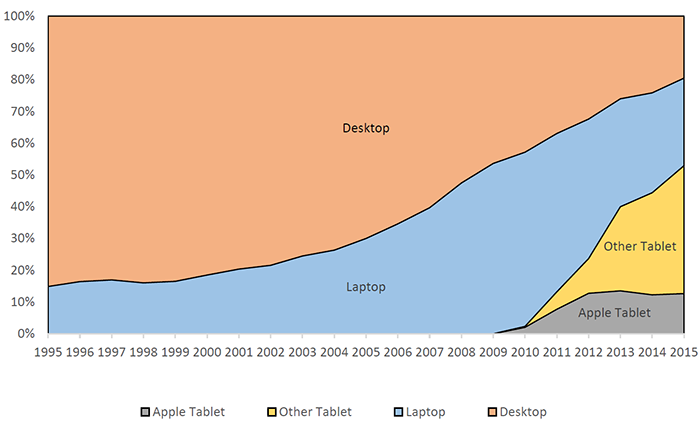
Spurred by advances in electronic miniaturization and power efficiency, lightweight, powerful and inexpensive tablet computers entered the mass market in significant volumes in 2010 (figure 1). Since that time, sales of tablet computers have increased to account for over half of personal computer (PC) units sold worldwide. While changes in list prices for successive generations of tablet PCs have been fairly modest, quality advances for this platform have been rapid; indeed, for the same price ($729) as the 32GB 3G model of the first-generation iPad, the latest generation--the iPad Pro 9.7"--offers eight times as much memory and double the processor cores and clock speed, has two times better screen resolution, weighs one-third less, is half the thickness, and adds a sophisticated still and video camera that its predecessor lacked. In other words, after adjusting for quality improvements, the price of an Apple tablet has fallen considerably. Moreover, although Apple's technological progress serves as a convenient benchmark, it is interesting to note that Apple's share of the tablet market has declined markedly, suggesting that the relative prices for tablets sold by other producers have fallen even faster.
To more thoroughly explore how the emergence of this platform may have influenced the dynamics of computer equipment, we employ a unique dataset of retail prices and characteristics for used tablet computers.2 Using a hedonic regression approach, we develop quality-adjusted price indexes for tablet PCs made by Apple and other manufacturers. Given the information on used prices for a rich cross-section of product vintages, we are also able to estimate the depreciation rate for tablet PCs. Our results are among the first available for this important new platform.3
Raw Tablet PC Prices and Performance
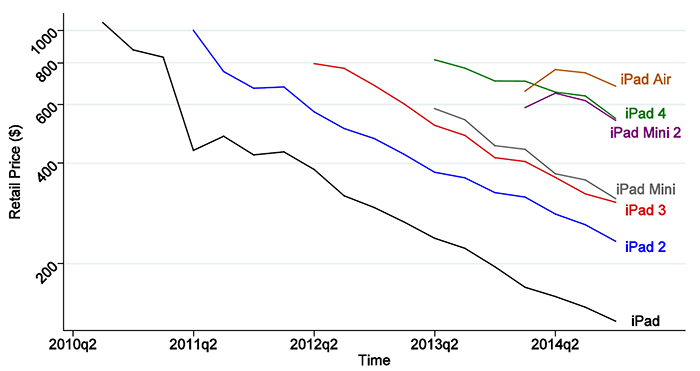
Our dataset consists of a sample of "bluebook" prices and characteristics of used tablet PCs. For each tablet model, the bluebook entry lists information on the manufacturer, the years in which the model was sold new by the manufacturer, its technical specifications, and monthly used market retail prices for the product from 2007 to 2014. Figure 2 shows the data for selected Apple iPad models. Each color represents a distinct generation of the product and the lines trace the used prices observed for the most advanced model in that generation.
 |
|
Note: Lines represent the most advanced model from each generation.
Source: Historic Pricing Information on Computer Products, Orion Blue Book, UsedPrice.com, and authors' calculations.
We begin our analysis in 2010, when the first Apple iPad model was introduced and spurred the surge in sales shown in figure 1.4 After dropping a few outliers, observations with incomplete data, and models from Motion Computing (which produces specialty tablets for industrial applications), our sample contains 4,049 used price observations for a set of 209 specific models at different points in time. The basic features of our sample are shown in table 1.5 As can be seen from the total number of observations, the variety of tablet PCs available for purchase (both new and used) grew substantially over the five-year period. Apple and Samsung dominated the market until the Microsoft Surface was introduced in 2013. The median price of used tablets sold was about $700 in 2010 and was roughly half that amount in 2014, for an average annual price decline of about 17 percent. Over the same period, the average age increased by about 8 months, reflecting the nascent nature of this new platform.
| 2010 | 2011 | 2012 | 2013 | 2014 | Total | |
|---|---|---|---|---|---|---|
| Total | 59 | 239 | 627 | 931 | 2,193 | 4,049 |
| Apple | 32 | 197 | 402 | 648 | 1,457 | 2,736 |
| Samsung | 27 | 42 | 225 | 245 | 593 | 1,132 |
| Microsoft | 0 | 0 | 0 | 38 | 109 | 147 |
| Panasonic | 0 | 0 | 0 | 0 | 34 | 34 |
| Memo: | ||||||
| Median Age (years) | 0.6 | 0.7 | 0.9 | 1.2 | 1.3 | 1.2 |
| Median Price | $718 | $571 | $428 | $371 | $332 | $372 |
Source: Historic Pricing Information on Computer Products, Orion Blue Book, UsedPrice.com, and authors' calculations.
Table 2 shows the evolution of major characteristics for newly introduced models over the sample period. Processor clock speed for the median new model moved sideways through 2012, then increased sharply, a pattern due in large part to the entry of Microsoft tablets in the market. System memory climbed for the median new model fairly steadily at an average annual rate of 68 percent. Median hard disk storage, by contrast, was fairly stable over the five-year period.
Year |
Obs. (number) |
Processor Speed (megahertz) |
System Memory (megabytes) |
Hard Disk Storage (gigabytes) |
|---|---|---|---|---|
| 2010 | 6 | 1000 | 256 | 32 |
| 2011 | 33 | 1000 | 512 | 16 |
| 2012 | 37 | 1000 | 1024 | 32 |
| 2013 | 93 | 1700 | 1024 | 32 |
| 2014 | 40 | 1600 | 2048 | 16 |
| Total | 209 | 1400 | 1024 | 32 |
Note: Year is the reference year for the ship date, and all values except for the number of observations refer to the median.
Source: Historic Pricing Information on Computer Products, Orion Blue Book, UsedPrice.com, and authors' calculations.
Adjusting for Quality Improvements
As has been well documented, the fast pace of technological change in the high-tech sector presents challenges in the measurement of inflation, because the premium paid for successive product vintages reflects both price inflation and payment for improved performance relative to earlier models (Aizcorbe, 2014). One approach to apportioning this premium into quality and constant-quality price difference is to use hedonic regressions, an approach employed by many previous studies in the context of price measurement of high-tech products (e.g. Berndt and Rappaport, 2001). This methodology controls for characteristics that are associated with performance valued by consumers by removing the portion of price variation correlated with performance characteristics, which produces quality-adjusted estimates of price variation.
For several reasons, our analysis of prices in the market for used tablet computers is more complicated than conventional hedonic studies. First, advances in technology that reduce the cost of producing a computer with a given set of characteristics will naturally drive the performance-adjusted price of new computers down and consequently reduce the resale value of older tablets. In addition, even after controlling for quality change, the resale value of a used piece of equipment tends to decline with age. Older tablet computers decrease in value both because they have fewer remaining years of use before more demanding software pushes them into obsolescence, and because fewer years remain before the expected failure of their physical components. Both effects imply that a key variable that determines the price of a used computer is its 'model age', i.e., how much time has passed since that model was first introduced.6
Combining data on used tablet prices and observed performance characteristics with the vintage of the model at different points in time allows us to jointly estimate the effects of age (i.e. depreciation) and time (i.e. price inflation), after controlling for quality change. Specifically, following Doms et al. (2004), we assume a simple log-linear decomposition of the price of a tablet PC and adopt the following baseline regression specification:
$$$${\ln p_{i,t}\ }=\alpha+\phi a_{i,t}+\gamma t+\sum_j {\beta_jz_{j,i,t}}+\varepsilon_{i,t}$$$$
where $$p$$ is the retail price of a given used tablet computer, $$a$$ is the age of the model (i.e. how long since it was first sold), $$t$$ is a monthly time index, and $$z_j$$ is a set of performance characteristics, including the speed of the central processing unit, the amount of random access memory, and the storage capacity.7
In this setup, $$\gamma $$ is an estimate of the log-price change between successive periods, controlling for quality change and depreciation, while $$\phi$$ is an estimate of the (log-price) depreciation. Using an assumed retirement rate of 18 percent per year, we then adjust the estimated depreciation rate to account for non-functional tablets that have negligible value, since these observations do not appear in our dataset.8
The regression results are shown in table 3. With an adjusted R-squared of about 90 percent, the baseline specification (column 1) fits the data quite well. Each of the coefficients on the five included product characteristics are statistically significant with greater than 99 percent confidence and have magnitudes that suggest these features have appreciable effects on either consumer valuation or production costs. The coefficients on model age and time (both measured in months) also enter significantly and are negatively related to price. After accounting for the assumed retirement rate of 18 percent, the coefficient on model age implies an adjusted depreciation rate of about 27 percent per year, and the time coefficient implies a quality-adjusted price index that falls 24 percent per year (table 4).
| (1) Baseline |
(2) Brand-Varying Depreciation |
(3) Max of Used Prices |
|
|---|---|---|---|
| Age | -0.0093*** (-27.75) |
-0.0103*** (-21.87) |
|
| Time | -0.0232*** (-64.42) |
-0.0196*** (-41.63) |
-0.0207*** (-12.88) |
| System Memory | 0.3760*** (42.38) |
0.3426*** (35.16) |
0.3197*** (7.18) |
| Storage Capacity | 0.1969*** (45.00) |
0.1909*** (44.4) |
0.2131*** (13.07) |
| Processor Speed | 0.2298*** (16.68) |
0.2277*** (17.06) |
0.1934*** (4.14) |
| Screen Size | 0.6440*** (26.02) |
0.8117*** (27.64) |
0.9409*** (8.67) |
| 3G or Better | 0.1258*** (20.90) |
0.1205*** (20.98) |
0.1729*** (7.12) |
| Age*Samsung | 0.0007 (1.21) |
||
| Time*Samsung | -0.0091*** (-16.15) |
||
| N | 4049 | 3868 | 209 |
| adj. R2 | 0.9047 | 0.9105 | 0.8947 |
t statistics in parentheses
Notes: A constant term and brand dummy variables are included but not reported. Price, system memory, storage capacity, and processor speed are all expressed in log form.
* p < 0.05, ** p < 0.01, *** p < 0.0001
Source: Historic Pricing Information on Computer Products, Orion Blue Book, UsedPrice.com, and authors' calculations.
In an effort to gauge the importance of Apple in the price dynamics for this new platform, we also tested a regression specification that allowed the coefficients on both model age and time to vary between Apple and Samsung (table 3, column 2).9 The depreciation rates for Apple and Samsung tablet computers are similar; notably, however, the average annual rates of quality-adjusted price declines that prevailed over this period are noticeably different among brands. In particular, prices for Apple tablets fell 8 percentage points more slowly than Samsung (table 4), a pattern that is consistent with the declining market share for Apple (figure 1).
| Regression | Description | Depreciation | Price Change | |
|---|---|---|---|---|
| Estimated | Adjusted1 | |||
| Baseline | All tablets | 10.6 | 26.7 | -24.3 |
| Brand-varying | Apple | 11.6 | 27.5 | -21.0 |
| Samsung | 10.9 | 26.9 | -29.2 | |
| New models | Max of first-year used prices | N/A | N/A | -22.0 |
| Time-varying | Year-over-year change: | |||
| 2011 | 12.0 | 27.9 | -43.5 | |
| 2012 | -20.5 | |||
| 2013 | -24.5 | |||
| 2014 | -22.0 | |||
Note: All values are expressed as annual percent changes.
Source: Historic Pricing Information on Computer Products, Orion Blue Book, UsedPrice.com, and authors' calculations.
1. Adjusted to account for assumed retirement/disposal rate. Return to table
In a third regression, we restrict the sample to observations with the highest price for each individual model in its year of introduction--essentially, prices for those instances when a model is sold as new in the secondary market, such as items marketed as "new in box" on eBay. By excluding observations for older used tablets, we avoid any bias that could potentially be introduced by jointly estimating the effects of time and age. As can be seen in table 4, however, this regression indicates that quality-adjusted prices of 'new' tablet PCs declined at an annual rate of 22 percent over the sample period, a similar rate of decline to the baseline results.10
Finally, we tested a specification that included the full sample and assumed a constant (geometric) depreciation rate but replaced the single time index with indicator variables for each time period in the sample, thus allowing the magnitude of price changes to vary over time.11 As shown in the bottom rows of table 4, the results for this regression show that prices declined especially sharply in 2011 (43 percent per year), when tablets were rapidly penetrating the market. From 2012 to 2014, price declines ranged from 20 to 25 percent per year.
Implications for Productivity
Our estimates for the rates of constant-quality depreciation and price change of tablet PCs are different from those currently used to estimate real investment and capital stocks of PCs in the national economic accounts. In particular, between 2010 and 2014, the average annual rates of depreciation and price decline in the national accounts are about 36 percent and 4 percent per year, compared with our baseline estimates of 27 percent and 24 percent, respectively.12 As tablets have become an increasing share of the PC equipment stock, these differences may have meaningful implications for the dynamics of business investment and productivity.
Since capital services are measured as the product of the accumulated productive capital with its income share, the contribution of PC equipment to productivity growth depends fundamentally on the interaction of the rates of constant-quality depreciation and price change. More precisely, if rates of depreciation and inflation are constant, then the real capital stock,$$K_t$$, can be written as
$$$$K_t=\frac{1}{P_0}\sum^{t-1}_{i=0}{\frac{{\left(1-\delta\right)}^i}{{\left(1+\pi\right)}^{t-i}}I^N_{t-i}}+{(1-\delta)}^tK_0$$$$
where $$K_0$$ and $$P_0$$ are the initial price and stock of capital, $$I^N_{t-i}$$ is the series of nominal investment flows, $$\delta$$ is the depreciation rate, and $$\pi$$ is the rate of inflation.
If we assume that both the nominal investment flows and the initial capital stock and price are not affected by any measurement issues, we can draw the following conclusions. First, both lower depreciation and faster price declines (more negative $$\pi$$) boost the pace of capital accumulation.13 Second, the accumulated capital will depend on how the overall variation in constant-quality prices of used tablet PCs (i.e., $$\delta-\pi$$) is apportioned between depreciation and price change, with faster price declines implying higher contributions to capital deepening.14
Our estimates of depreciation and price changes for tablet PCs suggest there is a downward bias to the measured contribution of computer equipment to productivity growth in recent years. If our estimates for tablet PCs alone were folded into the national accounts, we would expect a faster pace of price declines for computers and peripheral equipment (CPE) by about 5 percentage points per year, and a lower depreciation rate by up to 2 percentage points per year.15 Moreover, as suggested in Byrne, Dunn, and Pinto (2016), it seems that the measurement issues raised here apply to all PC platforms (which are treated equally in the national accounts). If so, we estimate that the much slower price declines and still-high depreciation rate in the national accounts are biasing down the contribution of CPE to labor productivity growth by about 0.1 percentage point per year.16
Faster price declines and a lower depreciation rate would increase the CPE productive stock, raising its contribution to productivity growth to about its value in the second half of the 2000s, but still well short of its contribution in the late 1990s. This reflects, in part, a CPE income share that would be little affected by the changes we consider, remaining well below its value in the second half of the 1990s.17 However, to the extent that a large fraction of information technology capital has price and depreciation trends that mirror those for CPE, the downward bias to productivity growth implied by these measurement issues could be broader in scope and thus more economically significant.18
Conclusions
Although official U.S. price statistics do not publish consumption or investment price indexes specifically for tablet computers, we observe that our quality-adjusted price indexes for tablets fall noticeably faster than the broader price indexes for PCs and overall computer and peripheral equipment, and the differences are large enough to have implications for measures of business investment and productivity. In addition, our analysis highlights the importance of estimation of depreciation rates concurrently with price indexes: if computer investment prices have slowed dramatically since 2010, as the price index employed in the national economic accounts indicates, the appropriate rate of depreciation to use in the estimation of capital stocks and service flows may have slowed as well. Our results show empirically, and theory indicates, that prices and depreciation rates move sympathetically with one another.
References
Aizcorbe, Ana M. A Practical Guide to Price Index and Hedonic Techniques. New York, NY: Oxford University Press, 2014.
Berndt and Rappaport, 2001. "Price and Quality of Desktop and Mobile Personal Computers: A Quarter-Century Historical Overview." American Economic Review, Papers and Proceedings of the Hundred Thirteenth Annual Meeting of the American Economic Association, vol. 91, no. 2, pp. 268-273. National Bureau of Economic Research, Inc.
Byrne, David, Wendy Dunn, and Eugenio Pinto, 2016. "Time Variation in Rates of Depreciation and Price Change for Personal Computers." Available at http://conference.nber.org/confer/2016/SI2016/PRCR/Byrne_Dunn_Pinto.pdf.
Byrne, David, Stephen D. Oliner, and Daniel E. Sichel, 2016. "A New Look at Prices of Personal Computers, Tablets, and Cell Phones." Available at http://conference.nber.org/confer/2016/SI2016/PRCR/Byrne_Oliner_Sichel.pdf.
Byrne, David, and Eugenio Pinto, 2015. "The Recent Slowdown in High-Tech Equipment Price Declines and Some Implications for Business Investment and Labor Productivity." FEDS Notes, March 26 2015.
Doms, Mark E., Wendy E. Dunn, Stephen D. Oliner, and Daniel E. Sichel. 2004. "How Fast do Personal Computers Depreciate? Concepts and New Estimates  ." Tax Policy and the Economy, 18, pp. 37-80. National Bureau of Economic Research, Inc.
Krebs, David. 2013. "Mobile Device TCO Models for Line of Business Solutions." VDC Research, Inc. Available at https://www.xploretech.com/downloads/Proven_Results_Construction/WP_VDC_Mobile_Device_TCO.pdf.
Nightingale, Edmund B., John R. Douceur, and Vince Orgovan. "Cycles, Cells and Platters: An Empirical Analysis of Hardware Failures on a Million Consumer PCs." In Proceedings of the Sixth Conference on Computer Systems, 343356. ACM, 2011.
Pakes, Ariel. 2003. "A Reconsideration of Hedonic Indexes with an Application To PC's (PDF) ." American Economic Review, 93, pp. 1578-1614. National Bureau of Economic Research, Inc.
Triplett, Jack. Handbook on Hedonic Indexes and Quality Adjustments in Price Indexes: Special Application to Information Technology Products. Paris and Washington, D.C.: Organisation for Economic Co-operation and Development, 2006.
1. With excellent research assistance from Jenna Anders, Amanda Bauer, and Trace Levinson. Return to text
2. The data were obtained from usedprice.com, which collects reported transaction prices from online vendors as well as brick and mortar retail outlets, such as pawn shops. Using data on used tablets allows us to analyze both the price and depreciation dynamics for this new platform of PC equipment. Return to text
3. Byrne, Oliner, and Sichel (2016) estimate a hedonic price index using scanner data for sales of new tablets and find qualitatively similar results to ours. Statistical agencies in Germany, Japan, New Zealand, and the United Kingdom estimate hedonic regressions for tablets to use in constructing their price indexes. The Bureau of Labor Statistics does not publish a price index for tablets. We are not aware of existing research on tablet depreciation. Return to text
4. Prior to 2010, the market was dominated by "rugged" tablets produced by Motion Computing, which were designed primarily for commercial applications in demanding environments, such as the health care, defense, and telecommunications sectors. We exclude these from our analysis because important price-determining characteristics of these tablets, such as physical durability, are not recorded in the data. Return to text
5. The frequencies shown in the table correspond to price listings, not transaction quantities. Although our regressions will overweight tablet lines with highly differentiated models (relative to revenue-weighted regressions), we experimented with collapsing observations across the features we did not treat as price-forming characteristics (e.g. color, telecommunications carrier); results from that regression were similar to the main results shown. In the hedonic regressions, we include dummy variables for each brand to capture brand-specific price differences. Return to text
6. Technically, the probability of component failure is also a function of accumulated run time (Nightingale et al., 2011). We do not observe run time in our dataset. Return to text
7. The other controls include the tablet brand, its screen size, and a dummy variable for whether it has the ability to connect to a cellular wireless network (3G or better). Return to text
8. Our assumed retirement rate of 18 percent was informed by failure rate estimates published by Krebs (2013). By comparison, Doms et al. (2004) employed a Weibull retirement distribution that averaged about 14 percent per year over the first five years of life of a desktop PC. Given that tablets are probably more prone to accidental damage than desktop PCs, the higher retirement rate for tablet PCs seems plausible. Return to text
9. In this regression, Panasonic and Microsoft models were excluded for lack of sufficient data to identify brand-specific age coefficients. Return to text
10. Another price available in our data is the manufacturers' suggested retail price (MSRP). When we estimated the hedonic regression using these data, the implied price indexes declined more slowly than the baseline index. However, we believe the MSRPs for Apple tablets are not indicative of market-clearing prices, since we observe that used prices for Apple tablets often exceeded the MSRP early in the product life-cycle, especially for the early iPad generations. Return to text
11. We also considered whether depreciation rates vary over the age of the tablet. Alternative specifications that allowed rates to vary with age suggest a bit faster depreciation in the mid-to-late stages of a product's service life. In particular, a regression with a separate age coefficient for tablets that are more than four years old (not reported) indicates a moderate acceleration of 2 to 3 percentage points. We note, however, that there are only a small number of models aged four years or more in our sample as they were introduced before the boom in market penetration of tablet PCs after the entry of Apple, and consequently, these observations may not be indicative of the behavior of the overall sample. We therefore adopt a constant (geometric) depreciation rate assumption. Return to text
12. These estimates were derived from the detailed data on PCs (separate from mainframes and peripheral equipment) in BEA's fixed assets accounts. Note that while the depreciation rate of PCs has remained roughly unchanged since 1982, the rate of price decline has slowed dramatically, from an average of 30.6 percent per year from 1996 to 2000, to 19.1 percent from 2001 to 2005, and 12.7 percent from 2006 to 2010. In order for our adjusted depreciation rate to match the average in the national accounts, the retirement rate would need to be about 28 percent, 10 percentage points higher than we assumed. Return to text
13. The effect of lower depreciation and faster price declines on the income share is likely to be smaller in magnitude as changes in these parameters have partially offsetting effects on the rental rate and the nominal capital stock. Return to text
14. In contrast, nominal capital income is essentially immune to this allocation issue. Return to text
15. In recent years, tablets have accounted for nearly 50 percent of all PC sales and PC equipment as a whole has accounted for about 45 percent of investment in and about 40 percent of the capital stock of overall computer and peripheral equipment. Return to text
16. As argued in Byrne and Pinto (2015), because most computer equipment (and certainly tablets) is now imported, the implied boost to real business investment would be essentially offset by a similar boost to real imports, leaving domestic output nearly unchanged. As a result, overall labor productivity would also be nearly unchanged and higher capital services would be offset by lower multifactor productivity. However, the higher capital deepening likely affects the assessment about the weak productivity growth in recent years as well as the outlook for productivity. Return to text
17. Productivity growth slowed from an average increase of about 3 percent in the second half of the 1990s to about 1/2 percent per year between 2011 and 2015. Similarly, the contribution of CPE to productivity growth slowed from about 1/2 percentage point per year to essentially zero between the two periods. This resulted from the combination of two factors. First, growth in the productive stock of CPE moved down from an average of about 40 percent to about 5 percent per year between the two periods (and the changes we considered would boost this growth rate by nearly 15 percentage points per year). Second, the CPE income share is now only a little more than half its value during the late 1990s (largely reflecting a sharp decline in the CPE share on overall business investment). Return to text
18. Although the capital income share of CPE is estimated to have been only about 2 percent in recent years, the income share of high-tech equipment and software has remained close to 20 percent. Return to text
Please cite as:
Byrne, David, Wendy Dunn, and Eugenio Pinto (2016). "Prices and Depreciation in the Market for Tablet Computers," FEDS Notes. Washington: Board of Governors of the Federal Reserve System, December 5, https://doi.org/10.17016/2380-7172.1885.
Disclaimer: FEDS Notes are articles in which Board economists offer their own views and present analysis on a range of topics in economics and finance. These articles are shorter and less technically oriented than FEDS Working Papers.