
In the Shadow of the Great Recession: Experiences and Perspectives of
Young Workers
 Print
Print- Job Fit
- Upward Mobility
- Young Workers' Unemployment
- Young Workers' Outlook
Upward Mobility
As young people enter the workforce, they may be accepting a job to simply make ends meet or trying to establish a career path with future payoffs and upward mobility. The characteristics of early jobs often have long-lasting effects on job opportunities and growth. Research shows that young people that do not get a strong foothold in the job market typically maintain a below median wage throughout their careers.27
In the changing labor market, it is often difficult to determine the paths for upward mobility. For example, young workers, like their older counterparts, are increasingly acting as their own agents of employment with multiple firms, rather than as employees of a particular firm. While these arrangements allow many workers the opportunity to negotiate the terms of their employment, it reduces economic stability for many households, particularly low-wage workers. As the relationship between employers and workers shifts, employers may be less likely to provide traditional salaries and benefits to workers. And the opportunities to build a career under these conditions are unclear.
In the Survey of Young Workers, 54 percent of working respondents hold a "traditional job" (defined as a permanent, full-time job). The survey reveals that traditional jobs are associated with positive outcomes including greater optimism about the labor market, higher pay, and upward mobility.
Job versus Career
In 2012, the Heldrich Center's Work Trends surveys revealed that approximately one-fourth of recent college graduates reported they have a career, and nearly one-half reported their job is a stepping stone to a career.28 The remainder reported their current job allows them to make ends meet. Recent high school graduates without a postsecondary degree were more likely to report their jobs are a stepping stone to a career or just to get them by.29
In the Survey of Young Workers, respondents also differentiated between careers that offer upward mobility and jobs that help them get by. Twenty-five percent of respondents with paid employment described their job as a "career," 35 percent described their job as a "stepping stone to a career," and 37 percent described their job as "just a job."
In the Survey of Young Workers, workers with a postsecondary degree have the most opportunity for upward mobility through a career. Within this educated group, 39 percent of respondents describe their current employment as a career, while 23 percent describe their current employment as "just a job" (figure 11). Respondents who are working while enrolled in a degree program are the least likely to have a "career" (9 percent).
Figure 11. Workers with a postsecondary degree have the most opportunity for upward mobility
Current job vs. career status
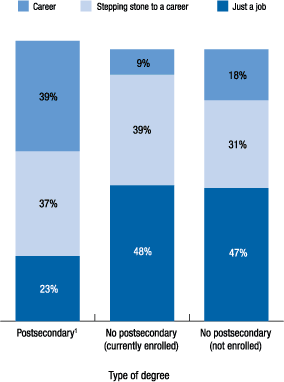
1. Includes associate's, bachelor's, master's, professional, and/or doctorate degree.
Note: Number of responses "postsecondary degree" is 743; "no postsecondary degree (currently enrolled)" is 209; and "no postsecondary degree (not enrolled)" is 418.
Working respondents who lack postsecondary degrees have less upward mobility through a career. For example, those without a postsecondary degree and who are not currently enrolled in school are more likely to have a job (47 percent) and less likely to have a career (18 percent).
Full-Time versus Part-Time Jobs
In the Survey of Young Workers, two-thirds of respondents with a paid job are working full time. Furthermore, 17 percent of full-time workers hold down two or more jobs. Full-time workers reported that they average 43 hours per week at the job. The respondents cluster around a 40-to-50-hour work week with a handful of outliers. This average number of hours worked includes individuals who have more than one job.
In the survey, 28 percent of respondents with a paid job are working only one part-time job. An additional 8 percent of the working respondents have two or more part-time jobs. Respondents with part-time jobs average 22 hours of work per week.30 The distribution of hours worked is broadly laid out between 0 and 40 hours with no real central tendency.
The full-time workers are more likely to have had a promotion in the past year (54 percent) and to perceive opportunities for advancement in their job (55 percent) than part-time workers (38 percent and 31 percent, respectively). The part-time workers are more likely to be students (51 percent) than full-time workers (19 percent).
Underemployment
More than half (56 percent) of the part-time workers reported being underemployed; these respondents want to work more hours than they are currently offered.31 Forty percent of part-time workers reported that they could only find part-time work, and 18 percent had their hours cut by their employer. The other half of part-time workers choose part-time jobs to support a lifestyle choice, such as attending school (54 percent), caring for family (23 percent), caring for children (16 percent), or health-related issues (8 percent).
Overall, nearly one-third of all working respondents would like additional hours of paid work; the primary reason for wanting more work is financial. Forty-three percent of respondents want more hours to cover their living expenses, 19 percent have debt, and 30 percent would like to increase their savings.
Respondents with less than a high school education reported the most need for additional hours, particularly to pay their living expenses. Respondents with a postsecondary degree are most likely to want more hours to pay off debt.
Permanent versus Temporary Jobs
Young workers entering the labor market are affected by an increase in the use of "contingent" work arrangements, characterized by contracted, part-time, temporary, and seasonal work. According to a 2011 study by the Heldrich Center, jobs for recent high school and college graduates tend to be temporary. The study found that 40 percent of recent college graduates had held more than one job since graduation. In this study, 40 percent had quit a job since graduation, while 12 percent reported being laid off.32
As a respondent's level of education increases so does their likelihood of having a permanent job. The National Longitudinal Survey of Youth 2013 found that jobs held by high school dropouts were more likely to end after one year or less than were jobs held by workers with more education.33
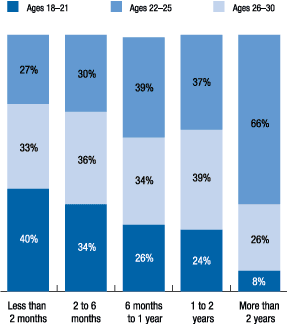
In the Survey of Young Workers, 71 percent of working respondents have a permanent job, 18 percent have a temporary position, and 10 percent are not sure of their work status.34 Significantly more young respondents, those 18 to 24 years old, held temporary jobs than the older respondents of ages 25 to 30 years old, suggesting that permanent jobs are "earned" from age and job experience. Likewise, the oldest respondents were most likely to have been in a job for two or more years (66 percent) than those 18 to 21 years old (8 percent) or their 22- to-25-year-old peers (26 percent) (figure 12).
Respondents with permanent jobs are more likely to be full-time workers (76 percent) and not enrolled in school (77 percent). Respondents with temporary jobs are more likely to be part time (61 percent) and students (52 percent).
The Survey of Young Workers indicates that 26 percent of permanent employees have some college education, and 40 percent of temporary employees have some college education. Furthermore, 25 percent of permanent employees have a bachelor's degree, and 15 percent of temporary employees have a bachelor's degree. In addition, the survey found that 65 percent of respondents with a temporary job found work through their own search, and 17 percent used personal networks. Only 9 percent of temporary workers used a temporary staffing agency to find their current position.
While permanent work arrangements often offer a career path, most temporary positions do not. Thirty-two percent of permanent workers describe their job as a "career" compared with only 4 percent of temporary workers. Likewise, 35 percent of permanent workers believe their job is a "stepping stone to a career" compared with only 31 percent of temporary workers. Temporary work typically does not offer a developmental path with only 26 percent of temporary workers reporting that they have had a promotion compared with 57 percent of permanent workers. Finally, temporary workers are more likely to report that they are overqualified for their job (36 percent) than permanent workers (28 percent).
While 71 percent of working respondents have a permanent job, only half expect to stay at their job for more than one year and nearly one-fourth are not sure. Of those who plan to leave their job within one year, 19 percent reported that their job is temporary. Despite a challenging economic environment, 38 percent of those who expect to leave their job within one year expect to leave for another job.
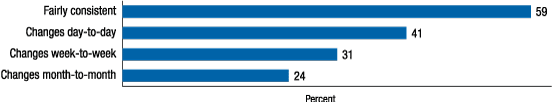
A consistent schedule is associated with greater job satisfaction (figure 13). For example, 59 percent of workers with a consistent schedule are satisfied with their current job arrangements while only 24 percent of workers with a schedule that changes month-to-month are satisfied with their current job arrangements.
Figure 13. A consistent schedule is associated with greater job satisfaction
Satisfied with work schedule
Labor Market "Push Down"
According to the Economic Policy Institute's research in 2011, many young labor market entrants who take a job for which they are overqualified are motivated by financial need, since they cannot afford to wait out the economy's downturn. However, the loss or delay of human capital that occurs when a young graduate must take a job that does not use his or her acquired skills contributes to the long-run negative effect of recessions on the wages of young workers.35
According to a study by the Center for College Affordability and Productivity, while there are undoubtedly many who benefit from higher education, many Americans who obtain higher education do not achieve these economic gains.36 This problem has been exacerbated because of job losses during the Great Recession. The study shows that the growth of supply of college-educated labor is exceeding the growth in the demand for such labor in the labor market.37
In the Survey of Young Workers, 62 percent of working respondents reported that they are "adequately qualified" for their current position. Full-time workers are more likely to report they are qualified (64 percent), and respondents who describe themselves as qualified are generally more optimistic (55 percent) than the sample as a whole.
The survey supports the theory that a lack of labor market opportunities pushed workers down the career ladder to jobs for which they are overqualified. First, 28 percent of working respondents reported that they are overqualified for their current job. Respondents with an associate's or bachelor's degree are most likely to report that they are overqualified for their job (30 percent and 35 percent, respectively). Respondents who reported they are overqualified for their jobs are more likely to be in full-time jobs (63 percent). Respondents who describe themselves as "overqualified" for their job are more likely to be pessimistic about the future (24 percent).
Second, 49 percent of those who are qualified for their job are working in a field related to their education, while only 32 percent of those who are overqualified reported the same. These results suggest that some degree holders are being "pushed down" to jobs they are overqualified for by a lack of job opportunities.
Third, those who are overqualified typically view their job as "just a job" (55 percent) rather than a career builder compared with 37 percent of total workers. Even with their skills, they are less likely to see opportunities for advancement (42 percent) than the total population (45 percent).
Finally, those without a degree may be pushed down to unemployment. In the Survey of Young Workers, 83 percent of those seeking a job have not completed a postsecondary degree. More specifically, the unemployment rate for the survey sample is 18 percent.38 In the survey, those without a postsecondary credential have an unemployment rate of 19 percent, while those with a postsecondary degree are experiencing unemployment at 10 percent. The national unemployment rate for 18- to 30-year-olds at the time the survey was administered was 18.7 percent.39
Respondents who reported they are overqualified for their job show many signs that they are working to improve their labor market prospects. For example, they are more open to moving for another job (66 percent) than total workers (56 percent). Furthermore, they are more likely to be enrolled in school (34 percent) or interested in enrolling in school (58 percent) than total workers (30 percent and 54 percent, respectively).
Upward Mobility
Despite the job push down, many working respondents have jobs with opportunities for advancement. Nearly half (49 percent) of working respondents have enjoyed a promotion at their current job. Full-time workers were much more likely to have earned a promotion (54 percent) than part-time workers (38 percent). Furthermore, 45 percent of all workers believe there is opportunity for advancement at their current job.
Financial Footing
About two-thirds of respondents (64 percent) are able to support their current household expenses with their household income. Although younger respondents were more likely to need financial assistance, age loses its significance when other demographic variables are included in the analysis. Survey findings show that being able to cover monthly household expenses is significantly affected by education, income, marital status, and having a paid job.
Although 64 percent can cover their monthly expenses, most of these respondents could not support themselves if they were temporarily out of work. Thirty-eight percent reported that they could support themselves without work for four weeks, and 24 percent would be able to support themselves without work for 12 weeks. As noted, respondents with higher levels of education are more likely to be able to support themselves if they are temporarily out of work.
Full-time workers are more likely to earn more and be financially self-sufficient than part-time workers (figure 14). Seventy-eight percent of full-time workers reported that they are able to cover their monthly household expenses compared with 52 percent of part-time workers. Sixty-six percent of workers who are not enrolled in school are able to cover their monthly expenses. Students, both full time and part time, were less able to cover their expenses (59 percent and 65 percent, respectively).
Figure 14. Full-time workers are more likely to earn higher hourly wages than part-time workers
Wages earned
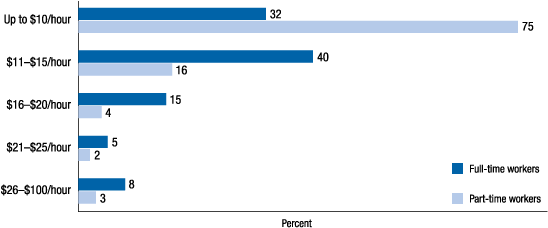
Note: Number of responses, "full-time workers" is 497; "part-time workers" is 317.
Workers with permanent jobs are more financially self-sufficient than those with temporary jobs. Respondents with permanent jobs are more likely to be able to cover their household expenses (76 percent) than those with temporary jobs (55 percent).
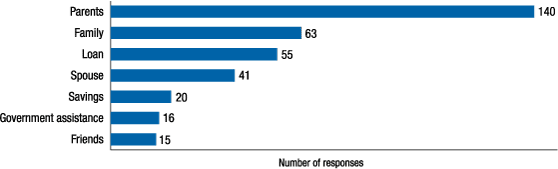
Those who are not able to cover their monthly household expenses were asked to describe, in their own words, "how they make ends meet." The largest number of respondents, 140, noted that they rely on their parents for assistance, while 63 respondents receive assistance from family members (without specifying parents) (figure 15). Fifty-five respondents reported that they take out loans of some nature, while a few reported that they rely on savings (20) or government assistance (16).
Furthermore, more than 40 percent of respondents currently receive assistance for rent and food from their parents or other family members. Thirty-eight percent of respondents receive assistance with miscellaneous bills such as the phone bill, and 30 percent of respondents receive assistance with health care.
Figure 15. Respondents who cannot cover their monthly housing expenses typically rely on their parents or other family members for assistance
In their own words, how respondents who cannot cover their monthly household expenses make ends meet (data from unstructured responses)
Compensation
In the Survey of Young Workers, 71 percent of respondents with a paid job reported that they are paid an hourly wage, and 25 percent reported that they are paid a salary (figure 16). In addition, 41 percent of working respondents earn overtime pay, tips, or commissions at their job(s).
Figure 16. Distribution of annual earnings of salaried workers in the survey
Annual earnings of salaried workers
Since compensation is correlated with numerous demographic factors including age, regression analysis was used to control for these other characteristics. As it turns out, the significance of age on having an hourly, salary, or other type of pay decreases when adding in other demographic variables. Having an hourly wage is significantly affected by having a high school diploma or some college, compared with those having less than a high school diploma. In addition, earning a salary is significantly affected by having an associate's, master's, or other professional degree.
As such, respondents with higher levels of education are more likely to earn a salary than an hourly wage. The shift to a salary is most pronounced for respondents who have at least a bachelor's degree. More than 80 percent of respondents without a four-year degree earn an hourly wage, while 49 percent of those with a bachelor's degree, 70 percent of those with a master's degree, and 79 percent of those with a professional or doctorate degree earn a salary.
Interestingly, permanent workers are only marginally more satisfied with their level of pay. Fifty-two percent of permanent workers are satisfied or very satisfied with their income compared with 46 percent of temporary workers. That said, permanent workers were far more satisfied with their benefits (49 percent) than temporary workers (16 percent).
Full-time students are more likely than part-time students to receive help from their parents to pay their bills including, living expenses, health care, car payments, educational loans, food, and miscellaneous bills than part-time students.
Salaries are more typical for traditional jobs and jobs that offer a career path. Most workers with a salary have a traditional job. Ninety-four percent of workers who earn a salary have a full-time job and 87 percent have a permanent job. Furthermore, 54 percent of respondents earning a salary describe their job as a career, while only 19 percent of full-time, hourly wage earners describe their job as a career.
Respondents who aligned their education and current work are more likely to have a higher salary as they begin their career. For example, respondents with higher salaries are more likely to have higher levels of education, to have received job information during colleges, and to have worked during the school year. Furthermore, respondents who are working in a field related to their education are more likely to have a higher salary.
Higher salaries and wages provide greater financial footing for full-time workers. Respondents with higher wages are more likely to be able to pay their monthly household expenses and to be able to stay financially afloat if they are out of work for four weeks. Furthermore, respondents with higher wages associate a greater value for the cost of their education.
Higher wages for full-time workers are correlated with other benefits including a "career" position rather than a "job," consistent work schedules, and training opportunities from employers. The respondents' level of satisfaction with their salary or wages is not correlated with the amount of their salary or wages. Rather, satisfaction is likely determined by qualitative factors including expectations.
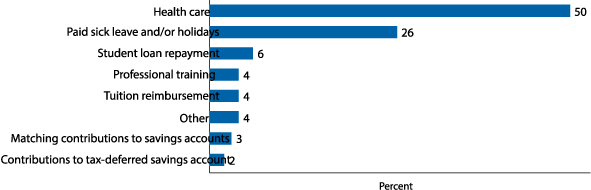
In the survey, 41 percent of working respondents are satisfied with the benefits they currently receive from their employer, while 27 percent of working respondents are not satisfied with their current benefits. Twenty-nine percent are neither satisfied nor dissatisfied with their benefits. Respondents identified health care as the most important benefit to receive from an employer (figure 17). Seventy percent of these respondents have access to health care, and 65 percent of the working respondents have access to health care through their job. Finally, working respondents reported that paid sick leave or holidays is the second most important benefit to receive from their job. Fifty-three percent of working respondents currently have paid sick leave.
Figure 17. Working respondents report that health care is the most important benefit associated with a job
Most important benefit
References
27. Philip Oreopoulos, Till Von Wachter, and Andrew Heisz (2006), "The Short- and Long-Term Career Effects of Graduating in a Recession: Hysteresis and Heterogeneity in the Market for College Graduates," National Bureau of Economic Research Working Paper 12159 (Cambridge, Mass.: NBER, April), www.nber.org/papers/w12159.pdf  . Return to text
28. C. Van Horn, C. Zukin, M. Szeltner, and C. Stone (2012), Left Out. Forgotten? Recent High School Graduates and the Great Recession (New Brunswick, N.J.: John J. Heldrich Center for Workforce Development, Rutgers, The State University of New Jersey, June). Return to text
29. J. Godofsky, C. Zukin, and C. Van Horn (2011), Unfulfilled Expectations: Recent College Graduates Struggle in a Troubled Economy (New Brunswick, N.J.: John J. Heldrich Center for Workforce Development, Rutgers, The State University of New Jersey, May). Return to text
30. The average number of hours is based on the number of hours worked the previous week. The average number of hours includes individuals who have more than one job. Return to text
31. The Bureau of Labor Statistics defines underemployment as total unemployed, plus all marginally attached workers, plus total employed part time for economic reasons, as a percent of the civilian labor force plus all marginally attached workers. Return to text
32. Godofsky and others, Unfulfilled Expectations. Return to text
33. Bureau of Labor Statistics, National Longitudinal Study of Youth 1997, 2013. See www.bls.gov/nls/nlsy97.htm. Return to text
34. Respondents used "temporary" and "permanent" to include a wide range of job arrangements. For example, 72 percent of respondents with a paid job believe that they can continue at their main job as long as they wish. This number includes 14 percent of respondents who described their job as temporary. Return to text
35. H. Shierholz and K. A. Edwards (2011), The Class of 2011: Young Workers Face a Dire Labor Market without a Safety Net. Economic Policy Institute briefing paper no. 306 (Washington, D.C.: EPI, April). Return to text
36. Richard Vedder, Christopher Denhart, and Jonathan Robe (2013), Why Are Recent College Graduates Underemployed? University Enrollments and Labor Market Realities, The Center for College Affordability and Productivity report (Washington: CCAP, January), http://centerforcollegeaffordability.org/research/studies/underemployment-of-college-graduates
. Return to text
37. Vedder and others, Why Are Recent College Graduates Underemployed? Return to text
38. Unemployment rate calculated as the percentage of the labor force who is unemployed. The labor force is defined in the Survey of Young Workers as (1) respondents with a paid job, (2) respondents who are seeking paid job, and (3) respondents who own a business or run a nonprofit. Unemployment is defined in the Survey of Young Workers as (1) respondents who are seeking paid job and (2) respondents who do not own a business or run a nonprofit. Return to text
39. Bureau of Labor Statistics, Labor Force Statistics from the Current Population Survey, table 3, "Employment status of the civilian noninstitutional population by age, sex, and race,"
http://www.bls.gov/cps/cpsaat03.htm. Return to text