FEDS Notes
September 26, 2013
Do CFOs Think Investment is Sensitive to Interest Rates?
Steve Sharpe and Gustavo Suarez
Related: FEDS 2014-02: The insensitivity of investment to interest rates: Evidence from a survey of CFOs
This piece presents results from ongoing research that takes a new look at the sensitivity of a business's capital expenditures to changes in interest rates. In theory, interest rates should be a key determinant of investment, as part of a business's " user cost " of capital; however, empirical research offers mixed evidence regarding the strength of interest rate effects on investment. Estimated effects from time-series data of changes in the user cost of capital on investment often are surprisingly small, particularly in the short run. What is more, attempts to separately estimate effects of the three components of user cost -interest rates, capital goods prices, and taxes-tend to find no negative effect from the interest rate component.
Such results generally are attributed to the difficulty of identifying interest rate changes that are exogenous with respect to observed investment. Consequently, economists tend to focus on inferences from cross-sectional studies and natural experiments, which find larger user cost effects, but which in most cases do not separately identify effects that arise from the interest rate component of user cost. Our analysis uses data from a survey of corporate executives, which asks how their firms would respond to changes in interest rates, holding other factors constant. We see this as a complimentary approach that avoids conventional identification biases.
CFO responses from nonfinancial U.S. firms analyzed
Our study uses data from the Duke University/CFO Magazine Business Outlook Survey of financial executives, mostly CFOs. Each quarter, e-mail invitations to complete the web-based survey are sent to thousands of CFOs. In recent years, around 800 to 900 U.S. companies have completed the survey each quarter. Our analysis focuses on 517 responses from CFOs of U.S. firms in nonfinancial industries who provided answers to two special questions that were included in the September 2012 survey. The respondent firms represent a wide-ranging cross-section of nonfinancial U.S. firms. All broad industry groups are represented, with about one-third of respondents from manufacturing firms. The data cover a wide spectrum of firm sizes, with one-third of them being quite small-under PPPP 25 million in revenues-and one-fifth of them reporting annual revenues exceeding PPPP 1 billion. About 22 percent of respondents are publicly owned corporations, and the rest are private companies.
Questions about influence of borrowing costs on investment plans used in study
The two key survey questions we looked at were "We'd like to better understand the extent to which borrowing costs affect your investment plans. Assuming demand and cost conditions faced by your firm and industry remain the same, please answer the following: By how much would your borrowing costs have to decrease to cause you to initiate, accelerate, or increase investment projects in the next year? " and " By how much would your borrowing costs have to increase to cause you to delay or stop investment projects? "
These questions were multiple choice and had, along with " Not applicable, " six possible responses: (1) " 0.5 percent, " (2) " 1 percent, " (3) " 2 percent, " (4) " 3 percent, " (5) " more than 3 percent, " or (6) " Likely would not change investment plans in response to an interest rate increase. " If the sixth option was chosen, the respondent was prompted with an open-ended question: " Why not? "
Majority of CFO responses indicate insensitivity of investment plans to change in interest rates
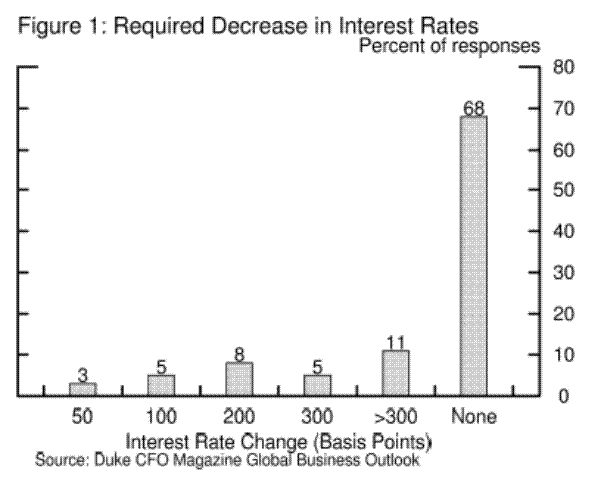
The distributions of responses are displayed in figures 1 and 2, with the response options expressed in basis points along the horizontal axis. The tall green bar indicates that 68 percent of firms reported that they would likely not change their investment plans in response to a decrease in interest rates. The next most likely response, chosen by 11 percent of firms, was " More than 300 basis points " were needed to induce a change in investment. Only 8 percent (3 percent plus 5 percent) of firms indicated that they would respond to a decline in interest rates of 100 basis points or less.
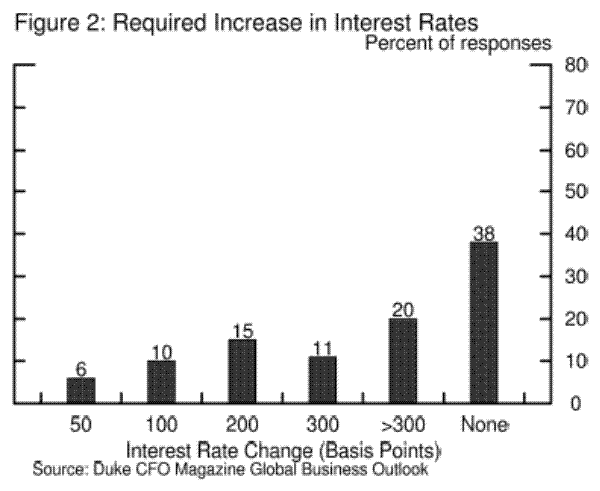
As shown by the blue bars, firms' investment plans appeared to be somewhat more sensitive to interest rate increases than to decreases, though most would apparently require a pretty large increase to induce a change. For instance, an increase of 300 basis points would leave 58 percent (20 percent plus 38 percent) of firms with plans unchanged for capital expenditures.
Factors influencing CFO responses
We next examine some key indicators that correlate with variation in respondents' sensitivities to an increase in interest rates. As shown in the table, we grouped firms into three categories based on their responses to an increase in interest rates: " Very sensitive " (those responding to 50 or 100 basis points), " Somewhat sensitive " (those requiring either 200 or 300 basis points to respond), or " Not sensitive " (those requiring more than a 300 basis point increase or reporting not likely to change plans in any case).
| Table 1 |
|---|
| Subsample of firms (number) | (1) Very sensitive (50 or 100 basis points) | (2) Somewhat sensitive (200 or 300 basis points) | (3) Not sensitive (>300 basis points or no change) |
|---|---|---|---|
| Working capital management is: A top concern (138) | 24 | 25 | 51 |
| Working capital management is: Not a concern (379) | 12 | 28 | 60 |
| To finance capital expenditures, a firm has: Plans to borrow (249) | 19 | 31 | 50 |
| To finance capital expenditures, a firm has: No plans to borrow (268) | 12 | 23 | 60 |
| Expected 12-month revenue growth is: Less than 1 percent (91) | 15 | 35 | 50 |
| Expected 12-month revenue growth is: 1 percent to 5 percent (89) | 13 | 29 | 57 |
| Expected 12-month revenue growth is: More than 5 percent (14) | 6 | 20 | 74 |
Source: Duke CFO Magazine Global Business Outlook Survey, September 2012.
We focus on three indicators constructed from responses to other questions in the survey. The first comes from a regular survey question asking respondents to indicate the top three internal company-specific concerns they face. Respondents can choose among the 13 standard concerns. A concern about " Working capital management, " which presumably would tend to be chosen by firms facing some financial constraints, was flagged as a top 3 concern by one-fourth of all respondents. More interestingly, 24 percent of those firms having working capital concerns reported being " Very sensitive " to interest rate increases, about twice the proportion of firms that are " Very sensitive " among firms that did not flag working capital concerns.
The second factor we examine is the response (yes or no) to the question of whether firms had plans to borrow to fund at least part of their investment over the next year. As shown in the middle of the table, perhaps not surprisingly, firms with plans to borrow generally exhibited greater sensitivity to interest rate increases than firms without plans to borrow.
The bottom section of the table exhibits the third characteristic with substantial predictive power, the firm's growth prospects as measured by their forecast of revenue growth over the next 12 months. The pattern is clear: Firms expecting more than 5 percent growth (third column) are substantially less sensitive to interest rate increases than those expecting little or no growth. One possible interpretation of this pattern is that firms with stronger growth opportunities were more likely to perceive marginal returns on investment to be well above current interest rates and thus were less likely to see themselves as close to the margin where changes in interest rates would bite.1
As mentioned earlier, those who reported that they were unlikely to change their investment plans in response to a change in interest rates were prompted with " Why not? " Most offered reasons that were largely concentrated around a few basic ideas. For the question regarding interest rate decreases, the most common response, provided by 32 percent of CFOs with insensitive investment plans, cited ample funding from cash flow or cash balances or reported that debt was not a marginal source of funding. In the second most common response, an additional 27 percent of CFOs said that interest rates were very low already, or that return on investment was much higher than current interest rates. The third most common reason, offered by 17 percent, was that investment decisions were based on demand, or on " long-term plans, " rather than on current interest rates. The fourth reason was a lack of profit opportunities at the current time, or, with a less negative spin, that desired projects were already funded. Less common reasons cited by a number of firms included having too much debt (or a weak balance sheet), too much uncertainty, or a lack of access to credit.
One interesting takeaway is that most firms did not suggest a lack of investment opportunities as the main source of insensitivity. More frequently, they suggested the cost of debt in particular is just not a marginal factor influencing decisions in the current environment. Indeed, if many firms set their " hurdle rates " -the expected rates of return they require to take on new projects-in a way that does not tie their hurdle rates to interest rates, then insensitivity would be less surprising. The final section of this piece reviews some additional survey data that speaks to this possibility.
A hurdle rate puzzle
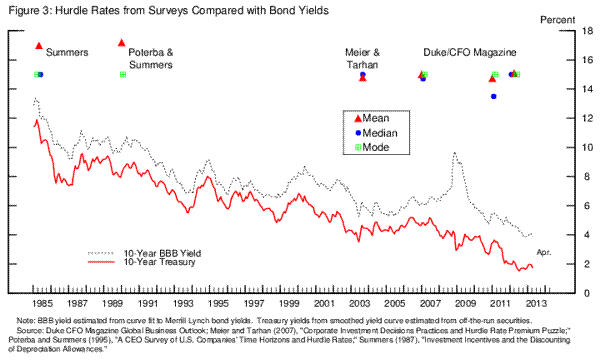
Figure 3 shows estimates of firms' average hurdle rates (red triangles) compiled from various surveys at different points in time. The most recent observation, the second quarter of 2012, and the two preceding it, 2011 and 2007, are our calculations from the Duke/CFO Magazine surveys that included questions about hurdle rates. Strikingly, it appears that the average hurdle rate was 15 percent in 2012, and it has been about 15 percent as far back as the 2003 survey by Meier and Tarhan (2007).2
Looking back to data from 1985 and 1990, Summers (1987) and Poterba and Summers (1995) found that average hurdle rates were a bit higher, at 17 percent.3 But even back then, the median and mode point to a central tendency of 15 percent. At that time, the researchers were somewhat surprised by the high hurdle rates, and since then, average hurdle rates have apparently changed little, even as the 10-year Treasury yield has dropped from 10 percent to 2 percent and the BBB yield has followed suit.
Investment link to interest rates appears looser than traditionally thought
Although the CFO survey directly asked respondents about their firms' responses to interest rate changes, we cannot know for sure whether the sample accurately represents the broader population of firms or firms' actual investment decisions. In addition, the key survey questions were asked only in September 2012, and we do not know whether responses would have been similar at other times. Also, some economists are reluctant to give much credence to inferences from survey responses to hypothetical situations, which sometimes yield odd results. Finally, our findings do not necessarily rule out a sizable aggregate investment response to changes in interest rates, which might occur if those firms that are responsive tend to alter their investment plans by large amounts. Still, together with the evidence on the apparent rigidity of investment hurdle rates (figure 3), the survey results provide some support for the view that investment is much more loosely linked to interest rates than most traditional economic models would suggest.
1. In the research behind this article, we find that all three indicators are individually and jointly statistically significant in regression analysis. Return to Text
2. Iwan Meier and Vefa Tarhan (2007), " Corporate Investment Decision Practices and the Hurdle Rate Premium Puzzle, " working paper, http://neumann.hec.ca/pages/iwan.meier/Research_Survey/Corporate%20Investment%20Practices%20092407.pdf. Return to Text
3. Lawrence Summers (1987), "Investment Incentives and the Discounting of Depreciation Allowances," in Martin Feldstein, ed., The Effects of Taxation on Capital Accumulation (Chicago: University of Chicago Press), pp.295-304; and James Poterba and Lawrence Summers (1995), " A CEO Survey of U.S. Companies' Time Horizons and Hurdle Rates, " MIT Sloan Management Review, vol. 37 (Fall), pp. 43-53. Return to Text
Please cite as:
Sharpe, Steven A., and Gustavo A. Suarez (2013). "Do CFOs Think Investment is Sensitive to Interest Rules?" FEDS Notes. Washington: Board of Governors of the Federal Reserve System, September 26, 2013. https://doi.org/10.17016/2380-7172.0002
Disclaimer: FEDS Notes are articles in which Board economists offer their own views and present analysis on a range of topics in economics and finance. These articles are shorter and less technically oriented than FEDS Working Papers.


