
FEDS Notes
 Print
PrintJanuary 31, 2014
Measuring Agency MBS Market Liquidity with Transaction Data
Sean Campbell, Canlin Li, and Jay Im
Agency mortgage backed securities (henceforth "MBS") are fixed income securities that entitle the owner to principal and interest payments on underlying residential mortgages that are guaranteed by Government Sponsored Enterprises (GSEs) such as the Federal National Mortgage Association (Fannie Mae) and the Federal Home Loan Mortgage Company (Freddie Mac), or government agencies such as the Government National Mortgage Association (Ginnie Mae). The MBS market is large, with over $7.5 trillion in outstanding debt at the end of 2013 according to the Financial Accounts of the United States. MBS fund residential investment and are used by a wide variety of market participants for investment and collateral purposes. A key feature of MBS is that the market is "liquid". Specifically, market participants perceive that they are typically able to buy and sell significant quantities of MBS without difficulty and face relatively low transaction costs. Accordingly, many MBS investors hold these securities as a liquid investment that they expect can be quickly converted to cash at low cost when the need arises while earning a positive rate of return.
Market liquidity is not easy to measure in practice. There is no single, universally agreed upon measure of "market liquidity". Two common measures of market liquidity that are used by economists and market practitioners alike are transaction volume and bid-ask spread. Transaction volume measures the total value of purchases (or sales) over a given point in time (e.g. each day). An asset that exhibits higher transaction volume is generally regarded as being "more liquid" in the sense that purchases (and sales) are more frequent. A buyer would generally have an easier time buying in a market where more transactions occur. The bid-ask spread measures the round trip transaction cost of buying and selling an asset. As with most goods, intermediaries that match buyers and sellers dealers - charge a fee for facilitating these transactions by charging higher prices to buyers (ask prices) than is paid to sellers (bid prices). The difference between the ask price and the bid price is called the bid-ask spread. Higher bid-ask spreads reflect an increased cost of matching buyers and sellers, which makes engaging in any transaction more costly and represents a "less liquid" market.
Despite the wide popularity of MBS among investors and the importance that investors place on market liquidity; until recently there has been remarkably little public information that can be used to assess the state of MBS liquidity. This is not the case in other important financial markets. In the case of exchange traded equities, for example, both transaction volumes and bid-ask spreads can be obtained at a daily frequency from a number of publicly available data sources including popular financial websites such as finance.yahoo.com. Such data is less widely available in fixed income markets, including the MBS market, which is not typically exchange traded but are dealer intermediated. The lack of similar data in the MBS market is problematic for systematically monitoring and evaluating the overall state of market liquidity.
Recently, new data has become available that can be used to assess market liquidity in the MBS market through the Financial Industry Regulatory Authority's (FINRA) TRACE reporting system. The TRACE system was developed in 2002 to increase transparency in the corporate bond market by providing data on the size and price of corporate bond transactions that are conducted by FINRA registered securities dealers. In May 2011, these reporting requirements were extended to MBS transactions as well. These data can be used for a variety of purposes including systematic measurement and monitoring of market liquidity.
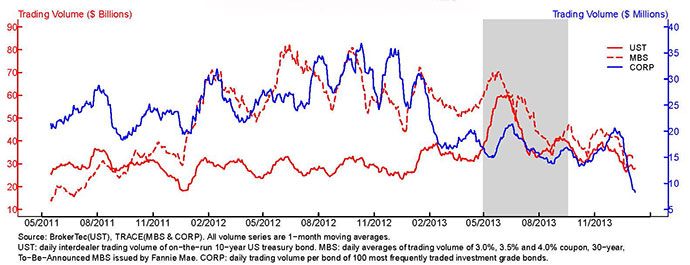
Figure 1 plots the average daily trading volume for three specific mortgage backed securities: the Fannie Mae 30 year, 3.0% coupon, 3.5% coupon, and 4.0% coupon securities. These three securities have been among the most heavily traded Fannie Mae MBS since 2011. The data shown in Figure 1 are from the "To-Be-Announced" or "TBA" mortgage market. TBA mortgages can loosely be described as a futures contract on an MBS and represent the largest and most liquid part of the overall MBS market. For comparison, we also show the daily trading volume for a typical, heavily-traded corporate bond from the TRACE universe as well as the trading volume for a newly-issued 10 year U.S. Treasury bond.1 As the plot shows, MBS trading volume is many times larger than that observed in the corporate bond market.2 Daily MBS trading volume fluctuates between $10 and $80 billion per day while trading volume in a typical, U.S. corporate bond fluctuates between $15 and $40 million per day suggesting that MBS are much more liquid than U.S. corporate bonds. Finally, MBS and U.S. Treasury trading volumes are of a similar order of magnitude though MBS trading volumes are generally larger and somewhat more volatile.
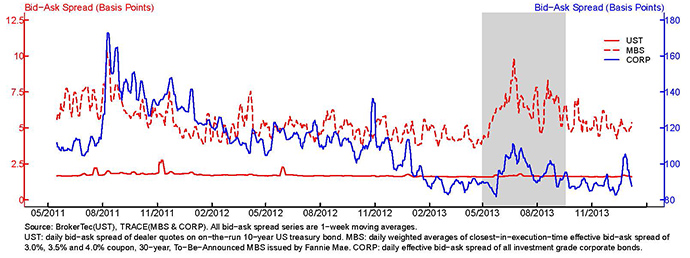
Figure 2 plots the average bid-ask spread on the MBS featured in Figure 1. As in Figure 1, we also show the bid-ask spread for a typical investment grade U.S. corporate bond and a 10 year U.S. Treasury bond. The bid-ask spreads are reported in price basis points. As a result, a value of the bid-ask spread of 100 would mean that the round-trip cost of buying and selling a bond from and to a dealer would be one percent of its face value. The bid-ask spread series for the MBS and corporate bonds presented in Figure 2 are computed by comparing the transaction price at which a dealer buys a bond from a customer with the transaction price at which a dealer sells the same bond to a customer as reported by dealers in TRACE. The difference in these two prices yields an estimate of the bid-ask spread for these two types of bonds. In contrast, the bid-ask spread series for the U.S. Treasury bond are based on bid-ask quotes obtained directly from dealers.
MBS bid-ask spreads are quite low relative to the bid-ask spread on corporate bonds and are slightly higher than those on U.S. Treasuries. More specifically, bid-ask spreads on MBS tend to range between 5 and 10 basis points while bid-ask spreads on investment grade corporate bonds tend to range between 100 and 150 basis points and spreads on U.S. Treasuries are nearly constant at roughly two basis points. The low level of volatility in the U.S. Treasury bid-ask spread is likely driven by the fact that the bid-ask spread series is taken from direct dealer quotes rather than estimated from actual transaction prices. Overall, the data in Figure 2 provide evidence that MBS liquidity is substantially higher than that of U.S. corporate bonds and is comparable to that of U.S. Treasuries.
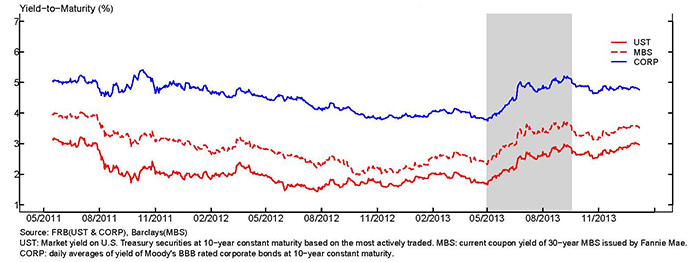
As previously discussed, market liquidity is an important market characteristic which has received increased attention from policy makers and the broader public in the last few years. In particular, events such as the financial crisis and the European debt crisis have clearly demonstrated the importance of market functioning and liquidity for the overall economy. While the TRACE data are useful for ongoing liquidity monitoring and evaluation they can also be used to evaluate the effects of specific economic and market events on liquidity. One recent event of interest in the MBS market is the rapid rise in interest rates that occurred between May and September of 2013. During this period, interest rates on 10 year U.S. Treasuries rose by roughly 100 basis points. Prior to this period the interest rate on U.S. Treasuries had been quite stable for an extended period of time. Figure 3 plots the interest rate or "yield-to-maturity" on the 10 year U.S. Treasury as well as the yield to maturity on MBS and investment grade corporate bonds over the period during which the MBS liquidity metrics are available. Also, the shaded areas in Figure 1, 2 and 3 represent the period surrounding the 100 basis point rate rise which spans from 5/1/2013 through 9/17/2013.
During this period there was a range of market commentary regarding the overall functioning and liquidity of MBS markets. In particular, during this period certain Real Estate Investment Trusts (REITs) were large holders of MBS. REITs fund their purchase of MBS with borrowed funds and a significant rise in interest rates and decline in bond prices can result in forced asset sales by levered REITs that could create pressures in the MBS market and result in diminished market liquidity and functioning.
The data in Figures 1 and 2 can be useful in evaluating the extent to which MBS liquidity was affected by this summer's rate event. Looking at transaction volume in Figure 1 provides some indication of reduced liquidity as MBS transaction volume fell during the period. Transaction volume also declined for U.S. Treasuries and corporate bonds during the rate event period. Interestingly, volumes rose somewhat in all three asset classes at the onset of the rate event before declining. The evidence presented in Figure 2 is also suggestive of some deterioration in MBS market liquidity. MBS bid-ask spreads rose from roughly 5 to 10 basis points during the period. Also, the bid-ask spread on corporate bonds rose from roughly 80 to 100 basis points during the period though the increase in spread reversed quickly. The bid-ask spread on U.S. Treasuries were unaffected over this period. Taken together, the data presented in Figures 1 and 2 suggest that this summer's rate event had some effect on liquidity in the MBS market as well as the corporate bond and U.S. Treasury markets.
Market liquidity is an important economic phenomenon that is of interest to market participants, policy makers and the broader public. Until recently a comprehensive, systematic and publicly available data source for monitoring liquidity in the MBS market was not widely available. The TRACE data that is now available is useful for analyzing liquidity conditions and for generally improving the transparency of the MBS market. The brief overview of the data provided here ignores a number of important and specific market features that would have to be considered in a more extensive analysis but should be useful for illustrating the value of these data for improving our understanding of MBS market liquidity.
1. This comparison between MBS and corporate and U.S. Treasury bonds is complicated by the fact that several distinct MBS can be used to satisfy a TBA delivery obligation while the data underlying the corporate bond and U.S. Treasury trading volume represent a single security. Return to text
2. Note the trading volume for the U.S. Treasury bond only represents interdealer trading only and does not include dealer-to-customer trades. Return to text
Please cite as:
Campbell, Sean D., Canlin Li, and Jay Im (2014). "Measuring Agency MBS Market Liquidity with Transaction Data," FEDS Notes. Washington: Board of Governors of the Federal Reserve System, January 31, 2014. https://doi.org/10.17016/2380-7172.0007
Disclaimer: FEDS Notes are articles in which Board economists offer their own views and present analysis on a range of topics in economics and finance. These articles are shorter and less technically oriented than FEDS Working Papers.
