
FEDS Notes
 Print
PrintJune 30, 2014
Repurchase Agreements in the Financial Accounts of the United States
Elizabeth Holmquist and Josh Gallin 1
Introduction
Runs on a variety of short-term funding markets were central to the financial crisis of 2007 to 2009. One of the main culprits was the market for security repurchase agreements, commonly referred to as RPs or repo (Gorton and Metrick, 2012; Krishnamurthy and Nagel, 2012; Krishnamurthy, Nagel, and Orlov, 2013). The Financial Accounts of the United States, which are produced by staff of the Federal Reserve Board, report a variety of financial statistics across broad sectors of the macro-economy, and are a commonly-referenced source of data on repo. The objectives of this note are to provide an overview of how Board staff compiles repo data for the Financial Accounts, to explain recent changes to those methods and how these changes affect our understanding of the role played by repo in the financial crisis, and to describe plans for further improvements to the repo series.
Repo in the Financial Accounts: The Basics
A repo transaction is a combination of an agreement to sell a security at a given price and an agreement to repurchase the security at a later date, typically at a higher price. For example, a broker-dealer could sell a security to a money-market mutual fund and agree to repurchase the security the next day. Thus, repo agreements are essentially short-term collateralized loans--with cash, in this example, initially being transferred from the money market fund to the broker-dealer, then with "principle and interest" being paid upon repurchase of the security the next day--and are a common source of short-term funding for financial institutions such as broker-dealers, banks, and mortgage real estate investment trusts.2
Table 1 (PDF) displays the value of repo contracts outstanding at quarter- and year-end--together with federal funds--as reported in the June 2014 publication of the Financial Accounts.3 Federal funds and repos are combined in the accounts because information about these two financial instruments is combined in some of the underlying source data. For convenience, we will use the term "repo" in this rest of this note except where a distinction with federal funds is important.4
The upper portion of the table shows how total repo liabilities in the financial system (line 1) are distributed among the sectors that borrow funds in the repo market (lines 2 through 12), and the lower portion shows how total repo assets (line 13) are distributed among sectors that lend funds in the repo market (lines 14 through 30). Board staff use data from regulatory filings, other government agencies, and private data vendors to construct sector-by-sector estimates of repo transactions and outstanding levels. For example, repo data for banks are collected from regulatory filings with the FDIC (the Call Reports) and data for broker-dealers are collected from regulatory filings with the SEC (the FOCUS and FOGS reports). The online Guide to the Financial Accounts provides more information on the data sources used for each sector.5
Because the estimates for total repo liabilities and assets are built up from sector-specific data rather than a centralized source for all repo, there is no constraint that forces the sum of repo liabilities to equal the sum of repo assets, as should be the case in aggregate. This results in a discrepancy between total reported liabilities and assets, which is reported on line 31 of the table.
Recent Changes in the Calculation of Repo Positions in the Financial Accounts
Board staff have made two types of improvements in how we calculate and present repo statistics in the Financial Accounts. First, where previously we have shown only net repo positions of selected sectors--that is, repo liabilities less repo assets--we now show repo assets and liabilities separately for all sectors to provide additional detail on repo market activity. Second, we have simplified and improved our methods for calculating repo positions for banks and broker-dealers, mainly by removing items that were not actually identified as repo (or federal funds) from the repo calculations. Krishnamurthy and Nagel (2013) identified some of these issues; details on the methodological changes are available in the appendix to this Note. "Un-netting" repo positions has the obvious effect of significantly increasing the reported size of the repo market (as measured by repo assets or repo liabilities outstanding).6 The improved methodology for calculating repo positions for banks and broker-dealers results in a smaller discrepancy between measured repo liabilities and assets.
Implications for Repo Borrowing as Reported in the Financial Accounts
As noted by Eichner, Kohn, and Palumbo (2010), although the Financial Accounts showed rapid increases in the use of repo in the years leading up to the crisis, they materially understated the level of activity--and therefore the risk to financial stability--because so much of the activity was reported on a net basis. Figure 1 shows that the improvements to our methods for calculating and reporting repo have significantly increased the reported level of repo liabilities outstanding. The reported level of repo liabilities in our most recent publication (the solid line) is well above the levels reported in March publication (the dashed line), before we un-netted repo positions and improved the repo calculations for banks and broker-dealers, and is even more substantially above the levels reported in late 2010 (the dotted line) before we began the process of un-netting repo positions. Our new, larger, measure of the repo market is more in line with figures reported by Hordahl and King (2008). Note that all three vintages of data show a large run-up of repo outstanding before the financial crisis as well as a subsequent collapse.
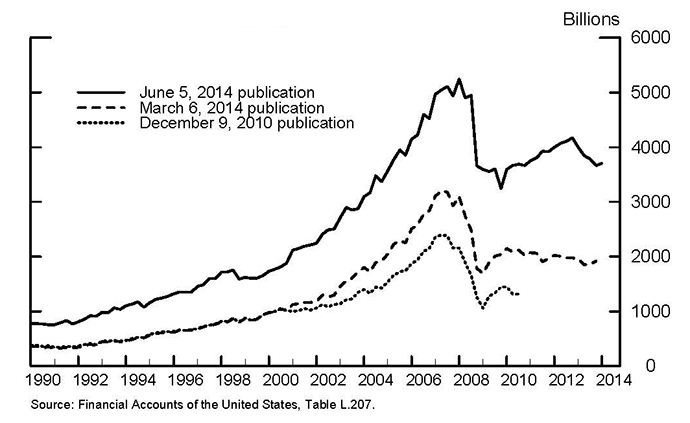
Table 2 (PDF) shows selected repo data from the March 2014 publication--in which repo positions of banks and broker-dealers were presented on a net liability basis--and the June 2014 publication--in which liabilities and assets for these sectors were shown separately. The most significant effect of the revisions is the enormous increase in total reported repo liabilities (line 1 of the table) and assets (line 5). In particular, the repo portion of the broker-dealers' balance sheet was revised up substantially (lines 3 and 7); this change accounted for the majority of the overall revision to repo.
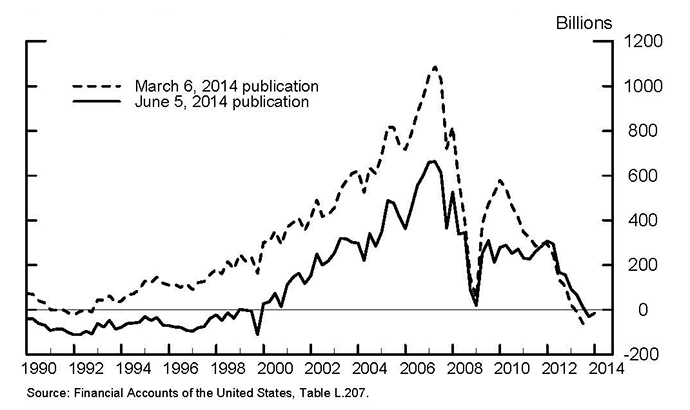
The un-netting of reported repo positions had, of course, no effect on the discrepancy between reported repo liabilities and assets because it increased both by identical amounts. However, as shown in figure 2, the improvements to the calculation of repo outstanding for banks and broker-dealers--that is, the removal of items that were not identified as repo (or federal funds)--reduced the discrepancy between reported repo liabilities and assets. However, this discrepancy is still quite large in some periods, especially around the time of the financial crisis.
Areas for Future Work
The improvements to our methods for calculating and reporting repo in the Financial Accounts have made these data much better suited for tracking, monitoring, and analyzing conditions in short-term funding markets. However, as important as these revisions are, there are many improvements yet to be made. For example, a key improvement would be to split federal funds from repo throughout the financial accounts, and we will be working to identify ways to use available data to separately identify these instruments where possible. We also plan to investigate options for providing more detail on repo transactions, such as identifying counterparty sectors, purpose, and collateral, as well as the possibility of providing better data on economically similar transactions to repo such as "securities lending." In addition, we would like to expand coverage of the Financial Accounts to institutions such as hedge funds and private liquidity funds, whose participation in the repo market currently is not properly captured in our data. Better coverage of these sectors will be directly useful and may also reduce the discrepancy between reported repo liabilities and assets in the financial accounts. We continue to evaluate data and methods to address these gaps.
Appendix: Details on Methodological Improvements to the Calculation of Repo Positions in the Financial Accounts.7
Figure 3 presents a schematic illustration of the previous and improved methods for calculating repo positions for banks and broker-dealers.8 For the purposes of understanding the schematic, assume that repo liabilities and assets have already been un-netted. We made four changes to improve our measure of repo positions, each of which is described below. The intent of these changes was to include only measures of repo and federal funds in the repo calculation, stripping out other types of borrowing and lending.
- We removed "other borrowed money" from the calculation of banks' repo liabilities, and added it to their Miscellaneous Liabilities (in purple).9
- We removed banks' "loans for purchasing and carrying securities" and "bank loans payable" from the calculation of broker-dealers' repo liabilities; they are included in banks' Security Credit instrument category (in blue).10
- We removed banks' "other loans vis-à-vis other banks" from the calculation of banks' repo assets, and added them to the Net Interbank Transactions instrument category (in green).
- We removed "banks' repo assets vis-à-vis non-banks" from the calculation of broker-dealers' repo liabilities, and added it to the calculation of banks' repo assets (in red).
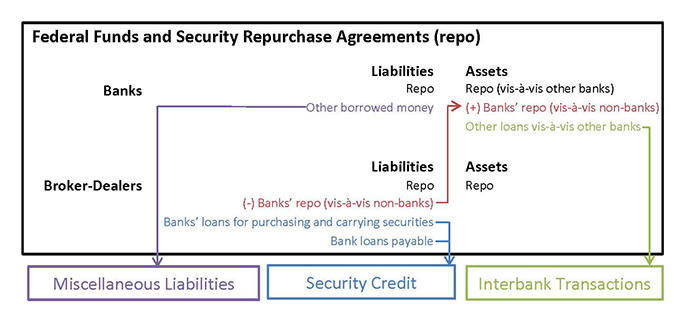
The repo discrepancy is defined as measured repo liabilities less measured repo assets. Thus, anything that lowers repo liabilities or raises repo assets will reduce the discrepancy. The first and second revisions listed above served to reduce repo liabilities--and thus the repo discrepancy--by moving those liabilities from repo to other instrument categories. The third revision reduced repo assets--and therefore increased the repo discrepancy--by moving them to Interbank Transactions. As is shown below in figure 2, overall, the revisions acted to reduce the repo discrepancy for most periods.11
References
Afonso, Gara, Entz, Alex, and LeSueur, Eric. 2013. "Who's Lending in the Fed Funds Market?"  Liberty Street Economics, December 2, 2013.
Bech, Morten L. and Atalay, Enghin. 2008. "The Topology of the Federal Funds Market". BIS Working Paper Series No. 986, December 2008.
Eichner, Matthew, Kohn, Donald, and Palumbo, Michael. 2010. "Financial Statistics for the United States and the Crisis: What Did They Get Right, What Did They Miss, and How Should They Change?" Federal Reserve Board. Finance and Economics Discussion Series 2010-20.
Gorton, Gary; Metrick, Andrew. 2012. "Securitized Banking and the Run on Repo". Journal of Financial Economics, June 2012, v. 104, iss. 3, pp. 425-51.
Hordahl, Peter and King, Michael R. "Developments in Repo Markets during the Financial Turmoil". BIS Quarterly Review, December 2008, pp. 37-53
Krishnamurthy, Arvind and Nagel, Stephan. 2013. "Interpreting Repo Statistics in the Flow of Funds Accounts". NBER Working Paper No. 19389, August 2013.
Krishnamurthy, Arvind, Nagel, Stephan, and Orlov, Dmitry. 2012. "Sizing Up Repo". NBER Working Paper No. 17768, January 2012.
1. Important analysis for this project was done by Rebecca Zarutskie, Susan McIntosh, and Luke McConnell. Thanks to Paul Smith for many helpful comments and suggestions. Return to text
2. We use the term "banks" as short-hand for the depository institution sector of the Financial Accounts, which includes U.S.-chartered depository institutions, foreign banking offices in the U.S., banks in U.S.-affiliated areas, and credit unions. Return to text
3. Federal funds are unsecured loans to domestic depository institutions from another domestic depository institution, a foreign bank, a government-sponsored enterprise, or another eligible entity. See http://www.newyorkfed.org/aboutthefed/fedpoint/fed15.html . Return to text
4. Federal funds outstanding have been fairly low relative to repo outstanding, especially since the financial crisis. Federal funds outstanding was about $350 billion, on average, per day in 2006 (Bech and Atalay, 2008), around $200 billion in 2007, and only about $60 billion in 2012 (Afonso, Entz, and LeSueur, 2013). Board staff hope to separate federal funds from repurchase agreements in the future. Return to text
5. The guide can be found at http://www.federalreserve.gov/apps/fof/. The repo and fed funds table in the Guide can be found at http://www.federalreserve.gov/apps/fof/DisplayTable.aspx?t=l.207. A description of the table can be found by clicking on the book icon next to the table title. Return to text
6. Separate repo assets and liabilities were reported for the life insurance and property-casualty insurance companies sectors beginning with the March 2011 publication, for holding companies beginning with the June 2012 publication, for government sponsored enterprises and rest of the world beginning with the December 2013 publication, and for banks and broker-dealers beginning with the June 2014 publication. The treatment of savings institutions, which are recorded with U.S.-chartered depository institutions, was harmonized with that of other depository institutions in the June 2012 publication. Return to text
7. Further details are available from the authors by request. Return to text
8. The previous method illustrated in the schematic for banks was modeled after the calculations for U.S.-chartered commercial banks. Return to text
9. "Other borrowed money" in the repo calculation excludes FHLB advances, federal government tax and loan amounts, and loans from the monetary authority. In the Call Reports, these items are included in "other borrowed money." Return to text
10. Note also that broker-dealers' loans from the Primary Dealer Credit Facility (PDCF) and the Asset-Backed Commercial Paper Money Market Mutual Fund Liquidity Facility (AMLF) were previously netted against bank loans payable in their repo liabilities calculation. Return to text
11. Note that the fourth revision had no effect on the repo discrepancy because it raised total repo liabilities and assets by the same amount. These assets were included in the previous calculation for total repo outstanding, and thus do not explain the size of the repo discrepancy. Nonetheless, the assets were misplaced in the previous calculation and therefore distorted the picture for banks and broker-dealers. Return to text
Please cite as:
Holmquist, Elizabeth Ball, and Joshua Hojvat Gallin (2014). "Repurchase Agreements in the Financial Accounts of the United States," FEDS Notes. Washington: Board of Governors of the Federal Reserve System, June 30, 2014. https://doi.org/10.17016/2380-7172.0023
Disclaimer: FEDS Notes are articles in which Board economists offer their own views and present analysis on a range of topics in economics and finance. These articles are shorter and less technically oriented than FEDS Working Papers.