
FEDS Notes
 Print
PrintSeptember 3, 2014
Risk Transfer Across Economic Sectors Using Credit Default Swaps
Sean Campbell and Josh Gallin1
Introduction
Credit default swaps (CDS) play an important role in distributing risk in the global financial system. According to data from the Bank for International Settlements, the notional value of the global CDS market grew from $6 trillion in 2004 to $24 trillion in 2013--and peaked at a level of $58 trillion just prior to the financial crisis. CDS--especially those involving AIG Financial Products--played a significant role in the financial crisis and those events motivated reforms to over-the-counter derivatives that are part of the Dodd Frank Act (DFA).
A CDS contract transfers credit and market risk from a protection buyer to a protection seller: The seller promises to insure the buyer against losses resulting from a specific credit event such as a default on a corporate bond or another "reference entity".2 In turn, the buyer pays premiums to the seller, which are based on the perceived credit quality of the entity upon which the CDS is written and the total amount of protection that is bought. Essentially, CDS allow market participants to assume the risk of a bond without actually purchasing it.
The prevalence of CDS means that one cannot determine the distribution of risk associated with fixed income instruments in the financial system simply by looking at the distribution of bond holdings as reported, for example, in the Financial Accounts of the United States (or even financial reports that show much greater detail about portfolio holdings). One needs data on both the distribution of bond holdings and the distribution of derivatives such as CDS. Such data were not widely available to regulators and investors before or during the financial crisis. However, the Dodd-Frank Act now requires that CDS transactions be reported to swap data repositories (SDRs). The data from these repositories can be used, in principle, to augment data on underlying fixed income holdings to gain a more accurate assessment of the distribution of risk associated with fixed income instruments within the financial system. In this note, we provide a brief overview on what these data can say about how market participants use CDS to shift risk across the financial system.
The Data
The Federal Reserve Board receives data on CDS contracts through the Depository Trust and Clearing Corporation's (DTCC) trade information warehouse. The data only cover CDS transactions in which one of the counterparties or the reference entity is an institution regulated by the Federal Reserve. Accordingly, the data cover a significant fraction of the CDS market but are not exhaustive. In particular, comparing our data with publicly available aggregate data from DTCC on the total volume of CDS activity suggests that our data capture 65 percent of global CDS market activity. The raw data are highly disaggregated and confidential. Thus we only report data that are sufficiently aggregated to mask counterparty identities.
We organized counterparties into sectors based on DTCC's internal classifications: asset managers, banks, dealers ("dealers" for short), financial services, insurers, hedge funds, nonfinancial corporations, pensions, and other.3 Although the classifications contain gray areas--e.g., the distinction between an asset manager and a hedge fund--they are a useful starting point for our analysis of the CDS market.
Risk Transfer at a Point in Time
Table 1 shows the total notional amount of CDS protection bought and sold in 2013 by sector. To give a sense of how to read the table, if an asset manager purchases $100 worth of CDS protection from a dealer on a particular bond, the table would show $100 of CDS protection bought by the Asset Manager sector and $100 of CDS protection sold by the Dealer sector. The values in the table are sums across all counterparties within each sector and across all reference entities.
| Table 1: Credit Risk Transfer Through CDS in 2013 |
|---|
| Sector | Positions (number) | Bought (billions of dollars) | Sold (billions of dollars) | Net Bought (billions of dollars) | Net/Gross (percent) |
|---|---|---|---|---|---|
| 1. Total | 2,722,110 | 15,058 | 15,058 | 0 | 0 |
| 2. Dealer | 2,492,892 | 12,834 | 12,943 | -109 | -0.4 |
| Net Sellers | |||||
| 3. Bank | 32,085 | 206 | 221 | -15 | -3.6 |
| 4. Insurance | 1,094 | 7 | 21 | -13 | -47.4 |
| 5. Financial Services | 3,419 | 42 | 45 | -3 | -3.2 |
| 6. Pension Plan | 1,922 | 25 | 27 | -2 | -3.2 |
| Net Buyers | |||||
| 7. Asset Manager | 56,524 | 211 | 200 | 11 | 2.8 |
| 8. Hedge Fund | 59,523 | 353 | 223 | 131 | 22.6 |
| 9. Nonfinancial Corporations | 57 | 1 | 0 | 0 | 24.6 |
| 10. Other* | 74,594 | 1,378 | 1,378 | 0 | 0 |
* Other includes the CDS positions of CCP's, and all other entities that were not classified into one of the eight sector categories.
The first salient feature of the market is its size: In our data, over 2-3/4 million contracts were written in 2013 on an aggregate notional amount of over $15 trillion dollars (line 1). Second, dealers (line 2) were by far the largest actors in the market, accounting for about $13 trillion of all protection bought and sold. Third, although the net position of the dealer sector was tiny compared to its gross position, their net position was much larger than that of most other sectors.
Consider the role of a dealer in a dealer-intermediated market: If a dealer intermediated the sale of $100 of protection between a pension and a hedge fund, one would see $100 of protection sold by the pension, $100 of protection bought by the hedge fund, and $100 of protection both bought and sold by the dealer (netting to zero). In this benchmark case the dealer's gross transactions would represent half the market. That dealers actually account for the vast majority of market activity indicates that either intermediation chains are very long and often include multiple dealers or that dealers engage in a significant amount of CDS trading for reasons beyond market making.
To get a sense of the relative importance of dealer activity, we find it useful to compare the markets for CDS and interest-rate swaps. Publicly available aggregate data from DTCC show that as of February 14, 2013, the outstanding notional volume of all interest-rate swap positions was roughly $225 trillion. Of that amount, roughly $80 trillion represented positions between dealers (interdealer trades) and $145 trillion represented positions between dealers and non-dealers. Accordingly, interdealer trading in the interest-rate swap market, though significant, is far less than that observed in the CDS market.
Aside from dealers, banks (line 3) and insurance companies (line 4) were the largest net sellers of credit protection in 2013, though these sectors also purchased large amounts of protection. The hedge fund sector (line 8) was a large net buyer of protection, but they sold a significant amount of protection as well. Pension plans, insurance companies and nonfinancial corporations were relatively minor participants in the CDS market.
The right-most column of the table presents the ratio of net protection bought to gross protection bought or sold. As such, this column shows the extent to which a given sector tends to trade in one direction or the other. A value of 100 percent of this "net-to-gross ratio" would indicate that a sector is solely a buyer of protection and a value of -100 percent indicates the sector only sells protection; a value near zero indicates that the amounts bought and sold are roughly equal.
As is expected of an intermediary, dealers exhibited the smallest absolute value of the net-to-gross ratio (0.4 percent). By this measure, the hedge fund and nonfinancial corporate sectors are, in aggregate, the most "tilted" towards being a one-way CDS protection buyer (22.6 percent and 24.6 percent ) while the financial services, and pension plan sectors are all similarly--and, at about 3-1/2 percent, only modestly--tilted toward being one-way sellers. Banks and insurers were more aggressively tilted towards selling protection.
When we began this study, we had planned to compare the net protection bought by various sectors to the book value of corporate and foreign bonds held by those sectors, as reported in the Financial Accounts of the United States. We thought such comparisons would give a sense of the extent to which these sectors insured against the credit and market risk contained in their fixed-income portfolios--that is, how they used CDS to hedge risk in their bond portfolios. We were surprised to find that, on net, a number of sectors in our data are net sellers of protection.4 At the sectoral level, rather than protecting themselves from directly held credit risk, they are using CDS to take on even more credit risk, at least in aggregate.5 For example, according to the Financial Accounts, commercial banks held about $770 billion in bonds in at the end of 2013. Table 1 shows that although banks did buy $210billion in credit protection, they also sold $225 billion in protection: Our data suggest that, on net, banks did not use CDS to shed credit risk. Rather, CDS appear to have been used to create additional exposure to the fixed income market. Only nonfinancial corporations and hedge funds were net buyers of credit protection. However, nonfinancial corporations bought and sold almost no credit protection and are net issuers of debt regardless.
Risk Transfer Over Time: 2010-2013
While Table 1 presents a snapshot of CDS positions at a point in time, Figure 1 plots net positions from 2010 through the end of 2013 for dealers, banks, hedge funds, and all other counterparties.
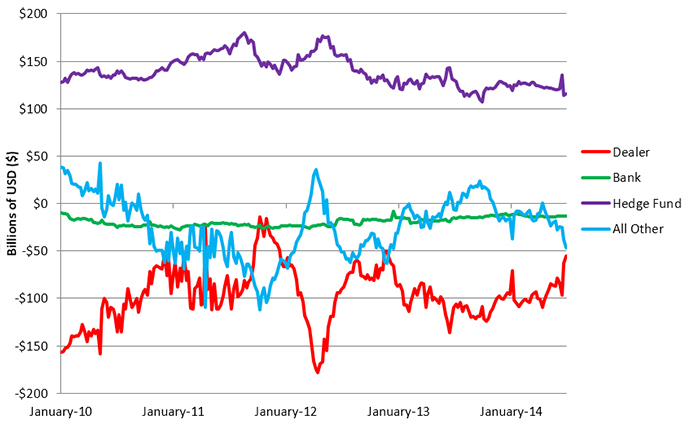
As the figure shows, the net position of each sector varies over time but some sectors are more volatile than others. In particular, the net position of dealers is the most volatile, consistent with the notion that dealers take positions to make markets for other users of CDS. Moreover, as suggested by Table 1, the only consistent net buyer of protection, in our data, has been the hedge fund sector. This pattern suggests that dealers have played both the role of "pure" intermediary and of "going long" on risk with hedge funds, at least in a net aggregate sense, taking the other side of that trade.
Conclusion
Although government statistics like the Financial Accounts of the United States are useful for tracking financial flows and asset holdings for major sectors of the economy, the accounts, as currently structured, provide no information on the use of financial derivatives to trade credit risk, interest-rate risk, foreign-exchange risk, equity-market moves, and more. Analysts and policy makers surely would have liked to have had detailed information on the use of derivatives to shift (and concentrate) such risks before the recent financial crisis--and such data is just as surely in demand now. Indeed, the kind of data that is being collected by SDR's can be used to significantly enhance our understanding of risk transfer throughout the financial system. This note provides a small taste of the kinds of data the Federal Reserve Board may be able to publish to satisfy this demand.
Our goal is to move beyond this cursory examination of the CDS data and to provide as part of the Financial Accounts (or in "satellite accounts") regular reports on the use of risk transfer: A kind of "flow of risks" report to go along with the flow of funds. Such a report would ideally include more information on CDS than was presented here. For example, we would like to explore what the types of reference entities CDS contracts are written on. Moreover, we would like to examine and present data on other derivatives, such as interest-rate swaps, mentioned above.
As described above, the analysis presented here is based on limited data that only covers a subset of the CDS market. Importantly, a successful effort to map risk transfer through derivatives requires access to high quality transactions data across all market participants--whether regulated by the Federal Reserve or not. The importance of derivatives in the global financial system underscores the need for regulators to work together across borders to establish a truly comprehensive view these markets.
1. Matthew Hoops assisted us with much of the data analysis. Return to text
2. CDS can also reference the performance of asset-backed securities and indexes of bonds. Return to text
3. We placed central counterparties (CCPs) and unclassified entities together in the "other" category to mask the identity of the three CCPs. Return to text
4. This statement only applies to the CDS data to which we have access, which is incomplete. Accordingly, it is not possible to make global statements about whether a given sector is a net seller or a net buyer of CDS protection. Return to text
5. Of course, this observation is limited by the scope of our data. The net exposure to CDS that we observe could be offset by other positions that are not contained in our data. Without a comprehensive data source on CDS transactions it is impossible to determine whether or not this is the case. Return to text
Please cite as:
Campbell, Sean D., and Joshua Hojvat Gallin (2014). "Risk Transfer Across Economic Sectors using Credit Default Swaps," FEDS Notes. Washington: Board of Governors of the Federal Reserve System, September 03, 2014. https://doi.org/10.17016/2380-7172.0027
Disclaimer: FEDS Notes are articles in which Board economists offer their own views and present analysis on a range of topics in economics and finance. These articles are shorter and less technically oriented than FEDS Working Papers.
