
FEDS Notes
 Print
PrintOctober 1, 2015
Credit Scores, Trust, and Stock Market Participation
Jesse Bricker and Geng Li *
Note: A link to a dataset of the neighborhood average credit score, introduced in the Note as a measure of social trust and social capital, was added to the bottom of this Note on August 16, 2017. The indicator is constructed at the ZIP Code level. See Bricker and Li (2017) for more details of the construction and validation of the indicator.
Investments in stocks earn a substantially higher return than investment in safer assets in the long run, even after adjusting for risks in the stock market. However, not all households own stocks (Mankiw and Zeldes, 1991), and the share of U.S. households that invest in stocks has been much lower than the standard theory predicts--a phenomenon often referred to as the "participation puzzle." For example, according to the latest Survey of Consumer Finances, fewer than 15 percent of U.S. households own stocks directly, and only about 50 percent of households own stocks either directly or indirectly through mutual funds or retirement accounts (Bricker et al 2014).
Numerous theories, such as participation costs, incomplete information, and behavioral biases, have been offered to account for the lack of stock market participation. Notably, motivated by the notion that the social capital of a society may influence its financial developments, Guido, Sapienza, and Zingales (GSZ, 2008) argue that some people choose not to invest in stocks because of their lack of trust to the system and the market. They show that the individuals who trust others have a likelihood of investing in stocks that is 50 percent higher than the average participation rate, and among stock investors, those who trust others have a share invested in stocks that is 15 percent higher than the mean stock allocation.
GSZ share an important feature with the voluminous research on trust and trustworthiness in the last three decades in that they measure trust using information collected in surveys, such as the World Values Survey (WVS) or Social Capital Community Survey (SCCS). Typically, respondents who report that they believe most people can be trusted are counted as trusting others.1 Despite being widely used in this genre of research, the exact interpretation of the responses to such questions remains an unsettled question that continues to attract active research (see Sapienza, Toldra-Simats, and Zingales, 2013, for a recent treatment on this subject). In addition, such a measure of trusting attitude is self-reported and subjective, instead of being derived from consumer behaviors using well-defined algorithms. Indeed, Putnam (1995) famously put that, "since trust is so central to the theory of social capital, it would be desirable to have strong behavioral indicators of trends in social trust and misanthropy. I have discovered no such behavioral measures."
Following Dokko, Li, and Hayes (2015), we take on this challenge and revisit the relationship between trust and stock market participation using the average level of credit scores within a community as an indicator of trusting attitude of people living in that community. The premise of using a community's average credit score to approximate its residents' trusting attitude is twofold. First, credit scores reflect people's previous experiences with credit markets and personal finance at large. The neighborhoods with lower average credit scores tend to be economically downtrodden or hit particularly hard during financially hard times. Arguably, residents in such community can feel more distrustful towards financial markets in general, including the stock market. Second, credit scores, to a certain extent, may reveal an individual's underlying trustworthiness, in addition to the likelihood of defaulting on financial obligations. Thus, other factors held constant, an individual who lives in a community where residents have higher credit scores tends to interact with more trustworthy people and thus be more trusting.
Our analysis confirms the findings of GSZ. People who live in areas with higher credit scores are more likely to own stocks and the share of stock investment in the entire portfolio is also higher for participating investors living in such areas, a result that holds even after controlling for a wide range of socioeconomic and demographic characteristics and the level of stock ownership of the community. In our baseline analysis, a one standard deviation increase in the mean credit score of a census tract (41 credit score points) boosts its residents' likelihood of owning stocks by 4 percentage points (20 percent of the mean stock market participation rate) and share of stocks in financial investment portfolio by 7 percentage points (35 percent of the mean stock allocation).
1. Using Community Average Credit Scores to Approximate Residents' Trusting Attitude
People's perceptions and attitudes may be determined in their childhood. They can also be influenced and changed throughout one's life by certain experiences and events. For example, Malmendier and Nagel (2011) present evidence that investors who experienced prolonged periods of low stock returns are less likely to later invest in stocks. Presumably, people who encountered negative credit events before, thereby having low credit scores, limited access to credit markets, and faring poorly on their personal finance, may be more distrustful towards the financial markets in general. Moreover, an individual who finds most of the people in the community he interacts to be trustworthy, thereby encountering less fraud and cheating, may have higher trust in others when dealing with personal investment and financial affairs.
Consistent with such a notion, Dokko, Li, and Hayes (2015) find that the average credit score of a community (typically a county in their data) is highly correlated with the average level of trusting attitude of the same community constructed using the 2000 SCCS. Below, we replicate figure 4 in their paper, which illustrates this correlation. Accordingly, we use the average levels of credit scores of a community to approximate the trusting attitude of its residents.
| Figure 1: Credit Scores and Trustworthiness |
|---|
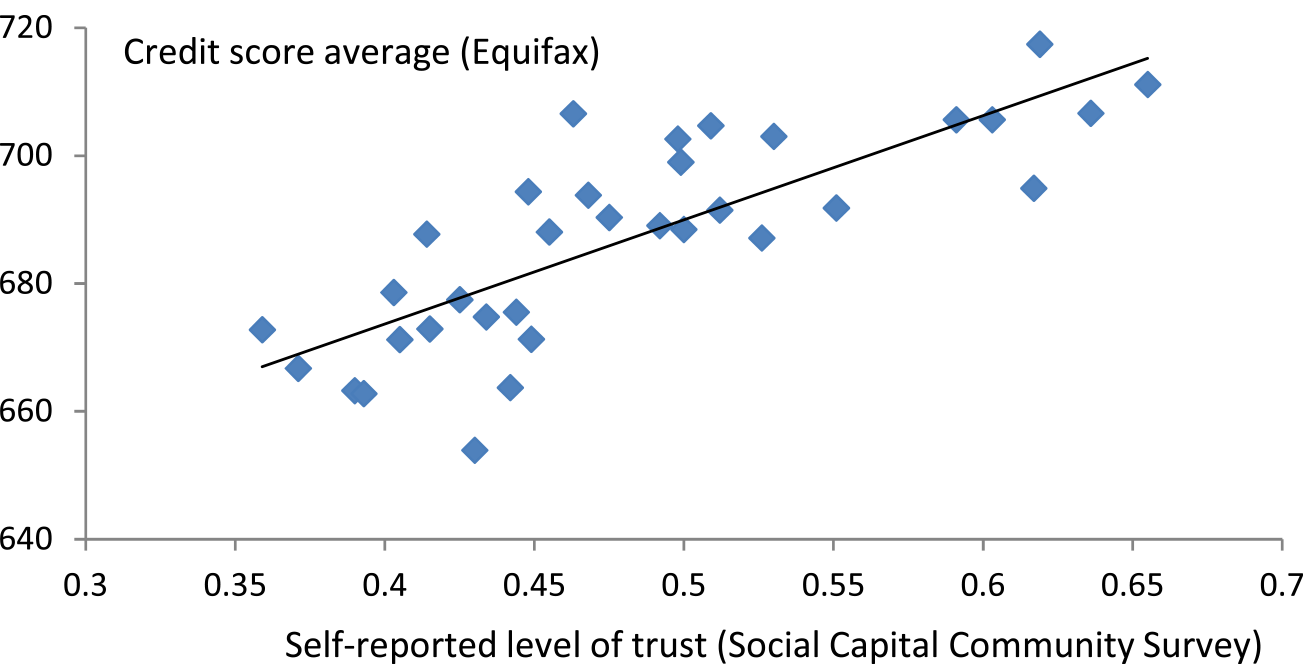 |
Note: The figure replicates the figure 4 in Dokko, Li, and Hayes (2015), which plots the weighted share of respondents who replied that "most people can be trusted" to the 2000 Social Capital Community Survey of each surveyed community (horizontal axis) against the average credit score for the same community (vertical axis). A community in the survey is typically a county.
Dokko, Li, and Hayes (2015) also document that the levels and match quality of credit scores of a couple at the onset of their relationship have a pronounced predictive power regarding future relationship outcomes, even after controlling for the credit events the couple encounters, such as new debt acquisitions and financial distress. This finding further corroborates the idea that credit scores may reveal information about an individual's underlying trustworthiness in addition to the probability of defaulting on his financial obligations.
Suppose the financial debt default probability, p, of an individual can be modeled as a function of Ω and Η, where Ω, the willingness of repaying debt, is in turn a function of his underlying (unobservable) trustworthiness, and Η, a shock to the ability of repaying that is not related to trustworthiness. This person's credit score should be an indicator of p such that score = f(Ω, Η) Μ, where Μ is an error term. Therefore, unless credit scores only pick up signals related to the ability to repay, Η, they should also reveal information regarding an individual's willingness to repay, Ω. Indeed, historically, a consumer's credit record often included soft information collected by lenders, such as whether someone was "steady and reliable", and assessments of the consumer's "reputation as to habits and morals."2 That said, it is important to remind ourselves that credit scores can be low for reasons that have little to do with individuals' general trustworthiness. For example, many people file for personal bankruptcy because of economic hardship brought on by severely adverse health events, ending up with very low credit scores.
2. Data Description and Empirical Results
We augment an econometric model that has been used extensively in stock market participation research with an array of community characteristics, including average credit scores. In our baseline analysis, a community is defined as a census tract, which has an average population of about 4,000. Specifically, we estimate the following logit model.
(1) ,
,
 is a zero-one indicator of direct stock ownership for household i who lives in Census tract t in year y.
  is the mean credit score for tract t in year y. A positive β
coefficient suggests that residents living in communities with higher credit scores are more likely to invest in stocks. Z is a vector of socioeconomic and demographic characteristics of individual investors, and Qc
is a vector of community characteristics and local economic conditions that may also affect investment decisions. Finally, Year is a vector of yearly fixed effects.
is the mean credit score for tract t in year y. A positive β
coefficient suggests that residents living in communities with higher credit scores are more likely to invest in stocks. Z is a vector of socioeconomic and demographic characteristics of individual investors, and Qc
is a vector of community characteristics and local economic conditions that may also affect investment decisions. Finally, Year is a vector of yearly fixed effects.
Our analysis uses a number of distinct data sources. For stock market participation status, share of stocks in financial portfolio, and household demographic and socioeconomic characteristics, we use the Survey of Consumer Finances (SCF), which is conducted by the Federal Reserve Board every three years and is widely regarded as the gold standard for data concerning U.S. household balance sheets. The SCF individual characteristics we use include race, the inverse hyperbolic sine transformation of household income and wealth, and bins of age, educational attainment, and risk aversions.3 For community demographic characteristics, we use 2000 U.S. Census statistics that include median income, share of college graduates, racial composition, and share of unemployed population. For local economic conditions, we use the Bureau of Labor Statistics QCEW data of employment and wage growth and the Corelogic data of house price growth, all at the county level.4
We construct the census tract level average credit scores using the Federal Reserve Bank of New York Consumer Credit Panel / Equifax (CCP) data, and link these average local area scores to the SCF data. The CCP data follow a 5 percent random sample of U.S. consumers with valid credit histories at a quarterly frequency and contain detailed information of these consumers' borrowing and repayment history and credit scores. We use only the 2004, 2007, and 2010 SCF data to ensure an accurate match with the CCP data because these three waves of the SCF data use the 2000 U.S. Census tract codes, which is what the CCP data use.
SCF data are collected by a trained field interviewer, either in person or on the phone. At the end of each completed interview, the interviewer assesses how the respondent interacted with the survey. Among these questions, the interviewer evaluates how suspicious the respondent was about the survey before the interview began. We use this interviewer-assessment to identify families that were "not at all suspicious" of the interview, effectively creating a proxy for trusting attitudes. Note that, in contrast to the WVS or SCCS survey measures, this measure of trusting attitude in the SCF is not self-reported but interviewer-assessed. This measure of trust is positively correlated with mean census tract credit score. Compared to families that were "very suspicious" of the interview, families that were not suspicious lived in areas with mean credit scores six points higher than families that were suspicious, reassuring us that the community average credit score is consistent with measures of trusting attitudes of its residents. We include this interviewer-assessed measure of trust later in the regression analysis for robustness.
The model is estimated with standard errors clustered at the census tract level, and the results are reported in column 1 of table 1. As shown in the odds ratio estimates presented in brackets, a one standard deviation increase in the average credit score (41 credit score points) of the census tract an investor resides is associated with a 27.5 percent increase in the likelihood of investing directly in stocks, an estimate that is highly significant. The estimated effects of the control variables (not shown) are all consistent with findings in previous studies of stock ownership--investors who are more educated, less risk averse, white, and have higher income and wealth are more likely to own stocks. Interestingly, while the median income and racial and educational attainment composition of a tract are highly correlated with the average credit score of that tract, such community characteristics do not appear to have an effect on stock market participation decision. Regarding local economic conditions, our estimates indicate that better labor market conditions boost stock investments but higher house price growth reduces stock market participation, with the latter perhaps representing a substitution effect between investment in stocks and in real estate properties.
| Table 1: Trust Effects on Stock Market Participation: Direct Investment |
|---|
| Market participation | Stock shares | ||||
|---|---|---|---|---|---|
| Logit | Tobit | ||||
| (1) | (2) | (3) | (4) | (5) | |
 |
0.587*** | 0.582*** | 0.273* | 1.551*** | 0.109*** |
| (0.140) | (0.140) | (0.153) | (0.547) | (0.030) | |
| [1.275] | [1.272] | [1.119] | [1.900] | ||
| SCF trust indicator | 0.143** | ||||
| (0.060) | |||||
| [1.153] | |||||
| Local stock ownership | 1.903*** | ||||
| (0.396) | |||||
| [1.257] | |||||
| × Years of education |
-0.067* | ||||
| (0.036) | |||||
| [0.972] | |||||
| Individual characteristics | Yes | Yes | Yes | Yes | Yes |
| Tract characteristics | Yes | Yes | Yes | Yes | Yes |
| Local economy conditions | Yes | Yes | Yes | Yes | Yes |
| Yearly fixed effects | Yes | Yes | Yes | Yes | Yes |
| N | 14,122 | 14,122 | 14,013 | 14,122 | 14,122 |
Note: Standard errors are presented in parentheses. Odds-ratios associated with a one standard deviation change of the independent variables are presented in brackets. Data are 2004, 2007, and 2010 SCF, pooled together. Credit score averages are calculated using the FRBNY CCP/Equifax data. Standard errors are clustered at Census tract level and corrected for multiple imputation.
Although the SCF interviewer-provided assessment of the investors' trusting attitude is correlated with tract average credit scores, adding it as an additional control does not qualitatively change the baseline result (column 2). On its own right, consistent with the notion that more trusting investors are more likely to invest in the stock market, the estimated odds ratio for the SCF measure of trust indicates that the respondents who appeared to be more trusting of the survey are on average 15 percent more likely to invest in stocks, a margin that is also statistically significant.
Instead of the effects of trust on stock investment, the estimated β coefficient may reveal the fact that high credit score communities tend to have high stock ownership, which leads to more efficient information sharing that in turn induces a higher probability of individual residents investing in stocks. To further isolate the trust effect from this potential information channel, we add, as an additional control, the local share of stock ownership, which we estimate at the ZIP code level from the Statistics of Income (SOI) data released by the Internal Revenue Service.5 As shown in column 3, families living in a ZIP code that has a one standard deviation higher stock ownership have a 25 percent higher likelihood of owning stocks directly themselves. In this specification, the estimated β coefficient is appreciably smaller but significant statistically and sizeable economically. The reason why controlling for local stock ownership reduces the magnitude of β is that an area's average credit score tends to be highly correlated with its average stock ownership. While the cross-sectional analysis we implement in this note cannot fully address this endogeneity, we suspect that the true effect of trust on stock market participation should be somewhere between the estimates of column 1 and 3.
We further explore whether the trust effect is particularly pronounced among a particular subpopulation. We hypothesize that such an effect diminishes with an investor's financial literacy as higher financial literacy enables more rational financial decisions that are influenced to a less extent by emotional, cognitive, or behavioral factors. To do so, we interact average tract credit scores with the years of education of the investor. Consistent with our hypothesis, the trust effect is significantly attenuated for investors with higher educational attainments (column 4). Our estimates imply that the trust effect on a college graduate (years of education = 16) is only about 60 percent of the trust effect on a high school graduate (years of education = 12) who have otherwise similar demographic characteristics.
Finally, we study the effect of trust on the share of stock investment in household financial asset portfolios by estimating a tobit model with the same controls as in column 1. The results, reported in column (5) imply that a one standard deviation increase in tract mean credit score is associated with a 5 percentage point increase in stock investment share (20 percent of the mean stock investment share). The results presented in table 1 hold qualitatively when stock investment is defined as owning stock directly or through mutual funds or retirement accounts. These results also hold for an analysis at the county, instead of the census tract, level.
3. Summary and Next Steps
The long-run return to stock investment is higher than the return on investment in safer assets, which makes the low rate of participation in equity markets puzzling. Recent work underscores the importance of trust in explaining this puzzle (GSZ, 2008). This strand of literature typically uses self-reported and subjective measures of trust. Following Dokko, Li, and Hayes (2015), we use average credit scores in a community to approximate the trust level in the community. Using detailed information in the Survey of Consumer Finances and proprietary data from a major credit reporting agency, we find that investors who live in areas with higher levels of trusting attitudes have a higher likelihood of stock market participation and a greater share of stock investment, conditional on a wide variety of economic characteristics of the family and of the community. This finding is robust to the inclusion of an external assessment of the trusting attitude of the investor.
The above analysis squarely focuses on the cross-sectional correlation between trust (measured using community average credit scores) and the status and intensity of stock investment. While we strive to control for the factors that may independently affect stock investment, selection and endogeneity concerns remain. For example, a stock investor may choose to live in a neighborhood with a higher average credit score, thereby leading to an observed correlation between credit scores and stock investment. Using an identification strategy similar to Li (2014), the next step on our research agenda is to exploit the longitudinal structure of the Panel Study of Income Dynamics (PSID) to study whether the households who did not own stocks before begin to participate in the stock market several years after relocating to communities of higher credit scores. We will focus on the change in participation status that occurred several years after relocation to allow the movers to be fully exposed to the new level of trustworthiness of the community they moved into.
References
[1] Bricker, Jesse, Lisa J. Dettling, Alice Henriques, Joanne W. Hsu, Kevin B. Moore, John Sabelhaus, Jeffrey Thompson, and Richard A. Windle (2014) "Changes in U.S. Family Finances from 2010 to 2013: Evidence from the Survey of Consumer Finances," Federal Reserve Bulletin, vol. 100 (September), pp. 1-41.
[2] Guiso, Luigi, Paola Sapienza, and Luigi Zingales (2008). "Trust the Stock Market," Journal of Finance, vol. 63 (December), pp. 2557-600.
[3] Dokko, Jane, Geng Li, and Jessica Hayes (2015). "Credit Scores and Committed Relationships," Working Paper, 2015.
[4] Li, Geng (2014). "Information Sharing and Stock Market Participation: Evidence from Extended Families", Review of Economics and Statistics vol. 96 (February), pp. 151-60.
[5] Malmendier, Ulrike and Stefan Nagel (2013). "Depression Babies: Do Macroeconomic Experiences Affect Risk Taking?" Quarterly Journal of Economics vol. 126 (February), pp. 373-416.
[6] Mankiw, Gregory and Stephen Zeldes (1991). "The consumption of stockholders and nonstockholders", Journal of Financial Economics vol. 29 (March), pp. 97-112.
[7] Putnam, Robert (1995). "Bowling Alone," Journal of Democracy vol. 6 (January) pp.65-78.
[8] Sapienza Paola, Anna Toldra, and Luigi Zingales (2013). "Understanding Trust," The Economic Journal, vol. 123 (June) pp. 1313-32.
Data file
*. We thank our colleagues at the Federal Reserve Board for helpful discussions. Jessica Hayes and Taha Ahsin provided excellent research assistance. The views expressed herein are those of the authors and do not necessarily reflect those of the Board of Governors of the Federal Reserve System or its staff. Return to text
1. These surveys ask questions like "Generally speaking, would you say that most people can be trusted or that you have to be very careful in dealing with people?" Return to text
2. See Dokko, Li, and Hayes (2015) for details of such historical credit records. Return to text
3. Families are classified into four financial risk aversion bins: Those willing to take substantial financial risk, above average financial risk, average financial risk, or those unwilling to take any financial risk. These classifications are based on responses to question x3014 in the SCF, a question that asks families to describe the amount of financial risk that they are willing to take when making investments. Return to text
4. A county typically includes multiple census tracts. Return to text
5. These shares are computed as the ratio of the number of filers with ordinary dividend income (line 9a of Form 1040) in a ZIP code to the total number of filers in that ZIP code. We use the public release of the 2012 SOI ZIP code file (the first available data with the number of filers with dividend income by ZIP code). Return to text
Please cite as:
Bricker, Jesse, and Geng Li (2015). "Credit Scores, Trust, and Stock Market Participation," FEDS Notes. Washington: Board of Governors of the Federal Reserve System, October 01, 2015. https://doi.org/10.17016/2380-7172.1588
Disclaimer: FEDS Notes are articles in which Board economists offer their own views and present analysis on a range of topics in economics and finance. These articles are shorter and less technically oriented than FEDS Working Papers.
