
FEDS Notes
 Print
PrintJune 19, 2015
The Effects of Liquidity Regulation on Participation in the Term Deposit Facility
Marcelo Rezende and Mary-Frances Styczynski1
This note studies the effects of liquidity regulation on the participation of commercial banks in Term Deposit Facility (TDF) operations. We find that banks subject to the Liquidity Coverage Ratio (LCR) submit tenders relatively more often than banks not subject to it in operations that allow banks to withdraw funds prior to the maturity date. Given that term deposits must have an early withdrawal feature (EWF) in order to qualify as high-quality liquid assets (HQLA) under LCR requirements, this result suggests that the LCR influences banks' participation in TDF operations.
Background on the TDF and LCR Regulation
The TDF is a tool created by the Federal Reserve that could be used to drain reserves as part of the process of monetary policy normalization. The Federal Reserve offers term deposits through the TDF to depository institutions that are eligible to receive interest from Federal Reserve Banks.2 The funds placed in a term deposit are deducted from the institution's reserve account for the life of the term deposit and thus cannot be used to satisfy an institution's reserve balance requirement.3 From a monetary policy perspective, the removal of balances from institutions' reserve accounts drains reserves from the banking system, enhancing policymakers' ability to control money market rates. From the institutions' perspective, term deposits are an asset that they hold with the central bank that earns an interest rate that exceeds the interest rate paid on excess reserves.
As part of the tests of the TDF, the Federal Reserve has changed many characteristics of the term deposits offered. Characteristics that have varied across operations include the operation format (offering a fixed or floating interest rate), the maturity, the interest rate, the time between the operation and its settlement, and the maximum tender amount. In addition, while past operations did not allow institutions to withdraw funds prior to maturity, all operations from October 2014 to the present include an EWF, subject to a pecuniary penalty. The penalty for withdrawing a term deposit early involves the forfeiture of all interest and an annual penalty rate of 0.75 percent applied to the term deposit principal amount.
The EWF should increase demand for term deposits among large institutions in particular because, like excess balances, term deposits with an EWF help these institutions to meet LCR requirements. The LCR is the ratio of an institution's HQLA amount to its projected net cash outflows over a 30-day period. The EWF qualified TDF funds as Level 1 HQLA in LCR calculations, and thus made TDF an alternative to holding other Level 1 HQLA assets such as excess reserves and U.S. Treasury securities.4
The LCR applies to large institutions and will be implemented gradually over the next two years. The standard LCR applies to all banking organizations with $250 billion or more in total consolidated assets or $10 billion or more in on-balance-sheet foreign exposures and to these banking organizations' subsidiary depository institutions with assets of $10 billion or more. The modified LCR, a less stringent version of the LCR, applies to bank holding companies and savings and loan holding companies that do not meet these thresholds but have $50 billion or more in total assets. Institutions subject to the standard version must have an LCR of at least 80, 90, and 100 percent by January 2015, 2016, and 2017, respectively, while institutions subject to the modified version must have an LCR of at least 90 and 100 percent by January 2016 and 2017, respectively. Thus, in 2014, when most of the TDF operations in our sample were conducted, the LCR did not apply to any institutions; and in 2015, when the other operations in our sample were conducted, it applied only to standard LCR institutions. However, LCR institutions should be relatively more interested in gaining familiarity with the TDF before the LCR applies to them. In this note, we investigate whether the EWF did indeed cause an increase in the participation of LCR banks that exceeds the change in participation by non-LCR banks.
Data
We use a panel in which each observation is a commercial bank-TDF operation pair. The panel is composed of the 3,924 domestically chartered commercial banks that were eligible to participate in all 15 TDF operations offering maximum award amounts greater than or equal to $10 billion. These operations were conducted between May 19, 2014, and February 19, 2015.5 Domestic banks include U.S. chartered commercial banks and exclude U.S. branches or agencies of foreign banking organizations.
We restrict the data to domestic institutions because their participation in TDF operations should be more sensitive to U.S. liquidity regulation. We also restrict the data to commercial banks, instead of all depository institutions that can participate in TDF operations, because HQLA data are available only for commercial banks.6 In addition, we restrict the data to operations with a maximum award amount of at least $10 billion to eliminate observations from operations in which large banks possibly did not submit tenders because they considered the maximum award amounts too low.
For each bank-operation pair, the data include the dollar amounts of the bank's total excess reserves in the most recent week before the operation, which are obtained from internal Federal Reserve databases. The data also include the total assets and HQLA from the most recent quarter before the operation, which are obtained from quarterly reports of condition and income.7
Effects of the LCR on Participation in TDF Operations
In this section, we investigate whether the LCR affects the decision of banks to submit tenders in TDF operations. We start analyzing average participation rates of banks depending on whether they are subject to the LCR and whether the operations have an EWF. We use a simple indicator of whether a bank is subject to the LCR. This indicator is equal to 1 if the bank holds $50 billion or more of total assets and equal to 0 otherwise. Thus, this indicator does not account for cases in which a bank with assets between $10 billion and $50 billion is subject to the LCR because it is affiliated with a banking organization with $250 billion or more in total consolidated assets or $10 billion or more in on-balance-sheet foreign exposures. However, the results do not change much if the indicator also accounts for these cases because of the small number of such banks.
As shown in table 1, banks subject to the LCR submit tenders relatively more often than banks not subject to it in operations with an EWF. Non-LCR banks participate in less than 1 percent of operations with and without an EWF (panels 1.a and 1.b), while LCR banks participate in 21 percent and 36 percent of operations without and with an EWF (panels 2.a and 2.b), respectively, suggesting that the LCR causes a larger response to an EWF.8 However, these summary statistics do not account for other characteristics of bank-operation pairs that may determine whether a bank is subject to the LCR, an operation has an EWF, or a bank participates in an operation. For this purpose, we next describe an empirical strategy that accounts for those characteristics and allows us to properly investigate whether TDF participation depends on whether a bank is subject to the LCR and whether the operation has an EWF.
| Table 1: Summary Statistics of Banks and TDF Tenders |
|---|
| Variable | Obs. | Mean | Std. Dev. | Min. | Max. |
|---|---|---|---|---|---|
| 1. Banks with less than $50 billion in assets | |||||
| a. Operations without an EWF | |||||
| Submitted a TDF tender (percentage points) | 19,394 | 0.48 | |||
| TDF tender amount | 19,394 | 1 | 40 | 0 | 1,740 |
| Assets | 19,394 | 792 | 2,583 | 4 | 46,229 |
| Excess reserves | 19,394 | 33 | 271 | 0 | 12,393 |
| HQLA | 19,394 | 95 | 496 | 0 | 15,323 |
| b. Operations with an EWF | |||||
| Submitted a TDF tender (percentage points) | 38,882 | 0.57 | |||
| TDF tender amount | 38,882 | 2 | 55 | 0 | 5,700 |
| Assets | 38,882 | 828 | 2,705 | 4 | 48,353 |
| Excess reserves | 38,882 | 37 | 285 | 0 | 13,674 |
| HQLA | 38,882 | 97 | 577 | 0 | 20,936 |
| 2. Banks with $50 billion or more in assets | |||||
| a. Operations without an EWF | |||||
| Submitted a TDF tender (percentage points) | 165 | 21.21 | |||
| TDF tender amount | 165 | 978 | 2,496 | 0 | 10,000 |
| Assets | 165 | 310,742 | 475,870 | 60,464 | 2,002,047 |
| Excess reserves | 165 | 27,173 | 56,987 | 0 | 274,281 |
| HQLA | 165 | 70,849 | 120,577 | 4,928 | 546,944 |
| b. Operations with an EWF | |||||
| Submitted a TDF tender (percentage points) | 330 | 36.36 | |||
| TDF tender amount | 330 | 3,280 | 6,361 | 0 | 20,000 |
| Assets | 330 | 323,036 | 493,036 | 53,547 | 2,074,952 |
| Excess reserves | 330 | 30,087 | 65,580 | 0 | 390,977 |
| HQLA | 330 | 81,017 | 132,900 | 3,921 | 656,176 |
Note: Each observation is a bank-operation pair. All variables are measured in millions of U.S. dollars unless stated otherwise.
Figure 1 motivates our empirical strategy. In this figure, the horizontal axis measures bank assets and the vertical axis measures participation rates. We divide bank-operation pairs in intervals of total assets equal to 0.2ln(7) and depending on whether the operation has an EWF.9 Then, each point in the chart represents the average participation rate of all bank-operation pairs ij in each interval of assets and EWF status. The curves in the chart are third-order polynomials estimated separately for observations on each side of the $50 billion threshold and for operations with and without an EWF.10 The solid and the dashed curves show the polynomials estimated with data from operations with and without an EWF, respectively. The curves show that participation rates jump at the threshold in operations with and without an EWF. However, the jump is larger for banks just to the right of the threshold than for banks just to the left, which is consistent with a positive effect of LCR coverage on TDF participation. Based on this evidence, we construct a regression discontinuity research design to break the endogeneity between TDF participation and LCR coverage.
| Figure 1: Participation of Banks in TDF Operations |
|---|
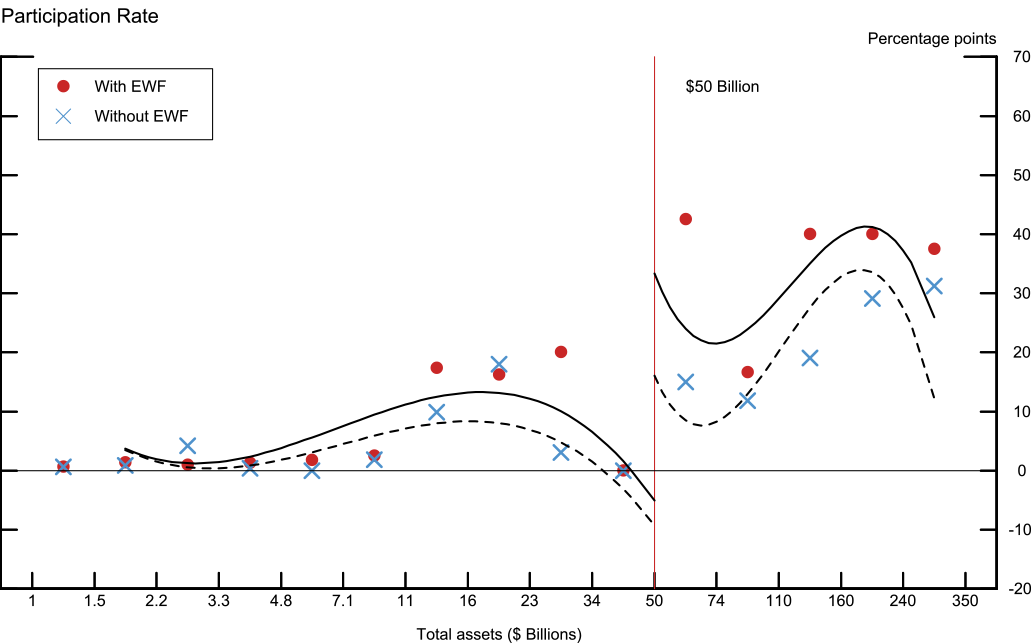 |
Note: This figure shows the average participation rates of commercial banks in TDF operations with a maximum award amount of at least
$10 billion. The horizontal axis measures bank assets and the vertical axis measures participation rates. We divide bank-operation pairs in intervals of total assets equal to 0.2ln(7) and depending on whether the operation has an EWF. Then, each point in the chart represents the average participation rate of all bank-operation pairs ij in each interval of assets and EWF status. The curves in the chart are third-order polynomials estimated separately for observations on each side of the $50 billion threshold and for operations with and without an EWF. The solid and the dashed curves show the polynomials estimated with data from operations with and without an EWF, respectively. To estimate these polynomials we restrict the sample to observations from banks with assets between $2 billion and $1,250 billion. The chart does not show observations from banks with assets above $350 billion to maintain the information on participation confidential.
We estimate the following equation:
Yij = ΒI( Aij ≥ 50bi ) × EWFj + ΘXij + f ( ln(Aij ) − ln ( 50bi ) ) + νi + φj + εij, (1)
where Yij is a dummy variable that is equal to 1 if bank i submitted a tender in operation j and equal to 0 otherwise. I( Aij ≥ 50bi ) is the indicator function of whether the assets of bank i at the time of operation j were larger than or equal to $50 billion, or, equivalently, the indicator of whether this bank was subject to the LCR during this operation. EWFj is the indicator of whether the operation has an EWF and thus I( Aij ≥ 50bi ) × EWFj is the interaction term between the LCR and the EWF, which we use to identify the effect of the LCR on the demand for TDF deposits. This effect is measured by the coefficient Β. Θ is a vector of coefficients and Xij is a vector of bank characteristics, namely the ratio of excess reserves to total assets and the ratio of HQLA to total assets, which may vary across operations. νi is a bank random effect, φj is an operation fixed effect, and εij is a bank-operation-specific unobservable error. νi and εij have independent normal distributions with a mean of zero and variance σν2 and σε2. f (.) is a flexible function of assets normalized by the LCR threshold of $50 billion. In the results presented in table 2, we assume that f (.) is a third-order polynomial that is different in each side of the threshold, but our results are robust to changes in its functional form.11
Column 1 of table 2 shows results using all observations. The 0.15 coefficient of the interaction term between the LCR and the EWF is statistically significant. This coefficient implies that the odds that a bank covered by the LCR submits a tender increases 15 percentage points more than the odds that a bank not covered by the LCR submits a tender if the operation includes an EWF.
| Table 2: Measuring the Effect of LCR on TDF Participation |
|---|
| (1) | (2) | |
|---|---|---|
| Variable | All Commercial Banks | Commercial Banks with Assets between $2 billion and $1,250 billion |
| EWF × LCR indicator | 0.15** | 0.12* |
| (0.06) | (0.06) | |
| Excess reserves ratio | 0.02 | 0.29 |
| (0.02) | (0.19) | |
| HQLA ratio | 0.02 | 0.23 |
| (0.01) | (0.14) | |
| Observations | 58,771 | 4,374 |
| Banks | 3,924 | 302 |
| R-squared | 0.15 | 0.17 |
Note: This table shows estimates of equation (1). The dependent variable is equal to 1 if bank i participated in operation j and is equal to 0 otherwise. The LCR indicator is equal to 1 if bank i's total assets are equal to $50 billion or more and equal to 0 otherwise. Both specifications include third-order polynomials of the natural logarithim of the difference between bank i's total assets and $50 billion that are different on each side of the $50 billion threshold. In addition, both specifications include operation fixed effects. Standard errors are clustered at the bank level.
* and ** denote significant at the 5 and 1 percent levels, respectively. Return to text.
In regression discontinuity designs, it is standard practice to restrict the sample to observations close to the discontinuity in the treatment, which in the case of the LCR is at $50 billion, because observations away from the discontinuity should have no weight in the estimation of treatment effects (Lee and Lemieux, 2010). Thus, in column 2, we restrict the sample to observations with the natural logarithm of assets at most ln(25) lower or higher than ln(50 billion)--that is, with assets between $2 billion and $1,250 billion. This reduces the number of observations and of banks to less than a tenth of the full sample numbers--that is, from 58,771 to 4,374 observations and from 3,924 to 302 banks. Despite this restriction in the sample, the results in column 2 confirm the finding in column 1 that the LCR affects the demand for TDF deposits, but the magnitude of the effect is smaller: The 0.12 coefficient is statistically significant and implies that the odds that a bank covered by the LCR submits a tender increases 12 percentage points more than the odds that a bank not covered by the LCR submits a tender if the operation includes the EWF. In summary, the results in this table suggest that banks respond to the LCR by increasing their participation in TDF operations.
References
Lee, David S., and Thomas Lemieux, (2010). "Regression Discontinuity Designs in Economics." Journal of Economic Literature, vol. 48 (2), pp. 281-355.
1. We thank James Clouse, Francisco Covas, Jeff Huther, and Beth Klee for comments. We also thank Johnathan Hamburg and Cindy Vojtech for kindly providing the data on the Term Deposit Facility and on high-quality liquid assets, respectively, and Becky Zhang for excellent research assistance. Return to text
2. An institution can participate in TDF operations if it is eligible to receive interest from the Federal Reserve and if it has a location to settle funds from TDF transactions. Interest eligibility is defined by Regulation D. Institutions eligible to receive interest from the Federal Reserve include commercial banks, thrifts, and credit unions. Return to text
3. Depository institutions hold two types of balances in their reserve accounts at the Federal Reserve: balances held to satisfy federally mandated reserve balance requirements (RBR) and excess balances or balances above those held to satisfy RBR. Return to text
4. Level 1 is the highest category of HQLA in the U.S. LCR rule. Level 1 HQLA are not subject to a haircut or to a cap in the LCR calculation. Level 2A and 2B HQLA, the other two categories, are subject to haircuts and caps. For more information, please refer to Board of Governors of the Federal Reserve System, Federal Deposit Insurance Corporation, Office of the Comptroller of the Currency (2014), "Liquidity Coverage Ratio: Liquidity Risk Management Standards," final rulemaking (Docket No. R-1466), Federal Register, vol. 79 (October 10), pp. 61445-61541. Return to text
5. Operation details are available on the Federal Reserve Board's website under Monetary Policy and Policy Tools. Return to text
6. Our main results also hold when we include all domestic depository institutions in the data. In this case, however, we cannot include HQLA data in our regression analysis. These results are available from the authors upon request. Return to text
7. The term "reports of condition and income" refers to the Consolidated Report of Condition and Income (FFIEC 031 and FFIEC 041). HQLA is not directly reported in those forms. The details of how to calculate HQLA are available upon request. Return to text
8. In addition, LCR banks submit tenders relatively larger than non-LCR banks in operations with an EWF. The average tender amount submitted by a non-LCR bank in operations with an EWF, equal to $2 million, is twice as large as the average tender submitted in operations without an EWF, equal to $1 million; meanwhile, the average tender submitted by an LCR bank in operations with an EWF, equal to $3 billion, is more than three times larger than the average tender submitted in operations without an EWF, equal to $978 million. However, in this note we restrict our analysis to participation in TDF operations, as opposed to tender amounts, because tender amounts are more sensitive to the effects of the maximum award amounts allowed in TDF operations. Return to text
9. We divide pairs into intervals equal to 0.2ln(7) to ensure that each interval contains observations from at least four different banks. This reduces the effects of noise on the average participation rates shown in figure 1. In addition, it keeps information on participation at the bank level confidential. The size of this interval is arbitrary and matters only for presentation of the data in this figure. These intervals are not used in the econometric analysis in this memo. Return to text
10. To estimate these polynomials we restrict the sample to observations from banks with assets between $2 billion and $1,250 billion. However, the chart does not show observations from banks with assets above $350 billion to maintain the information on participation confidential. In fact, given that there are only five banks with assets above $350 billion, points in this chart above this value could reveal participation rates at the bank level. Return to text
11. Notice that φj and f ( ln( Aij) − ln(50 bi) ) would absorb the effects of EWFj and I( Aij ≥ 50bi ), respectively, in equation (1), thereby making EWFj and I( Aij ≥ 50bi ) redundant in this equation. Return to text
Please cite as:
Rezende, Marcelo, and Mary-Frances Styczynski (2015). "The Effects of Liquidity Regulation on Participation in the Term Deposit Facility," FEDS Notes. Washington: Board of Governors of the Federal Reserve System, June 19, 2015. https://doi.org/10.17016/2380-7172.1545
Disclaimer: FEDS Notes are articles in which Board economists offer their own views and present analysis on a range of topics in economics and finance. These articles are shorter and less technically oriented than FEDS Working Papers.
