
FEDS Notes
 Print
PrintDecember 29, 2015
Effects of the Ability to Repay and Qualified Mortgage Rules on the Mortgage Market
Neil Bhutta and Daniel Ringo
Following the recent housing and financial crisis, Congress passed one of the most comprehensive financial reform laws in U.S. history, the Dodd-Frank Wall Street Reform and Consumer Protection Act of 2010. One key part of Dodd-Frank -- the ability-to-repay (ATR) provision -- aims to discourage risky mortgage lending practices that proliferated during the housing boom. On January 10, 2014, the recently formed Consumer Financial Protection Bureau's (CFPB) rules implementing the ATR provision went into effect. For the first time, Federal law requires lenders to consider certain underwriting criteria and make a good-faith determination that borrowers will have the ability to repay their home loans. As the new ATR requirement represents a shift toward more prescriptive regulation in the residential mortgage market, it is important to understand how the rules are affecting risk taking and credit availability.
In this note, we use recently released loan level data collected under the Home Mortgage Disclosure Act (HMDA) to examine how the new rules may have affected mortgage lending activity in 2014. In an article published simultaneously with the 2014 HMDA data release, we examined broad lending patterns and found little indication that the new rules had a significant effect on lending in 2014 (Bhutta, Popper and Ringo (2015)). This note extends that analysis by conducting sharper tests around the date of enactment, and around lender-size and loan-pricing thresholds, where treatment of loans under the new rules varies. We find evidence that some market outcomes were affected by the new rules, but the estimated magnitudes of the responses are small. Later, we discuss why the rules would not necessarily have had a major effect in 2014, and why they could be more binding in the future.
The Ability to Repay and Qualified Mortgages Rules
The new ATR rules require lenders to consider and verify a number of different underwriting factors, such as a mortgage applicant's assets or income, debt load, and credit history, and make a reasonable determination that a borrower will be able to pay back the loan. (Thus, these verification requirements prohibit so-called "no-doc" loans, where borrowers' income and assets are not verified.) Borrowers may allege a violation of the ATR requirement within three years of the date of violation. They may also use a violation of the ATR requirement as a defense against foreclosure for the life of the loan. Lenders that are found to violate the ATR rules can be liable for monetary damages.
Lenders are presumed to comply with the ATR requirement when they make a Qualified Mortgage (QM) loan, which must meet further underwriting and pricing standards. These requirements generally include a limit on points and fees to 3 percent of the loan amount, along with various restrictions on loan terms and features (for example, no negative amortization or interest-only payments and a loan term of 30 years or less).1 QM loans also generally require that the borrower's total or "back-end" debt-to-income (DTI) ratio does not exceed 43 percent. However, the 43 percent DTI cap does not currently apply to loans with government-backed insurance or guarantees (e.g. Federal Housing Administration (FHA) and Veterans Administration (VA) loans), loans that are eligible for purchase by the Government Sponsored Enterprises (GSEs, i.e. Fannie Mae and Freddie Mac), and portfolio loans made by "small creditors."
Two levels of legal protection against borrowers' allegations of ATR violations are associated with QM loans. First, all QM loans are granted a rebuttable presumption of compliance with the ATR rules. Second, a stronger, conclusive presumption of compliance (known as a "safe harbor") is given to QM loans that are not "higher priced". Lenders may feel more secure in their legal standing with a safe harbor loan than one granted only a rebuttable presumption.
In this note we focus on three thresholds written into the ATR and QM rules around which legal treatment of loans changes. First, treatment depends on the loan application date. Lenders are subject to ATR and QM rules for any relevant loan application received on or after January 10, 2014, while applications received beforehand are exempt from the rules. Second, treatment depends on lender size. Small creditors, for loans held in portfolio, are not subject to the 43% DTI cap for QM loans and have an elevated price threshold for safe harbor loans. For QM purposes, lending institutions that originated fewer than 500 first-lien, closed-end residential mortgages of a type subject to the ATR requirements in the previous year (i.e. 2013) and whose prior year total assets were less than $2 billion are considered small creditors. Third, as noted earlier, safe harbor protections depend on the pricing of the loan. Most QM loans achieve safe-harbor status if the spread between the APR of the loan and the average prime offer rate (APOR) does not exceed 150 basis points (that is, 1.5 percentage points). 2 For QM loans originated by small creditors, loans up to 350 basis points above APOR that are held in portfolio get safe harbor status.
Data
HMDA requires most mortgage lending institutions with offices in metropolitan areas to disclose to the public detailed information about their home-lending activity each year. The HMDA data include the disposition of each application for mortgage credit; the type, purpose, and size of each loan; the census-tract location of the properties securing the loan; loan pricing information; demographic information about loan applicants, including race, ethnicity and income; and information about whether the loan was sold.
The HMDA data have several unique features that allow us to test for effects of the ATR and QM rules. First, the confidential version of the data that we use in this note includes the date of each application, which to our knowledge is unavailable in any other source of mortgage data. Second, the spread between APR and APOR is reported on loans for which the spread is at least 150 basis points. This spread mirrors the one used to determine if a loan is higher-priced for QM purposes. Third, HMDA data disclose the lender for each mortgage, allowing us to identify lenders that qualify as small creditors. Finally, the HMDA data is broadly representative of the mortgage market, including near universal coverage in metropolitan areas.
Tests
In our first set of tests, we investigate how lenders may have responded to the rules using a regression discontinuity (RD) strategy, comparing the outcomes of loan applications just before and just after the January 10 threshold.3 Intuitively, in the absence of the rule change, we would not expect any sharp changes in lending patterns on January 10. 4 Thus, if we observe any discontinuities in lending behavior on January 10, we can attribute them to the effect of the rules.
In figures 1 and 2, we show January 10 RD tests for refinance and home purchase loans for three outcome variables:
- Higher-priced share: The fraction of all mortgage originations with an APR 150 basis points or more above APOR, that were not backed by government guarantees from the FHA, VA, FSA or RHS. The prospect of gaining safe harbor status might have induced lenders to price more loans below the higher-priced threshold. Alternatively, lenders could also have become more likely to deny riskier applications which would have been originated as a higher-priced loan in the absence of the ATR and QM rules.
- High DTI share: The fraction of mortgage originations with a "front-end" DTI ratio which we calculate to be in excess of 28 percent. Our calculated DTI ratios are only approximate, and do not include the non-mortgage debt payments used to determine a borrower's back-end DTI ratio for QM purposes.5 That said, borrowers with a high front-end DTI ratio may be more likely to have a back-end DTI ratio in excess of 43 percent; if the rules discourage non-QM lending we may see fewer high front-end DTI ratio loans.
- Denial rate: The fraction of mortgage applications that the lender did not approve. If the rules discourage lenders from originating non-QM, non-safe harbor, or generally riskier loans, more applications may get denied.6
| Figure 1 |
|---|
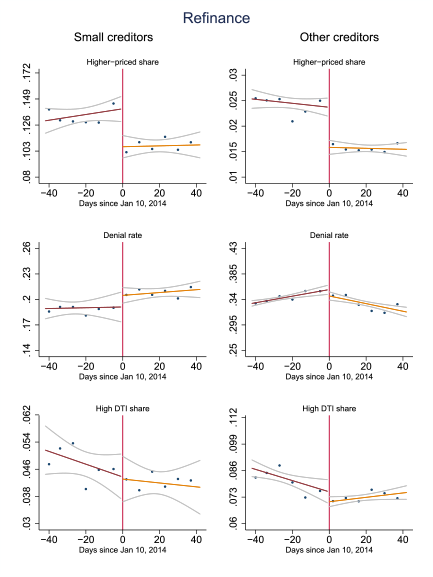 |
Notes: Each data point represents weekly averages based on loan application date relative to January 10, 2014; lines of best fit and 95% confidence intervals are shown on either side of the date threshold. Charts on left show results for small creditors, which are depository institutions with less than $2 billion in assets and fewer than 500 originations in 2013; charts on right show results for all other lenders. Higher-priced loans are those with an APR at least 1.5 percentage points over prime; high DTI loans are those with an estimated front-end DTI over 28%.
| Figure 2 |
|---|
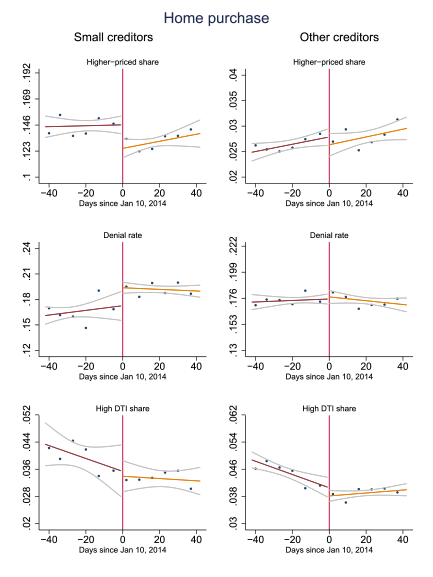 |
Notes: Each data point represents weekly averages based on loan application date relative to January 10, 2014; lines of best fit and 95% confidence intervals are shown on either side of the date threshold. Charts on left show results for small creditors, which are depository institutions with less than $2 billion in assets and fewer than 500 originations in 2013; charts on right show results for all other lenders. Higher-priced loans are those with an APR at least 1.5 percentage points over prime; high DTI loans are those with an estimated front-end DTI over 28%.
The left-hand column presents results for small creditors and the right-hand column presents results for all other creditors, which includes all non-depository lenders, and depository institutions (banks, thrifts and credit unions) with over $2 billion in assets or over 500 originations.7 Each point represents one week of data. We overlay an estimated line of best fit on each side of the cutoff as well as the 95 percent confidence intervals.
Comparing the fitted lines on either side of the January 10 threshold in the top two panels, the higher-priced share of refinance loans drops statistically significantly at January 10 for both types of lenders, with a larger decline in absolute terms for small creditors (who tend to be much more likely to originate higher-priced loans). For home purchase loans, the higher-priced share dropped for small creditors, but not for all other creditors.8
As shown in the bottom-left panel of figures 1 and 2, small creditors may also have increased their denial rates for both home purchase and refinance loans after January 10, although statistical significance is marginal. Other creditors show no evidence of increasing their denial rates across loan types.9 Finally, in no case do we see a discontinuity in the rate of high DTI ratio loans (middle panels).
While lenders appear to have reacted to the ATR and QM rules at least along the pricing dimension, the economic significance of the response is minor. Among non-small creditors, the higher priced share of refinance loans fell by less than 1 percentage point and there was no discernable drop in the higher priced share of home purchase loans. Although the effects were larger at small creditors, these lenders accounted for only 7 percent of the market.
As a further investigation of lenders' interest in safe harbor status, we run another test for a discontinuity in the volume of loans priced just above and below the safe-harbor price threshold for small creditors.10 Figure 3 displays the results. The sample consists of all home purchase and refinance loans originated by small creditors. The panel on the left shows loans originated in 2014 with an application date on or after January 10, while the panel on the right shows loans originated in 2013 (i.e. before the rules went into effect). The volume of lending clearly drops at 350 basis points above APOR in 2014, but no such discontinuity appears in 2013. This finding provides strong evidence that some small creditors were sensitive to the elevated "safe-harbor" threshold for portfolio loans.
| Figure 3 |
|---|
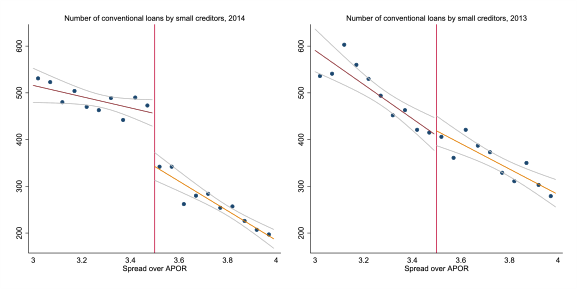 |
Notes: Each data point shows the number of originations within bins of 5 basis points. For the 2014 graph, loans are restricted to those with application dates on or after January 10. Lines of best and 95% confidence intervals are shown on either side of the 350 basis point threshold.
In our final set of tests we compare the lending trends of small creditors with those of banks marginally above the size thresholds, estimating the effect of small creditor status under the ATR and QM rules using a difference-in-differences strategy. Specifically, we regress outcome y of loan application i at lender b in county c and year t on the interaction of two indicator variables -- one for the year 2014, and one for lenders that qualify as small when the rules went into effect -- while controlling for lender fixed effects, which accounts for time invariant differences across lenders, and county-by-year fixed effects to account for potentially confounding changes in local economic conditions:
The sample is restricted to depository institutions which, in 2013, had assets less than $5 billion and reported fewer than 1000 originations. The estimation sample includes data from 2012, 2013 and 2014. Results are presented in table 1.
| Table 1: Difference-in-differences Estimates of the Effect of the Ability to Repay Rules: Small Creditors versus Larger Creditors |
|---|
| Conventional higher-priced share of originations | Conventional high-DTI share of originations | Denial rate | |
|---|---|---|---|
| Small creditor*2014 | -0.0002 | -0.0002 | -0.0061 |
| (0.0045) | -0.0016 | (0.0038) | |
| Adjusted R-square | 0.3471 | 0.0648 | 0.2316 |
| N | 619,690 | 612,646 | 832,916 |
Notes: All regressions include lender fixed effects and county-by-year fixed effects, using mortgage origination and application data from 2012, 2013, and 2014 with application dates after January 10 in each year. Data are restricted to depository institutions reporting HMDA data in all 3 years that had assets of less than $5 billion at the end of 2013 and reported fewer than 1,000 originations in 2013. Small creditors are those with less than $2 billion in assets at the end of 2013 and fewer than 500 originations in 2013. Standard errors, clustered at state level, in parentheses.
* p < .05
** p < .01
Despite the less stringent rules for small creditors, these tests do not indicate that small creditors responded differently to the rules than their somewhat larger counterparts. None of the estimated effects on higher-priced share, high DTI share, or denial rates was economically or statistically significant. Notably, the CFPB recently proposed to expand the definition of "small creditor" in order to help increase access to credit. However, the results here provide little indication that such an expansion would lead to a material increase in credit availability.
The final ATR and QM rules were published on January 10, 2013, giving lenders a full year to prepare any intended changes to their underwriting standards. They may have had difficulty, however, implementing all such changes precisely on the date the rules went into effect. If there was a more gradual response to the rules, with some effects occurring either before or well after January 10, 2014, the RD estimates around the cutoff date may underestimate how much ATR and QM affected lending. The difference-in-differences approach is more robust to this issue, however, and it yields no evidence of a meaningful response to the rules. Furthermore, RD tests around the 500 loan threshold for small creditor status (not shown) provide no evidence of an effect on any of the previously mentioned outcomes, despite the fact that these tests are similarly robust to a gradual response.11
Discussion
We provide evidence in this note that lenders responded to the ATR and QM rules, particularly by favoring loans priced to obtain safe harbor protections. However, the estimated magnitudes indicate the rules did not materially affect the mortgage market in 2014. This should not be taken, however, as definitive proof that no other changes occurred in response to the rules. The HMDA data lack information that would be necessary for a more comprehensive review of the mortgage market. For example, we cannot directly test if lenders became more reluctant to originate loans above the 43% DTI threshold, because all the data necessary to calculate back-end DTI are not reported in HMDA. The HMDA data also lack information on points and fees, which are limited by rule for QM loans.
Another caveat is that even if the ATR and QM rules did not have a large effect on lending in 2014, they may become more binding in the future for two reasons. First, the QM "patch" which exempts GSE-eligible, FHA and VA loans from the DTI maximum is set to expire in 2021 (or, for the GSEs, when they exit conservatorship if that occurs first). Second, the ATR and QM rules took effect during a period of relatively tight credit, and may restrict practices that lenders were not engaging in regardless (e.g. no-doc lending). If credit conditions ease in the future and the market regains its appetite for risk, the rules may gain more bite.
Works Cited
Alexandrov, Alexei. 2015. "Making Firms Liable for Consumers' Mistaken Beliefs: Theoretical Models and Empirical Applications to the U.S. Mortgage and Credit Card Markets." Available at SSRN 2599424
Bhutta, Neil, Jack Popper, and Daniel Ringo. 2015. "The 2015 Home Mortgage Disclosure Act Data." Federal Reserve Bulletin, 101(September).
Imbens, Guido W, and Thomas Lemieux. 2008. "Regression Discontinuity Designs: A
Guide to Practice." Journal of Econometrics, 142(2): 615-635.
1. For information on how the terms "points and fees" and "loan amount" are defined for the purposes of QMs and other guidance on the rules, see Consumer Financial Protection Bureau (2014), Ability-to-Repay and Qualified Mortgage Rule: Small Entity Compliance Guide (Washington: CFPB, November 3), http://files.consumerfinance.gov/f/201411_cfpb_atr-qm_small-entity-compliance-guide.pdf. Return to text
2. See Freddie Mac, "Mortgage Rates Survey," webpage, www.freddiemac.com/pmms; and Federal Financial Institutions Examination Council, "FFIEC Rate Spread Calculator," webpage, www.ffiec.gov/ratespread/newcalc.aspx. Return to text
3. We use mortgage application data within a 12-week window around January 10, 2014, during which time about 684,000 first-lien, owner-occupied home purchase applications were submitted and about 677,000 first-lien, owner-occupied refinance applications were submitted. We exclude applications where no credit decision was made, and applications likely to have been submitted by a business. Return to text
4. A more involved discussion of the general RD strategy is available in Imbens and Lemieux (2008). Return to text
5. Details on how approximate front end DTI ratios were calculated are available in Bhutta, Popper and Ringo (2015). An approximate front end DTI ratio of 28 percent was the 90th percentile in the 2014 data. Return to text
6. In general, changes over time in denial rates can be difficult to interpret due to variation in applications from riskier applicants in response to changes in lending standards. The assumption we make here is that consumers are unlikely to have been aware of the rule changes and thus unlikely to have responded abruptly on January 10 in their application decisions. However, it is possible that lenders may have steered certain borrowers toward applying prior to January 10. Return to text
7. Although many non-depositories may fall below the small creditor asset and loan volume thresholds, it would be difficult for these institutions to take advantage of the relaxed QM and safe harbor standards because they generally hold few, if any, loans in portfolio. Return to text
8. Although small creditors can still obtain safe harbor status for loans with an APR spread above 150 basis points (but lower than 350 basis points), they may still be sensitive to the 150 basis point threshold because of the additional requirement that the loan must be held in portfolio for at least 3 years to obtain safe harbor status. That said, the drop in higher-priced lending for small creditors at January 10 may also reflect a decline in loans with APR spreads of 350 basis points or more; as we discuss later, we provide evidence of a sharp decline in lending at this threshold in Figure 3. Return to text
9. We also tested for a discontinuity in loan volume at January 10, but the estimates were noisy and inconclusive. In a placebo test, no discontinuities were apparent in any outcome variable at January 10, 2013. Return to text
10. The HMDA data includes spread over APOR only for loans priced 150 basis points or more above APOR, so we cannot test for discontinuities in lending by other creditors. Return to text
11. Alexandrov (2015) runs a similar set of tests for discontinuities in lending volume around the 500 loan threshold and finds no evidence of an effect. Return to text
Please cite as:
Bhutta, Neil, and Daniel R. Ringo (2015). "Effects of the Ability to Repay and Qualified Mortgage Rules on the Mortgage Market," FEDS Notes. Washington: Board of Governors of the Federal Reserve System, December 29, 2015. https://doi.org/10.17016/2380-7172.1680
Disclaimer: FEDS Notes are articles in which Board economists offer their own views and present analysis on a range of topics in economics and finance. These articles are shorter and less technically oriented than FEDS Working Papers.
