
FEDS Notes
 Print
PrintMay 1, 2015
Forecasts of Economic Activity in the Great Recession
Claudia Sahm
Forecasts by the Board staff for economic activity during the Great Recession proved to be overly optimistic on some dimensions, such as GDP, and yet were appropriately pessimistic on other dimensions, such as the GDP gap (the deviation of GDP from potential output).1 This look back on forecasting draws on the newly-released staff forecasts from 2009, as well as Board staff forecasts from 2008.2
The Board staff prepares a multi-year forecast before each FOMC meeting and Figure 1, from left to right, shows the staff forecasts prepared in June 2008, December 2008, June 2009, and December 2009. The solid bars show the change in real GDP for 2008 (blue), 2009 (orange), and 2010 (green) at the time of each staff forecast. The dashed lines show the current estimates for those three years, according to the Bureau of Economic Analysis (BEA).
| Figure 1 |
|---|
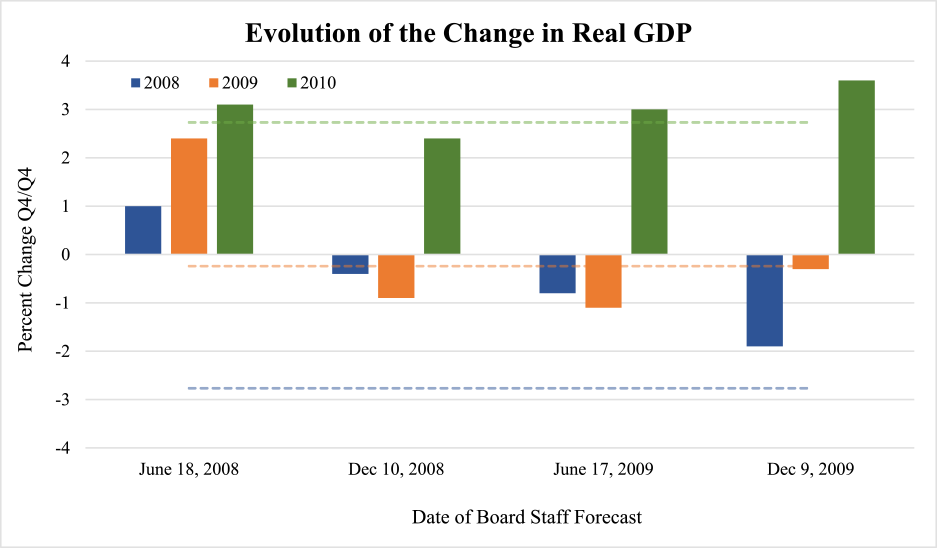 |
Note: Percent changes are from the fourth quarter of the previous year to the fourth quarter of the year indicated. The solid bars combine the GDP estimates from the Bureau of Economic Analysis (BEA) that were available at the date of the forecast with the Board staff forecasts going forward from the published data. The dashed lines are the currently published estimates of GDP from the BEA. The colors of the lines (current) and bars (real-time) match for a particular year.
In the June 2008 forecast--with about a half-year of spending data in hand--the Board staff expected real GDP to increase 1 percent in 2008 (far-left blue bar), 2-1/2 percent in 2009 (far-left orange bar) and 3 percent in 2010 (far-left green bar). Six months later in the December 2008 forecast, well into the financial crisis, the staff views on 2008 (middle-left blue bar) and 2009 (middle-left orange bar) had weakened noticeably. Nevertheless, the decline of 1/2 percent in real GDP for 2008--much of which reflected published spending data--in that forecast was far more optimistic than the current estimate of a 2-3/4 percent decline for 2008 (the dashed blue line). Note, that even in the December 2009 forecast (far-right blue bar), the decline in real GDP in 2008--based on the BEA's first annual revision for that year--was, at 2 percent, still a 3/4 percentage point smaller decline than the current estimate. It was only later that the BEA revised GDP down further to its current estimate. In other words, the staff's overly optimistic forecasts of the recession in figure 1 partly reflect the lags in constructing national statistics, particularly during a business cycle downturn.
And yet, monetary policy with its dual mandate of maximum employment and price stability is unlikely to react directly to GDP growth. Instead, the deviation of GDP from potential output, referred to as the GDP gap, is typically more relevant to monetary policy since it reflects the cyclical position of the economy.3 In fact, standard tools, such as the Taylor rule, for estimating the appropriate level of the federal funds rate depend on cyclical indicators like the GDP gap. Given its usefulness for monetary policy, the GDP gap is a key variable in the Board staff forecast. Figure 2 shows the evolution of the GDP gap in the staff forecasts during the Great Recession.4
| Figure 2 |
|---|
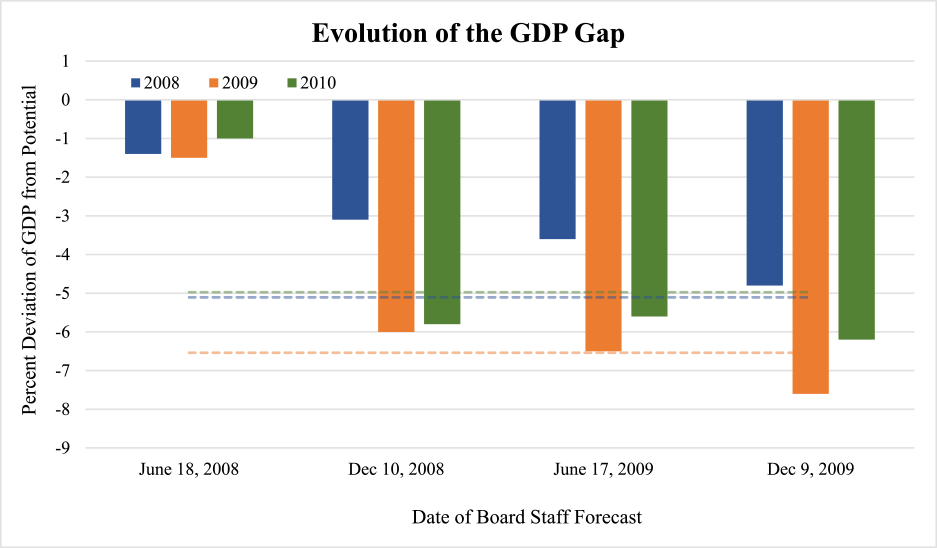 |
Note: The GDP gaps are percent deviations of the level GDP from the level of potential GDP in the fourth quarter of each year. The solid bars are the GDP gaps at the time using the Board staff's GDP and potential GDP. The dashed lines are the GDP gaps using current estimates of GDP from the Bureau of Economic Analysis (BEA) and potential GDP from the Congressional Budget Office (CBO). The colors of the lines (current) and bars (real-time) match for a particular year.
Similar to the forecasts of GDP, the staff's view of the GDP gap worsened noticeably in the December 2008 forecast (the middle-left grouping).5 In that forecast, the Board staff expected that real GDP at the end of 2008 would be 3 percent below potential GDP. This was optimistic relative to the current assessment (using CBO's estimate of potential) that GDP at the end of 2008 was 5 percent below potential.6 However, the forecasts provided by the Board staff in December 2008 for the GDP gap at the end of 2009 and 2010 were much closer to the current assessment. Moreover, in the June 2009 and December 2009 forecasts, the GDP gap for the end of 2010 was decidedly negative and comparable to current assessments. Taken together, since late 2008, the Board staff forecast sent a persistently negative message about the cyclical position of the economy in these years a message that also seems appropriate given current knowledge.7
This note on GDP growth and the GDP gap has only scratched the surface on the forecast evaluation and there is room for improvement even where the Board staff forecasts were fairly accurate. There are a few takeaways for other such exercises: First, the quality of the information available at the time of the forecast may be an impediment, above and beyond the forecaster's ability to interpret the available information. Second, depending on how the forecasts are used some variables may receive more weight--and thus deserve closer scrutiny--than others. As the saying goes, "all forecasts are wrong, but some are useful." In the end, the staff forecast of economic activity during the Great Recession should be judged by how useful it was to the conduct of monetary policy at the time.
1. Potential output here is the level of output that we would expect to see if prices were able to fully adjust. If the actual level of output is below potential output then we say there is slack in the economy. Unlike actual output, potential output is not directly measured and must be indirectly estimated. For a primer on potential output and its measurement see Basu and Fernald (2009) (PDF). Return to text
2. The Board staff projections are available at (2009): http://www.federalreserve.gov/monetarypolicy/fomchistorical2009.htm and (2008): http://www.federalreserve.gov/monetarypolicy/fomchistorical2008.htm. Staff forecasts are released with a five-year lag along with the transcripts of FOMC meetings, the FOMC forecasts (the SEP), and other policy materials. Return to text
3. See the recent speech, "Normalizing Monetary Policy: Prospects and Perspectives" by Chair Yellen and the references therein for more on the role of cyclical measures, like the output gap, in monetary policy. Return to text
4. The GDP gaps depicted in the bars are the percent deviation between the Board staff's forecast for GDP and the staff's forecast for potential output at the time. The dashed lines show current estimates of the GDP gaps in the Great Recession, specifically the percent deviation between GDP as now published by the BEA and the Congressional Budget Office's (CBO) estimate of potential output. The CBO estimate of potential GDP is from Table 26 at http://www.cbo.gov/sites/default/files/cbofiles/attachments/45066-2015-01-EconomicDataProjections2.xlsx. Note, the Board staff's current estimates of potential at that time are not publicly available but the methodologies are similar. Return to text
5. The fact that Board staff views about the output gap (one measure of the cyclical position of the economy) worsened more than GDP reflects a signal taken from the sharp increase in the unemployment rate, even as the published spending data at the time showed less weakness. Return to text
6. Unlike the estimates of potential output in 2008 and 2009, the Board staff's current estimate of potential output--which may have revised--is not publicly available. For the current estimates of the output gap this note uses the GDP from the BEA and potential output from the CBO. Return to text
7. Another way to gauge the message from the staff at the time is with staff documents that presented the forecast, the Greenbook, or transcripts of the FOMC meetings. As one example, at the December 2008 FOMC meeting (PDF), the staff forecast was described as having a "very substantial output gap" (p. 124). See also a staff presentation at the June 2009 FOMC meeting (PDF) on various measures of resource utilization, including the GDP gap (p.103-105). For a longer perspective, see "Real-Time Properties of the Federal Reserve's Output Gap" by Rochelle Edge and Jeremy Rudd (2012). Return to text
Please cite as:
Sahm, Claudia R. (2015). "Forecasts of Economic Activity in the Great Recession," FEDS Notes. Washington: Board of Governors of the Federal Reserve System, May 01, 2015. https://doi.org/10.17016/2380-7172.1518
Disclaimer: FEDS Notes are articles in which Board economists offer their own views and present analysis on a range of topics in economics and finance. These articles are shorter and less technically oriented than FEDS Working Papers.
