
FEDS Notes
 Print
PrintFebruary 2, 2015
How Does Student Loan Debt Affect Light Vehicle Purchases?
Christopher Kurz and Geng Li
Light vehicle sales plummeted during the recent financial crisis and the ensuing recession.1 However, since the first quarter of 2009, sales of automobiles and light trucks have rebounded, spurring production and investment, as a result, gains in employment. Looking ahead, a sustained robust level of vehicle sales will likely provide an important signal of, and be a direct contributor to, a broader economic recovery. Among many factors that affect vehicle sales, recent research has shown that household indebtedness helps explain the drop and subsequent recovery in vehicle sales.2 Moreover, against the backdrop of rapidly growing student loan balances, the potential effect on household spending of a heightened burden of student debt has received increased attention from analysts and in the press. For example, analyzing the Consumer Credit Panel FRBNY/Equifax (CCP) data, Brown and Caldwell (2013) find evidence that suggests that the marked rise in student loan burdens in recent years may be weighing on debt-funded vehicle purchases.
The CCP data, while providing timely information on borrowing for a large sample of Americans, have certain limitations that stand in the way of making a direct and comprehensive inference about student debt and auto purchases. First, only debt-funded auto purchases, which account for about half of all auto purchases in U.S., can be inferred from the CCP data. Second, purchases of new and used vehicles cannot be separated in the CCP data, a distinction that matters when measuring economic activity. Third, except a borrower's age, the CCP data do not contain any demographic and socioeconomic characteristics of the consumers and their households, which are known to be important determinants of auto purchases. Our study relies on another data source, the Consumer Expenditure Survey (CE), to explore the relationship of household debt (student loans in particular) and consumer expenditures. Specifically, we will introduce the unique features of the CE data, discuss the quality of household balance-sheet related data therein, and explore the impact of student loan indebtedness on a household's decision to finance the purchase of a vehicle and whether the vehicle is new or used.
I. The Consumer Expenditure Survey
The Consumer Expenditure Survey is the only regular U.S. household survey that collects detailed information on household demographic and socioeconomic characteristics, consumption expenditures, and balance sheets. The survey covers a large nationwide representative sample: about 7,000 households have been surveyed each quarter in recent years. Each sampled household is surveyed four times a year before being replaced. Johnson and Li (2009) provide a detailed description of the household debt information that the CE collects and find that these data compare favorably with their counterparts in the Survey of Consumer Finances (SCF), which is widely viewed as the best available data source of U.S. household balance sheets (but contains very limited expenditure data). Johnson and Li (2010, forthcoming) further demonstrate that both the debt service-to-income ratios calculated using the CE data and the mortgage-type information CE collects have significant informational merit for understanding consumers' liquidity conditions. Our analysis below uses data for households in the CE sample who participated in all four quarterly interviews, who were headed by a person between 20 and 65 years old, and whose annual household before tax-income was between $3,000 and $300,000.
a. Student loan information in the CE
Prior to the release of 2013 CE (the latest release), student loan balance information was lumped together with several other types of household credit, such as personal loans and pension plan loans. However, the SCF data, which have detailed information on each of such loans, reveal that the vast majority of the combined balances of these household debts likely represent student loans.3 Therefore, we use the combined loan balances as an approximation of student loan balances. Since the second quarter of 2013, student loan debt balances and services have been reported separately in the CE. Our analysis focuses on how a household's student loan indebtedness at the time of their first survey period is related to that household's vehicle purchases during the subsequent four-quarter interval.
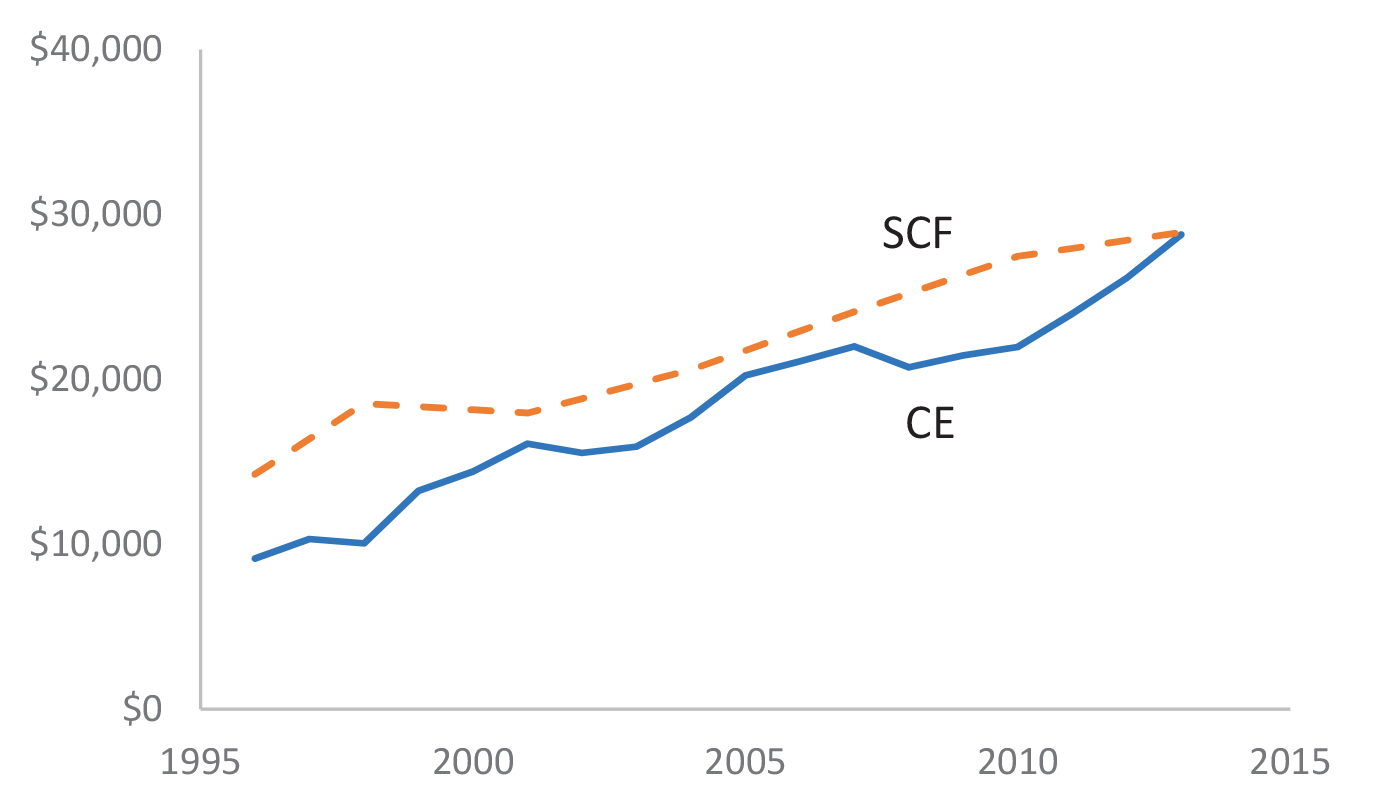
Figure 1 contrasts the share of households with positive student loan balances estimated using the CE data with that in the SCF data from 1996 to 2013.4 We find that the CE-series underestimate the prevalence of student loan borrowing relative to the SCF-series by a significant margin. However, the two series share a very similar trend, both showing a sizable increase (of a similar magnitude) in the share of households with some outstanding student debt. Furthermore, as shown in Figure 2, the average balances of student loan debt among the borrowers are remarkably close in the two surveys, in terms of both the level and the trend over time.
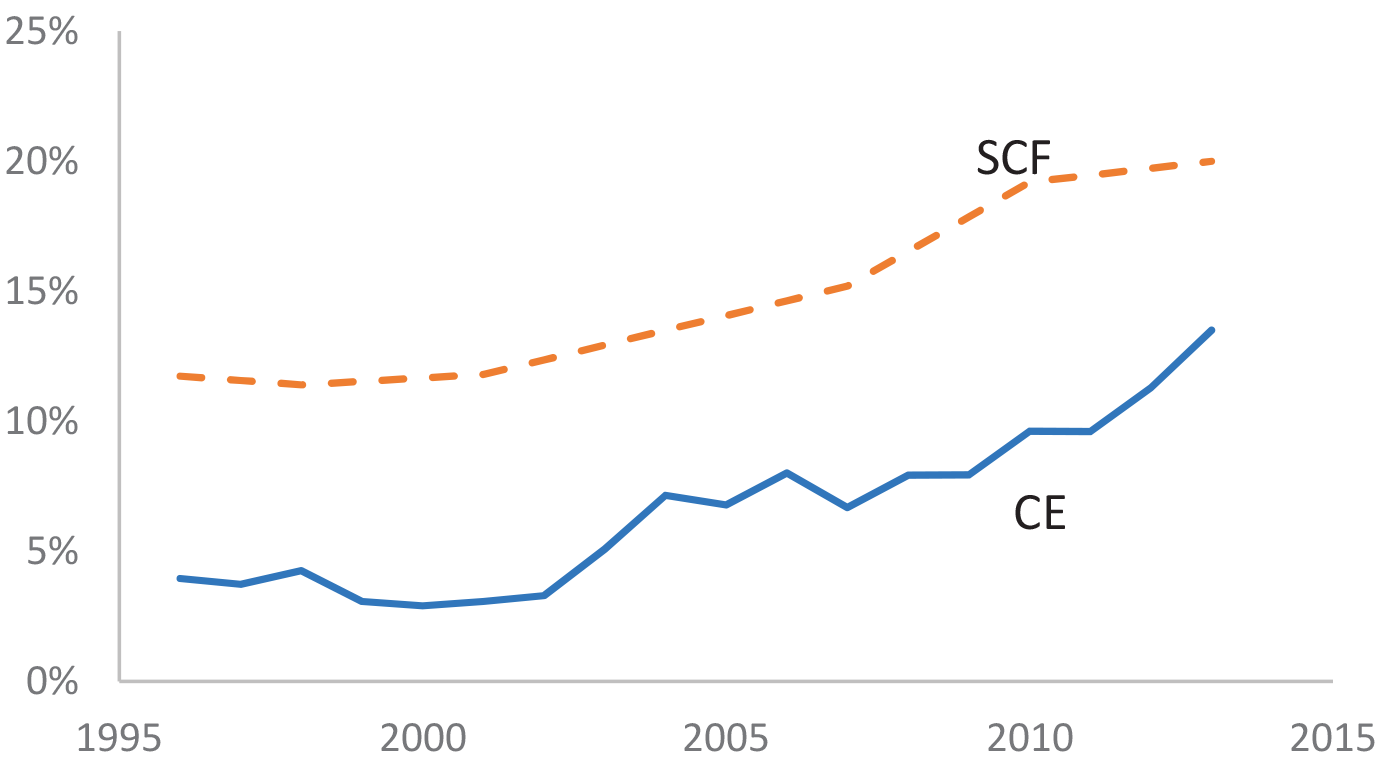
In addition, both the CE and SCF data show that many households across the age spectrum owe student debt. Accordingly, our analysis will examine the effect of such debt on auto purchases among all consumers aged between 20 and 65, instead of focusing on only the young borrowers.
b. Light vehicle purchases data in the CE
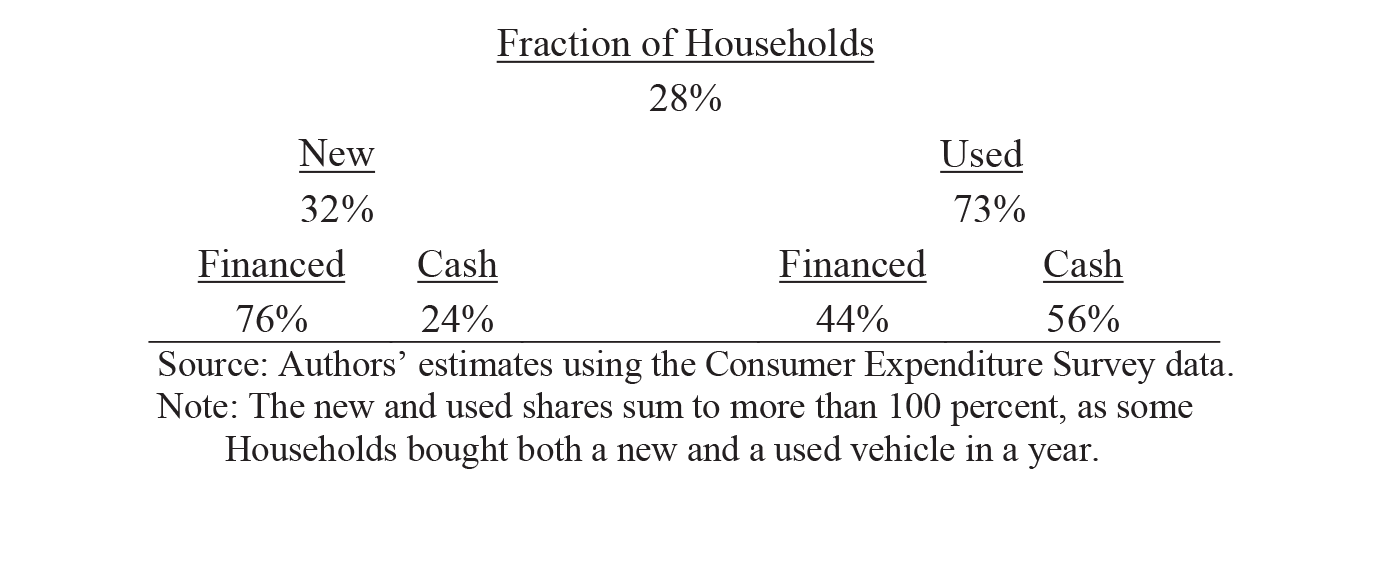
The CE records detailed information on the household vehicle inventory, and, important for our analysis, allows us to identify whether a vehicle purchased while the household was in the survey was used or new, and whether there was a loan involved in the purchase. Table 1 summarizes the share of households buying a vehicle in a given year, the split of new versus used, and whether the purchase was financed. As the table indicates, over the period of 19962013, about 28 percent of households in our CE sample purchased an auto or a light truck in a given year, split about one-third, two-thirds between new and used vehicles. In addition, more than three-quarters of the new purchases were financed by a loan, whereas only about 45 percent of used purchases were debt-financed.5
II. The Effect of Student Loan Debt on Vehicle Purchases
We begin with a simple logistic regression where an indicator variable for whether the household purchased a vehicle is regressed on measures of household indebtedness--the amount of debt owed relative to the household's income--and a vector of demographic and socioeconomic characteristics. Our variables of indebtedness are measured as of the beginning of the panel, representing pre-determined balance-sheet conditions with respect to subsequent auto purchases. Specifically, our measures include the total "other" debt balance-to-income ratio and the student loan debt balance-to-income ratio, which are calculated, respectively, as the ratio of the level of debt and to household pre-tax income. The "other" debt measure excludes student loans and is the sum of mortgage, home equity, auto, and credit card debt outstanding. Importantly, separating student loan borrowing from total indebtedness will address whether or not student loans impart a differential effect upon consumer expenditures as opposed to overall indebtedness. To allow for nonlinear effects of indebtedness on auto purchases, we also include, for each of the two ratios, a high-debt-to-income indicator that is set to equal to 1 if the ratio is greater than the 90th percentile of its distribution across households and zero otherwise. The control variables include age, race, education, employment, marital status, the number of children, the log of income, homeownership, and a dummy for being a student. To proxy for expected earnings we include an interacted term of the age and education controls. The logistic model specification also controls for the student and work status for a spouse (if present) as well. Calendar-year fixed effects are also included in the regression.
The debt-related variables of interest from the simple logistic regression are reported in column 1 of Table 2. For each variable, we report the estimated coefficient, standard error, and its associated odds ratio, which is the estimated coefficient-implied probability of purchasing a vehicle divided by the probability of not purchasing.6 The results indicate that, on average, the total other debt-to-income ratio does not have a significant effect on auto purchases except when it becomes particularly high: The households with particularly high levels of total other debt relative to their income are on average 15 percent less likely to purchase a vehicle in a given year. However, the likelihood of purchasing a vehicle increases with the amount of student loan debt owed by a household except for very high levels of student debt. Indeed, a 10 percent increase in student loan-to-income ratio increases the likelihood of auto purchases by 4 percent for the average indebted consumer even after controlling for an individual's current income, educational attainment, and our age-education proxy for expected earnings. That said, the regression shows that having very high levels of student loan debt, as defined by being above the 90th percentile of student-loan to income indebtedness, is associated with a significantly lower probability of purchasing a vehicle (45 percent lower). Taken altogether, while the average consumer's student loan debt-to-income ratio is positively related to auto purchases, those highly indebted of student loans are significantly less likely to purchase a new or used vehicle.7
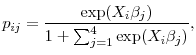
As shown earlier, a consumer may buy a used or a new vehicle, and may make the purchase with or without financing. The effects of household indebtedness on auto and light truck purchases may differ by the underlying vehicle and financing choices. To address this possibility, we employ a multinomial logistic (MNL) framework, an extension of the binary logistic regression that allows for more than two categories of the dependent or outcome variable. The five outcomes are modeled as {not purchasing an auto, purchasing a used auto with cash, purchasing a used auto with financing, purchasing a new auto with cash, purchasing a new auto with financing} and are denoted respectively alternatives j∈{0, 1, 2, 3, 4}. The probability of the mode, j, of purchasing a vehicle for household i is modeled as:
 |
The estimated coefficients, standard errors, and the associated odds ratios are reported in columns 2 through 5 in Table 2. The odds ratios are calculated relative to the outcome of not purchasing a vehicle. Several of the estimated coefficients of the MNL model have a different sign than those of the binary logistic regression, underscoring that indebtedness indeed affects vehicle purchases differently depending on vehicle and financing choices.
| Table 2: Logit Coefficient Estimates of Vehicle Purchase Choice |
|---|
| Logit | Multinomial Logit | ||||
|---|---|---|---|---|---|
| (1) | (2) | (3) | (4) | (5) | |
| Used - cash | Used - financed | New - cash | New - financed | ||
| Total Debt to Income | 0.00 | -0.01 | 0.01 | -0.02 | 0.01 |
| Standard Error | (0.00) | (0.00) | (0.00) | (0.00) | (0.00) |
| Odds Ratio | 1.00 | 0.99 | 1.01 | 0.98 | 1.01 |
| High Total Debt | -0.17 | -0.01 | -0.51 | 0.58 | -0.18 |
| Standard Error | (0.06) | (0.09) | (0.10) | (0.19) | (0.10) |
| Odds Ratio | 0.85 | 0.99 | 0.60 | 1.78 | 0.83 |
| Student Loan Debt to Income | 0.04 | 0.04 | 0.05 | -0.22 | 0.04 |
| Standard Error | (0.01) | (0.01) | (0.02) | (0.09) | (0.02) |
| Odds Ratio | 1.04 | 1.04 | 1.05 | 0.80 | 1.04 |
| High Student Loan Debt | -0.62 | -0.34 | -1.04 | -11.78 | -0.94 |
| Standard Error | (0.25) | (0.35) | (0.41) | (997.05) | (0.49) |
| Odds Ratio | 0.54 | 0.71 | 0.35 | 0.00 | 0.39 |
| N | 50,111 | ||||
Note: The specifications are run using data from 1996 to 2013. In addition to the above estimates, controls are included for age, race, education, employment, marital status, student status , children, income, and homeownership. The specification also controls for the student and work status for a spouse (if present). *,**,** represent significance at the 1, 5, and 10 percent, respectively.
Turning to the specific results, a higher total other debt-to-income ratio is associated with a lower probability of purchasing a vehicle--regardless whether it was a new or used one--with cash, but increases the probability of purchasing a vehicle when the purchase is financed. These results are broadly consistent with the notion that consumers with a higher total other debt-to-income ratio may have less cash available to finance a vehicle purchase or simply prefer debt-financing for other reasons. That said, households with a high debt-to-income ratio are significantly less likely to purchase a vehicle (new or used) with financing.8
We now turn our focus to the impact of student loans on vehicle purchases. First, aside from new cash-purchases, the student loan debt-to-income ratio has a positive and significant effect on purchases of motor vehicles. For example, for new purchases that are financed, a 10 percent increase in student loan indebtedness would increase the likelihood of a household purchasing an automobile by 4 percent in a given year (column 5). In the case of new cash-purchases, an admittedly small segment of overall sales, the negative coefficient on student loan debt mirrors that of total debt-to-income, indicating that consumers with higher debt outstanding tend to be more cash-constrained. Second, those with a student loan-to-income ratio at or above the 90th percentile have, on balance, a lower likelihood of buying a vehicle, and such effects are economically and statistically significant when the purchase was financed with a loan.9 , 10
To summarize, we use household-level data from the CE to shed new light on how student loan debt affects auto purchases. We find that the level of student loan a household owes indeed affects their choice of whether to buy a new or used vehicle and how to finance that purchase. On balance, apart from those with a very high level of student loan debt, consumers with a higher student loan-to-income ratio tend to have a higher likelihood of buying a vehicle, except when buying a new vehicle with cash. To be sure, while our results control for a rich set of household characteristics, they do not explicitly identify whether or not the higher likelihood of purchasing a vehicle results from an unobserved variable, or features specific to student loan debt. That said, the results are in contrast to the popular view that student loan debt may hinder vehicle purchases and indicates that more research is warranted in this area.
References
Brown and Caldwell (2013) "Young Student Loan Borrowers Retreat from Housing and Auto Markets," Liberty Street Economics, Federal Reserve Bank of New York, May, 2013.
Johnson, Kathleen W. and Geng Li. (2009) "Household Liability Data in the Consumer Expenditure Survey." Monthly Labor Review, vol. 132, no.12, 18-27.
Johnson, Kathleen W. and Geng Li (2010),"The Debt Payment to Income Ratio as an Indicator of Borrowing Constraints: Evidence from Two Household Surveys," Journal of Money, Credit, and Banking, vol. 42, no. 7, pp. 1373-90.
Johnson, Kathleen W. and Geng Li (forthcoming) "Are Adjustable-Rate Mortgage Borrowers Borrowing Constrained?" Real Estate Economics.
Johnson, Kathleen W., Karen Pence, and Daniel Vine (2014) "Auto Sales and Credit Supply," Finance and Economics Discussion Series 2014-82, Federal Reserve Board.
Mian, Atif, and Amir Sufi (2010) "Household Leverage and the Recession of 2007 to 2009," IMF Economic Review, May, 2010.
Mian, Atif, and Amir Sufi (2011) "Consumers and the Economy, Part II: Household Debt and the Weak U.S. Recovery," FRBSF Economic Letter, January, 2011
1. "Light vehicles" refer to automobiles and light trucks, hereafter referred to as "vehicles" or "autos" Return to text
2. For example, see Mian and Sufi (2010, 2011). Return to text
3. For example, the 2007 SCF data show that among the households that have a positive balance on either student loans, personal loans, or pension plan loans, 80 percent of them have a positive balance of student loans and the student loan balances account for 87 percent of total balances of such loans. Return to text
4. The SCF values for the years in which no survey was conducted are linearly interpolated. Return to text
5. The numbers for used and new vehicle financing are consistent with the findings of Johnson, Pence, and Vine (2014). Return to text
6. For the student loan and 'other' debt-to-income variables, the odds ratio is calculated for a 10 percent increase in the particular debt ratio. Return to text
7. Importantly, the results are robust to employing alternative measures of student loan indebtedness, such as the level of student loan debt or a categorical indicator of a positive student loan balance. Return to text
8. Interestingly, when total debt-to-income ratio is controlled for, the high total debt households appear to be more likely to buy a new vehicle with cash. Return to text
9. The effect of high student loan debt on new cash purchases is imprecisely estimated because too few high-student loan debtors bought a new vehicle with cash in our sample. Return to text
10. There is little difference in median pre-tax income and overall total indebtedness between new cash and new financing purchasers. That said, if new cash purchasers maintain a student loan balance, their median student loan to income ratio, at about 8 percent, is roughly 1/2 of the student loan to income ratio for households financing new auto purchases. Return to text
Please cite as:
Kurz, Christopher and Geng Li (2015). "How Does Student Loan Debt Affect Light Vehicle Purchases?" FEDS Notes. Washington: Board of Governors of the Federal Reserve System, February 02, 2015. https://doi.org/10.17016/2380-7172.1482
Disclaimer: FEDS Notes are articles in which Board economists offer their own views and present analysis on a range of topics in economics and finance. These articles are shorter and less technically oriented than FEDS Working Papers.
