
FEDS Notes
 Print
PrintAugust 26, 2015
Mass Population Displacement and Retail Activities in the Wake of Hurricane Katrina
Etienne Gagnon, David López-Salido
This week marks the 10th anniversary of Hurricane Katrina's tragic landfall near New Orleans, Louisiana, and the forced relocation of hundreds of thousands of families who lost their homes in the disaster. This mass population displacement boosted, for an extended period, population density and store frequentation in areas that were relatively spared by the storm. This note argues that supermarkets that weathered the hurricane raised prices little despite facing markedly higher store traffic and likely disruptions to their supply chains.
Hurricane Katrina is the most expensive natural disaster in U.S. history, having caused over $100 billion in property damage (in 2005 dollars). The hurricane was also responsible for the tragic direct loss of 1,200 lives and displacement of roughly 1 million persons.1 The city of New Orleans, Louisiana, sustained the most extensive damage due to the failure of its levee system. The flooding of residential areas forced the immediate evacuation of tens of thousands of households and made it impossible for most of them to return to their homes for several months or even years. According to research conducted at the U.S. Census Bureau and reported in Geaghan (2011), as of late 2009, 31,500 households in the New Orleans metropolitan area (7 percent of the area's total) still did not consider themselves permanently resettled even though more than four years had elapsed since the disaster.
About three quarters of displaced households in New Orleans found shelter with relatives and acquaintances, boosting population density in areas that were relatively spared by the storm. The sudden increase in population density also boosted store frequentation for establishments that had been spared by the storm. In this note, we investigate the extent of this increase in demand at surviving establishments and whether this increase was associated with price rises.
Tracking Retail Activities
We use weekly scanner data comprising price and quantity information on 29 personal care, housekeeping, and food products sold by supermarkets. The dataset, made available by Information Resources Inc. (IRI), covers 50 U.S. markets, including New Orleans' metropolitan area.2 The dataset's weekly frequency allows us to zoom in on the arrival of the storm, while its coverage of a large number of retailers ensures representativeness of the industry. Conveniently, the dataset covers all transactions within each product category; in conjunction with the price and quantity information, this comprehensive coverage allows us to compute price indexes and real quantity indexes (on a same-store basis) for supermarkets in New Orleans using a methodology similar to that employed for the national accounts.3
Katrina's Effect on Supermarket Activities
The storm left an important imprint on store participation in the IRI survey. Of the 22 New Orleans stores that reported data to IRI on the eve of the tragedy, five stores permanently exited the sample as soon as the storm hit, while another 5 stores temporarily ceased to report data for periods ranging from a couple weeks to eight months.
Figure 1 reports our weekly price and quantity indexes for surviving stores, broken down between "food products" and "housekeeping and personal care products." On average, surviving stores experienced a 20-percent rise in their sales volumes in the months that followed the hurricane. Tellingly, sales volumes of housekeeping and personal care products surged over 60 percent initially, with spending on product categories such as toothbrushes and razors more than doubling. These surges are sad reminders that the hurricane left many stranded households in need of basic necessities.
| Figure 1: Supermarket prices and quantities in New Orleans, Louisiana, before, during, and after Hurricane Katrina |
|---|
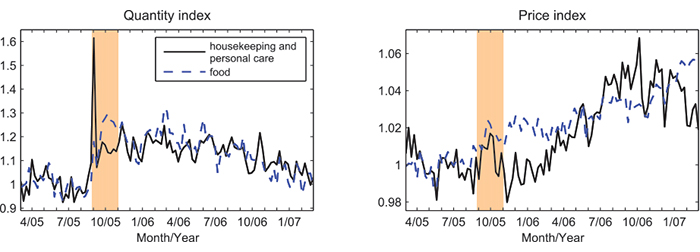 |
Source: Authors' calculations using IRI data. The price and quantity indexes are seasonally adjusted and scaled so that their geometric mean equals 1 in the 26-week period immediately prior to the hurricane. The shaded areas indicate the period (August 29, 2005, to November 1, 2005) covered by the Federal Emergency Management Agencys major disaster declaration.
Our empirical evidence provides little, if any, support to the view that stores took advantage of higher demand to raise prices, either initially when spending on personal care products skyrocketed or over the medium run when store traffic was boosted by mass population relocation. When we average over the period covered by the federal emergency declaration (August 29, 2005, to November 1, 2005), we find that prices were, on average, 1.4 percent higher than they were over the 26-week period before the hurricane. This increase is only a touch larger than that observed in the IRI sample for other U.S. markets not impacted by the storm. When we look at a longer period encompassing up to a year and half after the disaster, we find an average price increase of about 3 percent, which is only 1 percentage point larger than for other U.S. markets.
We are reluctant to interpret these small differences as suggestive that retailers increased prices in response to the higher demand brought by population relocation for a number of reasons. First, these increases are well within the range of variation for periods without natural disasters. Second, the extra price pressure in New Orleans was not broad based, as the price of housekeeping and personal care products rose in line with the national average. Third, and perhaps most importantly, the marginally larger food price increases in New Orleans may reflect in part or in whole higher acquisition and operation costs resulting from supply-related disruptions.4
Why Didn't Stores Raise Prices More in the Wake of the Hurricane?
In fact, the muted price response may be surprising to those who have in mind the textbook case of a large demand shock moving the economic allocation along an upward-sloping supply curve as well as the extra price pressure stemming from supply-side disruptions. Laws against price gouging cannot explain the absence of larger price increases. The declaration of a state of emergency by Louisiana governor Kathleen Babineaux Blanco on August 26, 2005, automatically made it illegal to increase prices beyond "the prices ordinarily charged for comparable goods and services in the same market area at or immediately before the time of the state of emergency." The expiration of this restriction 30 days later was not associated with any apparent increase in prices, suggesting that the legal constraints were not binding.
A perhaps more appealing explanation is that supermarkets did not want to antagonize customers by raising prices. Shoppers may have seen price increases in the wake of a natural disaster as unfair, even if justified by higher marginal costs. In turn, retailers may have judged that the short-run benefits of higher prices would be offset over the longer-run by damage to the relationship with their customers.5 That said, our sample contains few, if any, of the essential products that tend to captivate the public's attention in cases of alleged price gouging, as the sample notably excludes bottled water, gasoline, and hotel rooms. Moreover, retailers could have increased the average price paid by customers without raising regular prices, for instance by reducing the number and depth of promotions; our results do not support the use of such practices because both the number of items on sale and the mean discount remained at pre-hurricane levels.
Another explanation is that the large increase in demand moved the equilibrium allocation along a flat supply curve. Many products in the sample are national brands produced in facilities located in areas unaffected by the storm. These products' acquisition costs are typically set in advance in contracts between producers and retailers. Moreover, the acquisition costs represent the bulk of prices paid by shoppers (close to 80percent, on average, in the supermarket industry), so that even if a retailer were to experience an increase in, say, its labor costs, the effect on the prices charged to consumers could nonetheless be small if acquisition costs moved little.6
References
Blake, Eric S. and Ethan J. Gibney (2011). "The Deadliest, Costliest, and Most Intense United States Tropical Cyclones from 1851 to 2010 (and Other Frequently Requested Hurricane Facts)," NOAA Technical Memorandum NWS NHC-6, U.S. National Oceanic and Atmospheric Administration.
Bronnenberg, Bart J., Michael W. Kruger, and Carl F. Mela (2008). "Database Paper: The IRI Marketing Data Set," Marketing Science, vol. 27(4), pages 745748.
Cavallo, Alberto, Eduardo Cavallo, and Roberto Rigobon (2013). "Prices and Supply Disruptions during Natural Disasters," The Review of Income and Wealth, vol. 60(S2), pages S449S471.
Eichenbaum, Martin, Nir Jaimovich, and Sergio Rebelo (2011). "Reference Prices, Costs, and Nominal Rigidities," The American Economic Review, vol. 101(1), pages 234262.
Gagnon, Etienne and David López-Salido (2015). "Small Price Responses to Large Demand Shocks (PDF)," Finance and Economics Discussion Series 2014-18. Washington: Board of Governors of the Federal Reserve System.
Fabiani, Silvia, Martine Druant, Ignacio Hernando, Claudia Kwapil, Bettina Landau, Claire Loupias, Fernando Martins, Thomas Mathä, Roberto Sabbatini, Harald Stahl, and Ad Stokman (2006). "What Firms' Surveys Tell Us about Price-Setting Behavior in the Euro Area," International Journal of Central Banking, vol. 2(3), pages 347.
Geaghan, Kimberly A. (2011). "Forced to Move: An Analysis of Hurricane Katrina Movers 2009 American Housing Survey: New Orleans," Social, Economic, and Housing Statistics Division Working Paper Number 2011-17, U.S. Census Bureau.
Rotemberg, Julio J. (2011). "Fair Pricing," Journal of the European Economic Association, vol. 9(5), pages 952981.
1. These estimates are reproduced from Blake and Gibney (2011) from the National Oceanic and Atmospheric Administration. The precise death toll is disputed in part because estimates were obtained by aggregating reports from local and state authorities, which often did not have the expertise or resources to keep precise tallies. Moreover, there are inherent difficulties in classifying deaths of elderly, terminally ill people, unidentified bodies, and deaths for unreported reasons. Furthermore, the 1,200 deaths figure does not include indirect deaths that might have occurred in the wake of the hurricane as a result of higher mortality rates due to stress and other factors. Return to text
2. The dataset is detailed in Bronnenberg, Kruger, and Mela (2008). Return to text
3. The methodological details are presented in our longer research paper; Gagnon and López-Salido (2014) at http://www.federalreserve.gov/pubs/feds/2014/201418/201418pap.pdf. Return to text
4. Cavalo, Cavalo, and Rigobon (2014) also report a reluctance of retailers to increase prices in the wake of earthquakes in Chile in 2010 and Japan in 2011. These disasters were associated with shortages in the availability of products on-line, consistent with important supply disruptions, but may not have been accompanied by a large persistent rise in demand as was observed in New Orleans for stores that weathered the storm. Return to text
5. See Rotemberg (2011) for an exploration of how fairness motives on the part of consumers can affect firms' price-setting decisions. Return to text
6. Relatedly, the evidence on retail markups suggests that they move little in general. Eichenbaum, Jaimovich, and Rebelo (2011) show that item-level markups are tightly clustered around their mean using data from a large U.S. supermarket chain. Moreover, Fabiani et al. (2006) provide evidence of the pervasiveness of constant markup rules in a large survey of European firms. We cannot verify the hurricane's effect on retail markups because our dataset contains no information about costs. Return to text
Please cite as:
Gagnon, Etienne, and J. David Lopez-Salido (2015). "Mass Population Displacement and Retail Activities in the Wake of Hurricane Katrina," FEDS Notes. Washington: Board of Governors of the Federal Reserve System, August 26, 2015. https://doi.org/10.17016/2380-7172.1600
Disclaimer: FEDS Notes are articles in which Board economists offer their own views and present analysis on a range of topics in economics and finance. These articles are shorter and less technically oriented than FEDS Working Papers.
