
FEDS Notes
 Print
PrintSeptember 29, 2015
Recent Trends in Communications Equipment Prices
David Byrne and Carol Corrado
In a recently published working paper, Prices for Communications Equipment: Rewriting the Record, the authors of this note provide new estimates of prices for communications equipment for the period 1963 to 2009.1 In this note we extend those results through 2014 and comment briefly on the implications for high-tech innovation, production, and investment.
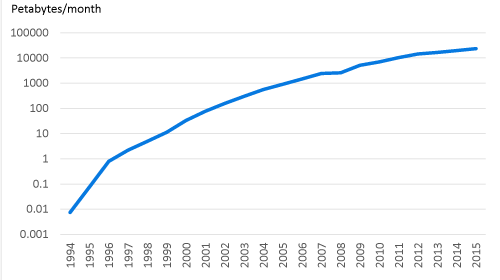
Communications technology has advanced at a stunning pace in recent years.2 As of the 1980s, cellular phone systems and the internet, now central to daily life in the United States, were rudimentary and had only a handful of users. The technologies embedded in the equipment behind these services--data compression, multiplexing (carrying multiple signals on a given channel), radio transmission, and circuit design--have improved dramatically since then. Rapidly climbing market penetration and soaring traffic on the internet and over the cellular network suggest that relative prices for these services were dropping, perhaps driven by technical advances (figures 1 and 2).
| Figure 1: U.S. Cellular Subscribers as Share of Population |
|---|
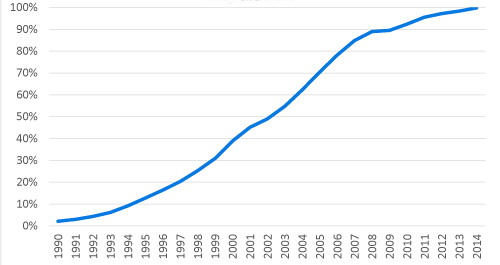 |
Source: Statistical Abstracts of the United States, various years.
U.S. Census Bureau.
Note. U.S. civilian population.
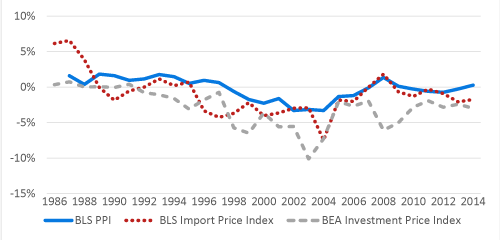
Counterintuitively, some official price indexes for communications equipment production show little change since the 1980s. The Bureau of Labor Statistics (BLS) producer price index (PPI) for domestic output has edged down at an average annual rate of 0.2 percent since its introduction in 1986, and the BLS price series for imported communications equipment (IPI) has moved down slightly faster since its first publication in 1985 (figure 3), at an average annual rate of 1 percent per year. The BEA price index for business spending on communications equipment used in the National Income and Product Accounts (NIPAs) records faster but still moderate declines averaging 3 percent per year. The NIPA investment prices index is based on the BLS PPI and IPI, BEA research, and outside sources including the price indexes published by the Federal Reserve.3
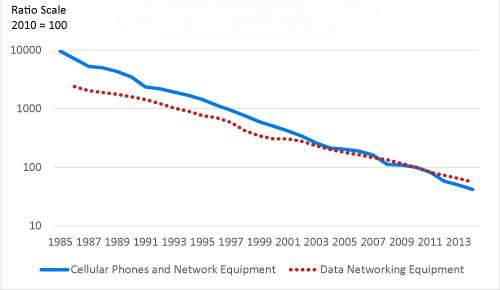
To explore the apparent tension between technological trends and official price indexes, we acquired data from high-tech consultancies on revenue, units, and capacity for an extensive set of products.4 The data are primarily quarterly factory revenue and typically are for sales to the US market, though in some cases data are only available for the North American or world market. These highly granular data allowed us to construct price indexes which control for quality change using a matched-model approach. The resulting indexes, discussed in detail in Byrne and Corrado (2015), indicate that the surge in cellular phone and internet use did coincide with rapid price declines for the equipment used to provide these services (figure 4). Prices also fell for many other types of communications equipment, including telephone systems, fax machines, modems, fiber optic transmission equipment, and satellites.
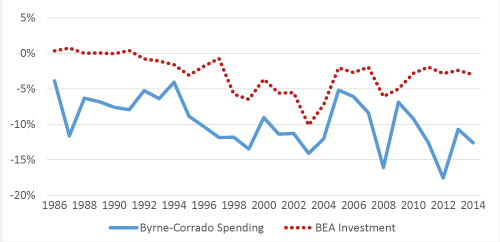
We aggregate these product indexes using estimates of U.S. spending constructed with data from the consultancies, government sources, and trade groups.5 Our spending index falls markedly faster than the BEA investment index (figure 5). The scopes of the two indexes shown differ in important ways. While the BEA index accounts for investment spending by businesses, the product weights used in our research spending index also include spending by households and government. In addition, the scope of the BEA index includes additional products, such as navigational, measuring, electro-medical, and control instruments.6 Finally, the BEA index accounts for capitalized spending on telecommunications services, which are not in scope for our analysis.7
Keeping these caveats in mind, it is interesting to note that the difference in price trends between our research spending index and the BEA's investment index has increased in recent years. As shown in table 1, the price trends (based on a version of our spending index that has been adjusted to remove household spending on cell phones) differed by 5 percentage points for the 2005-2010 period, and 9 percentage points for the 2010-2014 period suggesting a worsening of mismeasurement. In forthcoming research we construct an investment index that more closely matches the scope of the BEA investment price index and we consider implications for labor productivity in detail.
Given the relatively small share of investment accounted for by communications equipment, GDP would not significantly revise up if this price index were adopted. However, the research price index implies, all else equal, that the recorded nominal investment has contributed more to the real capital stock. If that is the case, IT capital services going forward would be commensurately larger, which carries with it important implications because IT capital services have historically made outsized contributions to labor productivity. Consequently, greater IT capital investment augurs well for future productivity gains.
Last, with respect to the debate about whether the impetus from the "IT Revolution" has petered out, we observe that prices for communications equipment have continued to fall rapidly in recent years. Price declines accelerated significantly in the mid-1980s and again in the mid-1990s. Since that time, prices for communications equipment--a general-purpose technology central to the economy--have been falling 11 percent, on average, per year for 20 years running, and price declines have shown no sign of slowing.
| Table 1 |
|---|
| Years | Byrne-Corrado | Bureau of Economic Analysis | Byrne-Corrado Less Bureau of Economic Analysis | Adjusted Byrne-Corrado Less Bureau of Economic Analysis |
|---|---|---|---|---|
| 1985-1990 | -7.3% | 0.2% | -7.5% | -7.4% |
| 1990-1995 | -6.5% | -1.2% | -5.3% | -5.0% |
| 1995-2000 | -11.3% | -3.7% | -7.6% | -7.3% |
| 2000-2005 | -10.9% | -6.2% | -4.7% | -4.1% |
| 2005-2010 | -9.4% | -3.7% | -5.7% | -5.0% |
| 2010-2014 | -13.4% | -2.5% | -10.9% | -9.2% |
Note. Rightmost column omits household spending on cell phones. | ||||
1. See Prices for Communications Equipment: Rewriting the Record," Finance and Economics Discussion Series 2015-069. Washington: Board of Governors of the Federal Reserve System. Return to text
2. Though our work begins in the 1960s, this note begins with the mid-1980s, an evident turning point in the industry. At that time, the structure of the communications market changed radically with the breakup of AT&T, and several disruptive innovations were introduced including routing technology, cellular phones, and fiber optic transmission. Return to text
3. Four quarterly-frequency price indexes are updated once a year and posted on the Federal Reserve website: data networking equipment, enterprise voice equipment, wireless (cellular) networking equipment, and transmission, local loop and legacy central office equipment. Return to text
4. We use data from the Consumer Electronics Association, Dell'Oro, Futron, Gartner Inc., Synergy, and the Telecommunications Industry Association. Early work by Doms (2005) is incorporated in our estimates. Return to text
5. In cases where independent data were not available, we employ BLS PPIs, most notably for the broadcast radio and TV and studio equipment. For earlier work on communications equipment prices, see Doms, Mark (2005), "Communications Equipment: What Has Happened to Prices?." In Measuring Capital in the New Economy, pp. 323-362. University of Chicago Press. Return to text
6. In the 1987 revision to the Standard Industrial Classification (SIC) system, the production of these products was removed from communications equipment and placed in a distinct industry. BEA has maintained a consistent pre-1987 SIC definition of communications equipment. Our research extends the 1987 definition, which matches the most recent (2012) NAICS definition, back to 1963. The difference is important to be aware of, but neither construct is more valid than the other. Return to text
7. Household spending on cellular phones, in particular, is a concern, since our cell phone price index is among our fastest falling price indexes. The U.S. Census Bureau's Services Annual Survey indicates that roughly 60 percent of revenue from wired telecommunications services is from household spending. The split for wireless services is not disclosed. Adjusting our index by reducing the weight of cell phone spending by 60 percent reduces the gap with the BEA investment index, as shown in table 1, but does not change the basic story. Return to text
Please cite as:
Byrne, David M., and Carol Corrado (2015). "Recent Trends in Communications Equipment Prices," FEDS Notes. Washington: Board of Governors of the Federal Reserve System, September 29, 2015. https://doi.org/10.17016/2380-7172.0067
Disclaimer: FEDS Notes are articles in which Board economists offer their own views and present analysis on a range of topics in economics and finance. These articles are shorter and less technically oriented than FEDS Working Papers.
