
FEDS Notes
 Print
PrintSeptember 3, 2015
The Runnables1
Jack Bao, Josh David, and Song Han
Introduction
Runs are an inherent vulnerability of the markets for short-term funding. Financial crises since the advent of banking have often exhibited systemic bank runs. The resulting disruptions to financial markets generally have had significant adverse impacts on the real economy. Moreover, in an environment of evolving financial markets and public policy, the compositions of run vulnerability may have also changed. For example, during the Great Depression, runs were mostly on bank deposits. But the introduction of federal deposit insurance greatly reduced the risk of deposit runs. In the 2007-2008 financial crisis, there were only limited incidents of runs on bank deposits.2 Instead, widespread runs occurred on various instruments issued by shadow banks, including asset-backed commercial paper (ABCP), money market mutual funds (MMFs), and repurchase agreements (repos) (Covitz, Liang, and Suarez, 2013; McCabe, 2010; Kacperczyk and Schnabl, 2010; Gorton and Metrick, 2012).3 Thus, for both policymakers and academics, measurement of aggregate run vulnerability and its composition is a critical component in evaluating and regulating systemic risk.
In this note, we describe a measure of "runnable liabilities," or simply "runnables," as a tool in monitoring run vulnerability, in terms of both its aggregate size and its composition, in the economy. We first define runnables, and then describe our estimation approach and discuss empirical properties of our estimates.
Definition
We define "runnables" as "pay-on-demand" transactions which embed defaultable promises made by private agents or state and local governments without explicit insurance from the federal government. A transaction is considered "pay-on-demand" if its term to maturity is short or the claimholder of the long-term debt has a put option that can be exercised on short notice. In general, the pay-on-demand feature implies that in the event of stress--caused by credit-risk concerns, large swings in short-term interest rates, or deteriorations in market liquidity--investors may exhibit bank-run-like behavior by redeeming their shares, unwinding their transactions, or deciding not to roll over their positions.
As an example, uninsured bank deposits fit our description of runnables while bullet corporate bonds do not. Depositors may run to withdraw their funds not insured by the FDIC, causing banks to liquidate assets or utilize liquidity backstops in response to sudden declines in funding. In contrast, fear about the credit risk of a bond issuer may induce large sell orders in the secondary market, but it does not necessarily force the issuer to pay off the existing debt. We identify and describe in detail a number of other runnable liabilities in the next section.
Runnables are often part of long intermediation chains, and our aggregate measure of runnables simply adds up the amount outstanding of each of the runnables' components along the chain rather than calculating the net amount. Conceptually, our aggregate measure of runnables provides an upper bound of all liabilities that can be run on. For example, an investor could invest $100 with a MMF, which could in turn lend an investment bank $100 in a repo. In our methodology, the aggregate runnables would be $200 because, ex ante, a run could occur in either transaction the investor could choose to stop investing in the MMF or the MMF could choose to end its repo with the investment bank. Ex post, the runs can be (and often are) associated. For example, if the investor withdraws $100 from the MMF, this may trigger the MMF to end its repo lending to the investment bank. There is a total run on $200 in funding, but it was initially triggered by a run of $100. Alternatively, the investor and the MMF could separately decide to run on their $100 investments for unrelated reasons. Our aggregate measure is simply the ex-ante total amount that can be run on, which is $200 in this example.
It is worth contrasting our measure of runnables to related concepts in the literature. Our measure of runnables shares some similarities with the "safe-asset" measure by Gorton, Lewellen, and Metrick (2012), but with notable differences. First, they include all bank deposits in their "safe-asset" measure, while we include only the uninsured part of deposits. Second, our non-deposits portion of runnables are close to their "money-like debt"--a component of their "safe-assets"--with one important, conceptual difference. They count net repos, but we count "gross" repos as discussed earlier. Third, many of their "safe-assets," for example, Treasury securities, municipal bonds, financial corporate bonds, etc., are not runnable. These differences are due to our different goals of measurement: In contrast to their focus on the demand for safe assets, our focus is on the vulnerability of liabilities to runs.
Also related to our measure is the gross money-like claim concept used by Ricks (2012), which is roughly defined as short-term IOUs by both sovereign and private issuers whose "value relative to currency is extremely stable." These are generally short-term debt with very low credit risk and very low interest rate risk. Conceptually, our focus is to isolate money claims that are runnable--those that are not issued or insured by federal governments. In addition, long-term debt with put options that can be exercised on short notice are also runnable but may not necessarily be money-like.
Our measure also differs from various existing measures on the size of shadow banking. For example, Gallin (2013) measures the importance of the shadow banking system as a source of funds for the nonfinancial sector. Gorton and Metrick (2010) use measures such as MMFs, securitization, and repos to provide a rough estimate of the size of the shadow banking system. Pozsar, Adrian, Ashcraft, and Boesky (2010) define the total liabilities of the shadow banking system as the sum of outstanding levels of CP, repos, GSE liabilities, GSE pool securities, liabilities of private-label ABS issuers, and MMF shares. These measures generally involve some types of netting. For example, Gallin (2013) tracks down the intermediation chain associated with borrowed funds of the nonfinancial sector to account for the share of funds provided by shadow banks. Pozsar et al. (2010) net MMF shares to avoid counting both sides of CP and repo transactions, resecuritizations of GSE securities, and other some sources of double-counting. In contrast, our approach is to account for runnable funding sources at all points of the intermediation chain so that we can gauge the vulnerability to runs. In addition, not all of the shadow banking components fit in our definition of runnables.
Estimation
We identify a number of liabilities that fit our definition of runnables. Data on some of these components are readily available, while others may be estimated. These include uninsured deposits, MMFs, repos, CP, securities lending (sec-lending), federal funds borrowed, variable-rate demand obligations (VRDOs), and funding agreement backed securities (FABS). We discuss the rationale of including each of these liabilities and the associated estimation method.4
Uninsured Bank Deposits
Historically, banking crises were characterized by runs on bank deposits. The promise of full payment on demand in deposit contracts essentially created a first-come first-served effect in withdrawals. That is, when individual depositors lose confidence in the safety of their deposits, either because of their concerns about the coordination failure among depositors or because of direct signals of bank insolvency, they rush to be first in line to withdraw (Diamond and Dybvig, 1983; Gorton, 1988).
Federal deposit insurance, which took effect on January 1, 1934, was designed to remove the cause of runs on deposits. In our estimation, we assume that depositors do not run on deposits below the insurance limits.5 However, the uninsured components of deposits remain vulnerable to runs.
Money Market Mutual Funds Shares6
Strictly speaking, MMF shares are not debt claims. However, the regulatory framework has historically caused investors to effectively treat them as if they were uninsured deposits. Until recent reforms, virtually all US MMFs were allowed to maintain a stable net asset value (NAV) through rounding, allowing investors to expect a full (next-day) return of principal upon redemption.7 This promise of return of principal, combined with redemptions on demand and the credit and liquidity risk (albeit small) of fund assets, gave rise to run incentives, because early redeemers were redeemed at the constant NAV whereas investors who redeemed their shares later could be subject to the fund "breaking the buck" and paying less than the full constant NAV.
As documented in McCabe (2010), investors ran on MMFs during the 2007-2008 financial crisis. Following the crisis, the SEC made an effort to reform the MMF industry and passed new rules in July 2014, which will take effect in October 2016. The new rules require that certain prime MMFs catering to large institutions float their NAVs and allow all MMFs to impose temporary restrictions on withdrawals amid market stress or require a fee to redeem shares. These new rules, however, do not remove all potential causes of runs on MMFs (see, for example, Cipriani, Martin, McCabe, and Parigi, 2014).
Repurchase Agreements and Securities Lending
Repos are essentially secured debt, in which the borrower sells a security with a promise to repurchase it later, usually in the short term such as overnight. Many financial intermediaries, such as broker-dealers and REITs, rely on continuous rollovers of repos as a funding source. But the cash lender, that is, the counterparty that buys the security at the inception of the repo, may stop rolling over during stress events, a mechanism similar to runs on bank deposits. Gorton and Metrick (2012) find that there was a significant run on repos during the recent Global Financial Crisis.
Sec-lending shares many similarities with repos. In a typical sec-lending transaction, the securities borrower provides cash collateral, which is in turn often reinvested by the securities lender in short-term securities such as CP, MMFs, or repos. The cash collateral in the sec-lending transaction is the same as the cash borrowed in a repo transaction. So economically and in accounting, from the perspective of the securities lender, the sec-lending transaction resembles a repo. The securities borrower could, on short notice, choose to return borrowed securities to call back cash collateral, just as a repo lender could stop rolling over cash funding. Note that our focus is on the provision of cash collateral, and not the reinvestment of cash collateral, which is accounted for in other runnable components from the liability point of the view.
Commercial paper
CPs are short-term obligations of corporations, in the forms of either unsecured or secured debt. As in repos, CP lenders may stop rolling over their credit when the existing CP matures. Covitz, Liang, and Suarez (2013) document significant runs in the asset-backed commercial paper (ABCP) market in 2007.
Variable-rate demand obligations
VRDOs are long-term municipal bonds with interest rates reset periodically, mostly daily or weekly, via remarketing. Bondholders have options to put back these bonds, at par, on rate-reset dates. Thus, while VRDOs are long-term bonds, they are essentially pay-on-demand short-term liabilities, and thus runnable.
Federal Funds Borrowed
Depository institutions must hold reserves in the form of vault cash or deposits with Federal Reserve Banks, called "Federal Funds," to meet reserve requirements. Federal Funds are often traded across banks on an overnight interbank market with banks with reserve shortages borrowing from those with excess reserves. Due to the overnight nature of the market, there can very naturally be runs. Afonso, Kovner, and Schoar (2011) find that the fed funds market suffered some disruption, but was not completely frozen following Lehman Brothers' default in 2008.
Funding Agreement Backed Securities
FABS are notes collateralized by a funding agreement. In the typical structure, a life insurer sells a funding agreement to a bankruptcy-remote special purpose vehicle, which then sells notes to investors. Many of these securities have periodic extension dates when investors elect whether to extend the maturity of their holdings or convert to short-term fixed maturity securities. Due to the option not to extend, FABS can be held by prime MMFs. Foley-Fisher, Narajabad, and Verani (2015) find that there was a run on FABS during the Global Financial Crisis.
Findings
As noted earlier, in monitoring run vulnerability in the financial market, it is important to examine both the composition and the total size of runnables. In Figure 1, we plot the levels of each of the components of the runnables series. A few points are worth noting. First, repos were the largest component leading up to the 2007-2008 financial crisis. Repos appear to break out in the early 1990's, a time when a number of factors made repos an attractive funding vehicle for securities dealings. These factors include the significant weakening in the Glass-Steagall Act, a maturing triparty repo mechanism, and the reform of bankruptcy codes to give safe harbor protection for repo contracts (Garbade, 2006). Following these developments, the passage of Gramm-Leach-Bliley legislation (which removed the last vestiges of Glass-Steagall), the further expansion of the bankruptcy safe harbor protection, and the growth of MBS trading contributed further to the brisk growth of repos over the ten years before the recent crisis.
Second, all major components of runnables shrank substantially during the 2007-2008 financial crisis. In the rough order of timing, CP was first, beginning its decline in mid-2007, consistent with evidence of a run on asset-backed commercial paper in 2007 (Covitz, Liang, and Suarez (2013)). Later, repos outstanding plummeted during the fourth quarter of 2008, after Lehman's bankruptcy filing in September 2008. However, it remains controversial as to whether this decline in repos was caused by a run in the repo market or reflected a credit crunch (Gorton and Metrick, 2012; Copeland, Martin, and Walker, 2014; Krishnamurthy, Nagel, and Orlov, 2014).8 MMFs, also declined sharply around the time of Lehman's demise, reflecting in large part a run on prime MMFs after the Primary Reserve Fund broke the buck in late 2008 due to their holdings of Lehman's CP.
Uninsured deposits also fell sharply in the fourth quarter of 2008, reflecting the substantial increase in the coverage of the deposit insurance policy. Federal deposit insurance was introduced in 1934 to prevent runs on deposits. To maintain depositors' confidence in the panic aftermath of Lehman's bankruptcy filing, President George W. Bush signed the Emergency Economic Stabilization Act of 2008, which temporarily raised the basic limit on federal deposit insurance coverage from $100,000 to $250,000 per depositor, effective October 3, 2008.9 Further, the FDIC implemented the temporary Transaction Account Guarantee Program (TAGP) in October 2008 to provide unlimited insurance to noninterest-bearing transaction deposits. This program, which eventually expired on December 31, 2010, was effectively extended by a similar provision in the Dodd-Frank Act. These policy measures substantially reduced the amount of uninsured deposits during the crisis, as many uninsured deposits became temporarily insured.
Third, repos have declined, but uninsured deposits have grown, since 2013, while other components have been roughly flat. After a moderate rebound post crisis, repos saw a notable decline since 2013, due reportedly to the higher balance sheet costs induced by new regulations, including the Liquidity Coverage Ratio and Supplemental Leverage Ratio requirements. In contrast, uninsured deposits jumped up in the first quarter of 2013 when the unlimited deposit insurance provision by the Dodd-Frank Act expired on December 31, 2012. Interestingly, despite the expiration, uninsured deposits have continued to grow briskly through the first quarter of 2015, now surpassing repos as the largest component of runnables.
Next, we examine the total size of runnables. In Figure 2, we plot the total amount of runnables, scaled by nominal GDP (the red line) and total private sector debt (the yellow line) over the period from the second quarter of 1985 to the first quarter of 2015.10 Prior to the mid-1990s, the amount of runnable liabilities outstanding was steady at approximately 40 percent of GDP. After 1995, there was a growth in runnable liabilities all the way to 80 percent of GDP just before the recent financial crisis. Unlike the previous two NBER recessions (gray shading), the recent financial crisis was also marked by a significant decline in runnables from 80 percent to 60 percent of GDP. The unraveling was dramatic and took only two years. Runnables as a fraction of total private debt also exhibited a decline in the recent financial crisis after remaining flat in the previous two NBER recessions.
With the benefit of hindsight, it is now fair to say that the systemic runs that occurred during the 2007-2008 financial crisis played the central role for the most severe economic recession since the Second World War. Real estate valuations in the mid-2000's would likely have had a large correction sooner or later, which would itself have had severe consequences to the real economy. However, the runs and subsequent disruptions to the financial markets transformed a sectoral correction into a crisis that for a time threatened to precipitate the collapse of the global financial system. This run dynamic distinguishes this latest recession from, notably, the recession in 2000--a recession caused by also asset price bubbles but with no runs.
Conclusion
In this note, we have constructed a measure for run vulnerability in the U.S. economy since 1985. Runnables unraveled during the 2007-2008 financial crisis, but stayed flat in the previous two recessions, even during the tech bubble collapse. Runnables are, as their name indicates, prone to runs and quick unraveling, making them prone to amplifying shocks (Cochrane, 2014). However, the risk of runs is a part of the overall liquidity "risk topography" (Brunnermeier, Gorton, and Krishnamurthy, 2012). So, policy debates and research should place runnables together with other risk components in assessing the aggregate vulnerability of the financial system (Aikman, Kiley, Lee, Palumbo, and Warusawitharana, 2015, Bai, Krishnamurthy, and Weymuller, 2015). In addition, we caution against a simplistic interpretation that "runnables are bad." Runnables are important to the proper functioning of the modern financial system, as, for example, they provide financing to broker-dealers who in turn provide financing to the nonfinancial sector.11 While beyond the scope of this note, future research should provide a quantitative framework to determine the optimal level of runnables that trades-off the social cost of amplifying shocks in crises and the benefits of financing.
| Runnable Liabilities |
|---|
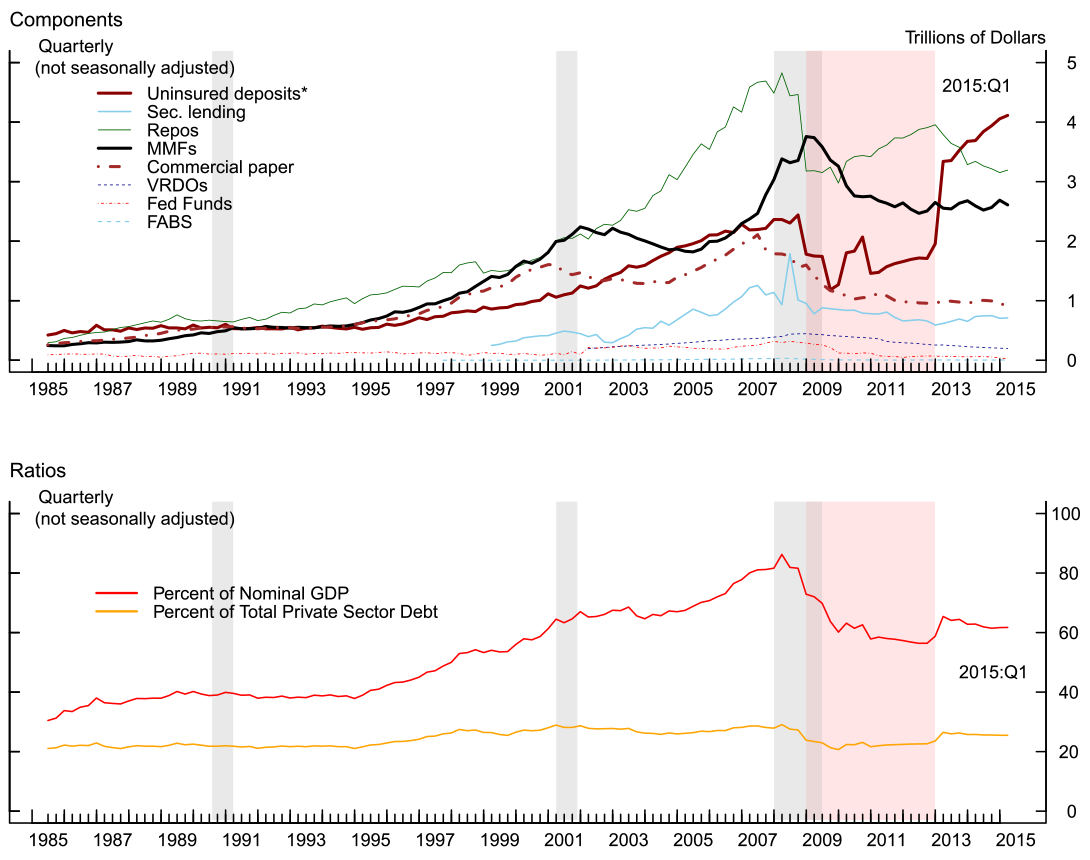 |
* Uninsured deposits equal the difference between total deposits and insured deposits. The quarterly insured deposits series between 1985 and 1990 is obtained by interpolating the available annual data. For 2008:Q4-2012:Q4 (red shades), insured deposits increased due to the Transaction Account Guarantee (TAG) Program. For 2008:Q4-2009:Q2, some insured deposits were not accounted for because the FDIC did not collect data on insured amounts for those TAG accounts with balances between $100,000 and $250,000.
Note: The gray shades, which overlap the red shades, indicate NBER recession dates.
Source: Staff calculations using data from RMA, DTCC, SIFMA, Call Reports, Financial Accounts, M3 monetary aggregates, and Bloomberg Finance LP.
Data Appendix
| Series | Data Source | Note |
|---|---|---|
| Repos and Federal funds | Financial Accounts, Call Reports, M3 monetary aggregates | Federal funds equal to: Pre-2002, Call Reports, "Federal Funds purchased and securities sold under repurchase agreements; Booked in domestic offices; Commercial banks and thrifts, end of period" minus "Repurchase Agreements, not seasonally adjusted, M3, Federal Reserve H.6 Statistical Release"; starting 2002:Q1, Call Reports, "Federal Funds purchased; Booked in domestic offices; Commercial banks and thrifts, end of period". Repos equal to Financial Accounts' series, "All sectors; federal funds and security repurchase agreements; liability (FL892150005.Q)", minus repos owed by monetary authority (FL712151003.Q), minus our estimated Federal funds series. See Gallin and Holmquist (2014) for a discussion of the repo statistics in the Financial Accounts. |
| MMFs | Financial Accounts | Money market mutual funds; total financial assets (FL634090005.Q) |
| Uninsured deposits | Call Reports | Uninsured deposits equals the difference between total deposits ("Total deposits; interest and non-interest bearing; Booked in domestic offices; All commercial banks, end of period") and insured deposits ("Insured deposits; interest and non-interest bearing; Booked in domestic offices; All commercial banks, end of period"). |
| Securities lending | Risk Management Association | "Total Market Value of Cash Reinvestments" from the RMA Quarterly Securities Lending Industry Composite Report. |
| Commercial paper | Financial Accounts | "All sectors; commercial paper; liability" (FL893169105.Q) from the Financial Accounts. |
| Variable-rate demand obligations | SIFMA | |
| Funding agreement-backed securities | Staff estimations based on Bloomberg data | The estimation is based upon methodology in Foley-Fisher, Nathan, Narajabad, Borghan N. and Verani, Stephane, (2015). |
| Total Private Sector Debt | Financial Accounts | Credit market instruments owed by households and nonprofit organizations (FL154104005.Q), nonfinancial business (FL144104005.Q), financial business (FL794104005.Q), and state and local governments, excluding employee retirement funds (FL214104005.Q) |
References
Afonso, Gara, Anna Kovner, and Antoinette Schoar (2011). "Stressed, Not Frozen: The Federal Funds Market in the Financial Crisis," Journal of Finance, August 2011, 1109 1139.
Aikman, David, Michael Kiley, Seung Jung Lee, Michael Palumbo, and Missaka Warusawitharana (2015). "Mapping Heat in the U.S. Financial System," Working Paper.
Anderson, Richard G. (2009). "Bankers' Acceptances: Yesterday's Instrument to Restart Today's Credit Markets?" Economics Synopses 2009-5. Federal Reserve Bank of St. Louis.
Bai, Jennie, Krishnamurthy, Arvind, and Weymuller, Charles-Henri (2015), "Measuring Liquidity Mismatch in the Banking Sector." March 15, 2015. Georgetown University working paper.
Brunnermeier, Markus, Gary Gorton, and Arvind Krishnamurthy (2012), "Risk topography," NBER Macroeconomics Annual 2011, 26, pages 149-176.
Cipriani, Marco, Antoine Martin, Patrick McCabe, and Bruno M. Parigi (2014). "Gates, Fees, and Preemptive Runs," Finance and Economics Discussion Series 2014-30. Board of Governors of the Federal Reserve System (U.S.).
Cochrane, John H. (2014). "Toward a Run-free Financial System," in Across the Great Divide: New Perspectives on the Financial Crisis, eds. Martin Neil Baily and John B. Taylor, 197 249. Stanford: Hoover Institution Press, 2014.
Copeland, Adam, Antoine Martin, and Michael Walker (2014). "Repo Runs: Evidence from the Tri-Party Repo Market," Journal of Finance 69, 2343 2380.
Covitz, Daniel, Nellie Liang, and Gustavo A. Suarez (2013). "The Evolution of a Financial Crisis: Collapse of the Asset-Backed Commercial Paper Market," Journal of Finance, June 2013, 815848.
Diamond, Douglas W. and Philip H. Dybvig (1983). "Bank runs, deposit insurance, and liquidity". Journal of Political Economy, Vol. 91, No. 3 (Jun., 1983), pp. 401-419.
FDIC (1998). "A Brief History of Deposit Insurance." Prepared for the International Conference on Deposit Insurance. Washington, DC. September 1998.
Foley-Fisher, Nathan C., Borghan Narajabad, and Stephane H. Verani (2015). "Self-fulfilling Runs: Evidence from the U.S. Life Insurance Industry," Finance and Economics Discussion Series 2015-032. Board of Governors of the Federal Reserve System (U.S).
Frydman, Carola, Eric Hilt, and Lily Y. Zhou (2014). "Economic Effects of Runs on Early `Shadow Banks': Trust Companies and the Impact of the Panic of 1907," Journal of Political Economy, forthcoming.
Gallin, Joshua (2013). "Shadow Banking and the Funding of the Nonfinancial Sector." FEDS 2013-50.
Gallin, Joshua and Elizabeth Holmquist (2014). "Repurchase Agreements in the Financial Accounts of the United States," FEDS Notes, June 30, 2014.
Garbade, Kenneth D., (2006), "The Evolution of Repo Contracting Conventions in the 1980s," FRBNY Economic Policy Review / May 2006.
Gorton, Gary (1988). "Banking Panics and Business Cycles," Oxford Economic Paper, 40(4): 751-781.
Gorton, Gary B., Stefan Lewellen, and Andrew Metrick (2012). "The Safe-Asset Share," NBER Working Paper No. 17777.
Gorton, Gary; Metrick, Andrew, (2010). "Regulating the Shadow Banking System", Brookings Papers on Economic Activity, Fall 2010, pp. 261-97.
Gorton, Gary B. and Andrew Metrick (2012). "Securitized banking and the run on repo," Journal of Financial Economics, June 2012, 425 451.
Iyer, Rajkamal and Manju Puri (2012). "Understanding Bank Runs: The Importance of Depositor-Bank Relationships and Networks," American Economic Review 102, 1414 1445.
Kacperczyk, Marcin and Philipp Schnabl (2010). "When Safe Proved Risky: Commercial Paper during the Financial Crisis of 2007 2009," Journal of Economic Perspectives, Winter 2010, 29 50.
Krishnamurthy, Arvind, Stefan Nagel, and Dmitry Orlov (2014), "Sizing Up Repo," Journal of Finance 69, 2381 2417.
Levine, Ross and Sara Zervos (1998). "Stock Markets, Banks, and Economic Growth," American Economic Review 88, 537 558.
McCabe, Patrick (2010). "The Cross Section of Money Market Fund Risks and Financial Crisis," Finance and Economics Discussion Series 2010-51. Board of Governors of the Federal Reserve System (U.S.).
Pozsar, Zoltan, Tobias Adrian, Adam Ashcraft, and Hayley Boesky, (2010). "Shadow Banking", Federal Reserve Bank of New York, Staff Reports: 458.
Ricks, Morgan (2012). "The Case for Regulating the Shadow Banking System," in Rocky Times: New Perspectives on Financial Stability, ed. Yasuyuki Fuchita, Richard J, Herring, and Robert E. Litan, 89 116. Washington: Brookings Institution Press, 2012.
Shin, Hyun-Song (2009). "Reflections on Northern Rock: The Bank Run that Heralded the Global Financial Crisis," Journal of Economic Perspectives 23, 101 119.
1. The views expressed herein are those of the authors and do not necessarily reflect those of the Federal Reserve Board or its staff. We thank Joshua Gallin, Patrick McCabe, Michael Palumbo, and Stephane Verani for their helpful comments. We also thank Della Cummings, Jay Im, Nathan Lloyd, Elizabeth Holmquist, Carolyn Pelnik, and Heather Wiggins for their valuable assistance. Return to text
2. The incidents of classical bank runs during the recent crisis include those on Countrywide Bank and IndyMac Bank in the U.S. and on Northern Rock in the UK (Shin, 2009). Return to text
3. The subprime crisis was not the first time that runs occurred on shadow bank-like institutions. For example, Frydman, Hilt, and Zhou (2014) find that runs on shadow banks occurred during the Panic of 1907. Return to text
4. Notable omissions of liabilities that potentially fit our definition, due in part to data limitations, include local government investment pools, total return swaps (which can be used to create synthetic repos), private liquidity funds, tender option bonds (TOBs), bankers' acceptances, and long-term bonds with short-maturity put options (other than the VRDOs included here). Return to text
5. In practice, deposit insurance may not completely eliminate bank runs on even insured deposits. See, for example, Iyer and Puri (2012) for some evidence for this based on India bank data. Return to text
6. In theory, we may want to exclude Treasury-only MMFs from runnables. These fund shares are not explicitly guaranteed by the federal government, but the funds' assets are. Indeed, during the recent crisis, there were net inflows to these funds. Return to text
7. Regulations allowed for penny rounding and amortized cost methods, both of which effectively allowed funds whose assets were worth slightly lower than $1.00 per share to continue reporting a NAV of $1.00 per share. Return to text
8. Specifically, Gorton and Metrick (2012) argue that there was a run in the bilateral repo market. Copeland, Martin, and Walker (2014) argue that there was no run in the tri-party repo market, just a sharp decline of tri-party repo funding of Lehman around its bankruptcy in September 2008. Krishnamurthy, Nagel, and Orlov (2014) argue that the drop in the repo outstanding was mainly due to a credit crunch. Return to text
9. The last increase prior to 2008 was an increase to $100,000 in 1980. Return to text
10. Note that we omit securities lending, FABS, and VRDOs as these series start in 1999, 2001, and 2002, respectively. Return to text
11. Related, see Gallin (2013) for estimates of the amount of financing provided by shadow banking to the nonfinancial sector. Return to text
Please cite as:
Bao, Jack, Josh David, and Song Han (2015). "The Runnables," FEDS Notes. Washington: Board of Governors of the Federal Reserve System, September 03, 2015. https://doi.org/10.17016/2380-7172.1595
Disclaimer: FEDS Notes are articles in which Board economists offer their own views and present analysis on a range of topics in economics and finance. These articles are shorter and less technically oriented than FEDS Working Papers.
