
FEDS Notes
 Print
PrintDecember 22, 2016
A Look Under the Hood: How Banks Use Credit Default Swaps
Cecilia Caglio 1, R. Matthew Darst 2, and Eric Parolin 3
1 Introduction
The credit default swap (CDS) market is often regarded as one of the most influential financial market innovations to occur in the past 20 years.4 Despite its size,5 importance, and development, very little public information is available about how financial institutions use CDSs as investments or credit risk hedges. To better understand how derivatives are used requires, at a minimum, knowledge of the specific derivative transactions the institution undertakes as well as the institution's securities and loan portfolio. Extant research on how banks use derivatives has been conducted at the aggregate level because matching specific derivative transactions data to underlying credit exposure has been unattainable.6
This note uses a unique dataset that matches banks' securities and loan portfolios to bank credit derivative transactions to characterize the basic features of how the largest banks in the U.S. use the single name CDS market in their investment portfolios. Specifically, we combine data collected through the Comprehensive Capital Analysis and Review (CCAR) and the Capital Assessments and Stress Testing Report (FR Y-14Q Report) with transactions in corporate single-name CDS market from the Depository Trust & Clearing Corporation (DTCC).
We first provide descriptive reference entity characteristics for firms with and without traded CDS on their debt issuances (CDS and non-CDS firms, respectively). Consistent with current research, CDS firms tend to be larger and are generally higher-quality than non-CDS firms. Turning to banks' use of CDS, we find that CDS positions are quite large compared to the direct credit exposure of the CDS reference entities. We also find that banks tend to sell more credit protection than they buy for the firms in their loan and securities portfolios, which is the opposite of what one would expect if the only reason to use CDS were to hedge credit risk. Lastly, we document a distinction between how banks use the CDS market based on whether the bank issues loans to a firm, owns bonds issued by a firm, or has a combination of a firm's loans and bonds in its portfolio. Specifically, banks are net sellers of credit protection across priority-risk categories for their loan exposure. For their bond exposures, banks are net buyers of credit protection against secured bond holdings and net sellers of protection against unsecured bond holdings, which also runs counter to a hedging motive.
2 Data Description
We use two main data sets for our analysis. We obtain the loan and bond holding data for 31 of the largest U.S. bank holding companies (BHCs) from FR Y-14Q report. The report is collected on a quarterly basis and contains asset class and capital component data for the BHCs with total consolidated assets of $50 billion or more.7 For the purpose of our analysis, we use the Wholesale Risk (Corporate Loan Data) and the Securities Schedules from Q3:2011 to Q4:2015.8
The Corporate Loan Data Schedule (Schedule H) collects loan level details on corporate loans and leases that are held for investment or for sale by the BHCs at each quarter-end. The population of loans is reported at the credit facility level.9 If borrowers have multiple facilities from the same bank, each facility is reported separately. The data contain obligor and loan specific characteristics, including bank level assessments of obligor financial health. Our loan sample is limited to commercial and industrial loans with a committed balance greater than or equal to $1 million, issued to non-financial domestic firms.
The Securities Schedule (Schedule B) collects portfolio position data for individual securities that are available-for-sale or held-to-maturity. The BHC positions of each security are reported as amortized cost, market value, current face value, and original face value. We select only corporate bonds issued by domestic non-financial corporations.10
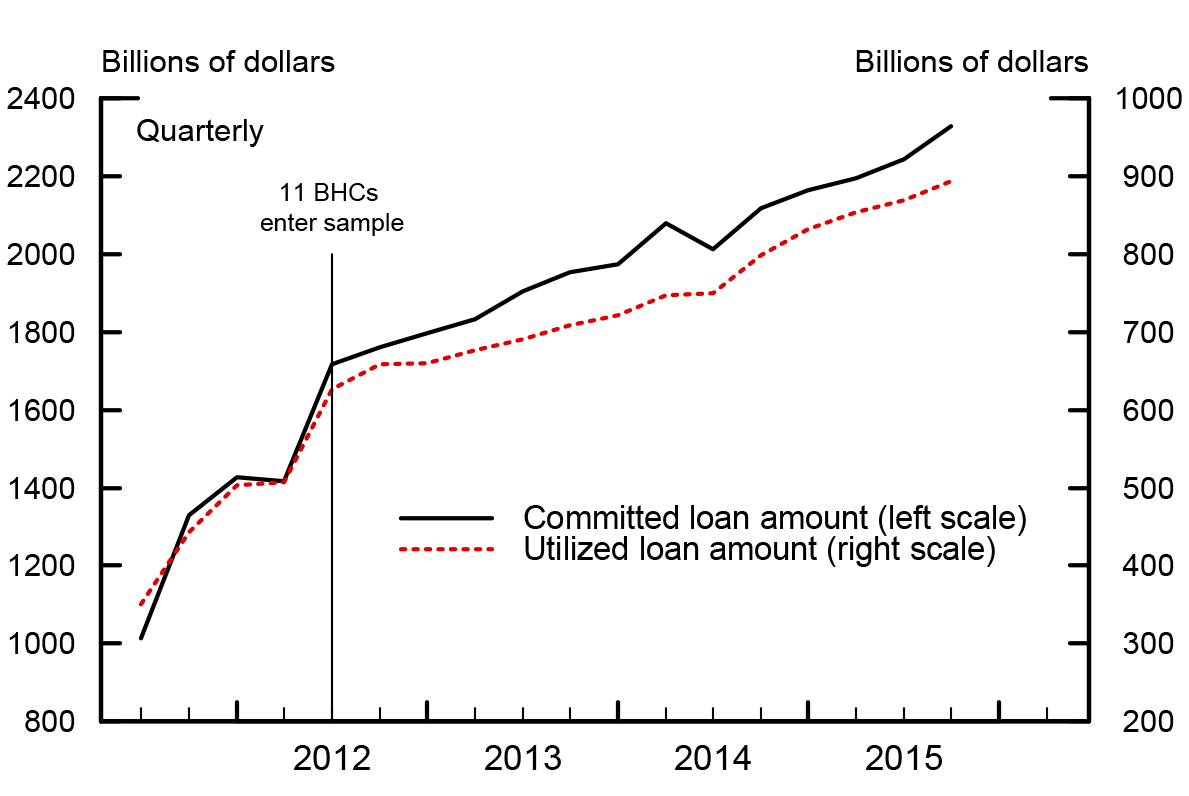
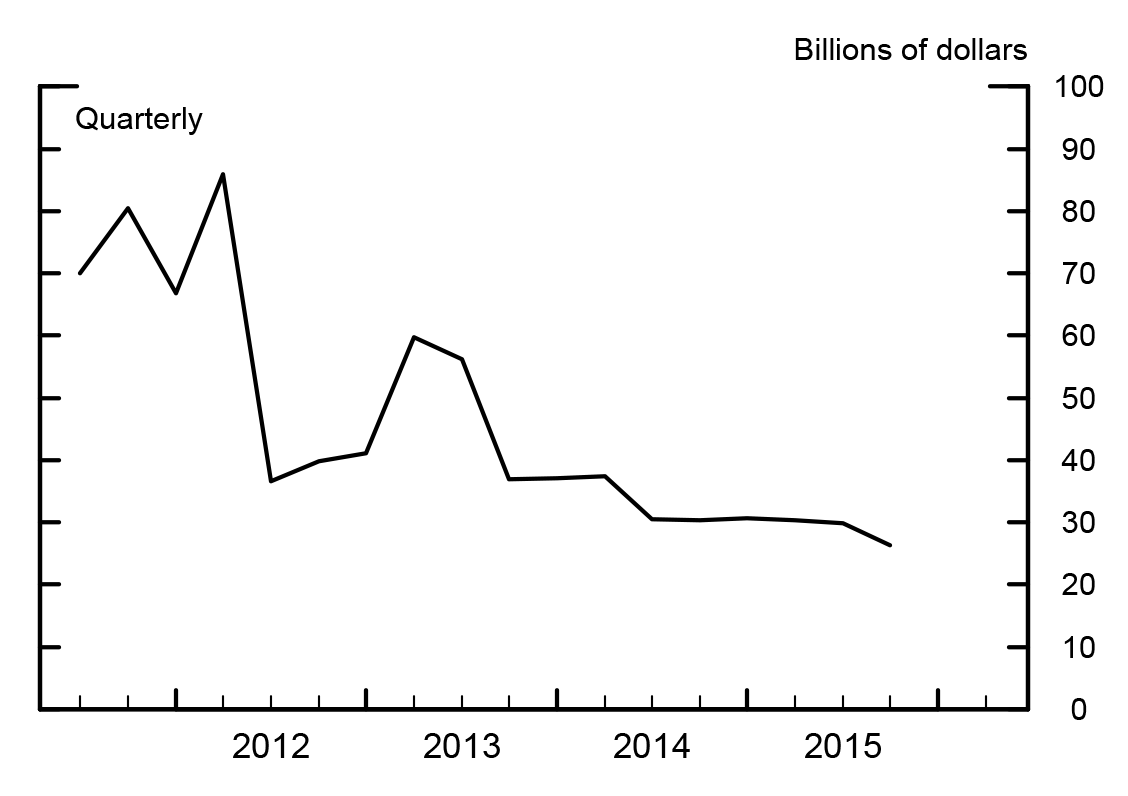
Panel (a) in Figure 1 shows the time series of the total amount of loans (committed and utilized) issued by all the BHCs during our sample period. We notice that both the amount of credit extended by the banks and the amount of credit utilized by debtors are growing at similar rates. The large jump in both variables in the second quarter of 2012 is the result of additional banks being included in the CCAR supervisory exercise. As shown in panel (b) of Figure 1, the market value of the banks' corporate bond portfolios is steady from 2011 through the first half of 2012, averages around $75 billion, and then begins to decline and level off at around $30 billion by the end of 2015.11
We obtain weekly outstanding CDS transactions written on U.S. firms from DTCC Trade Information Warehouse (TIW).12 From the overall data reported through TIW, we can only observe transactions for which at least one counterparty, or the reference entity, is a FRB-regulated entity, or a FRB-regulated entity acts as the clearing agent. Each record includes information about the name of the reference entity, trade date, effective date, contract maturity date, the names of the counterparties participating in the transaction, including their type (dealer vs. non-dealer entity), the notional amount,13 the market sector to which the reference entity belongs, and other information specific to the contract. For each lender-reference entity pair, this database allows us to compute the notional amount of CDS protection bought and sold over time.
 |
|
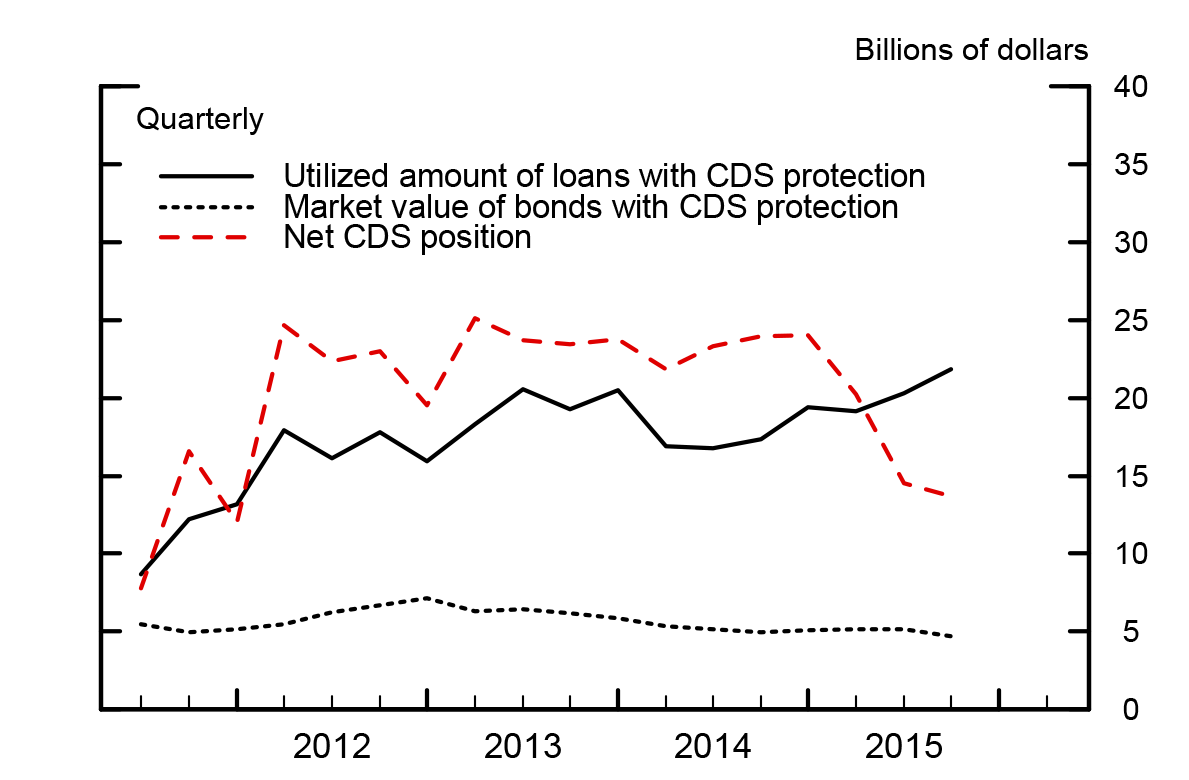
Note: The sign of the total net positions has been reversed. A positive number represents the net amount of protection sold.
First, we combine the weekly outstanding CDS transactions executed by each of the BHC affiliates' and subsidiaries' accounts. Next, we compute the notional amount of CDSs bought and sold by each counterparty for all reference entities.14 We define the notional value of the net position that each counterparty holds on a reference entity as the difference between the amount of protection bought and sold.
In Figure 2, we plot the total notional value of the net CDS positions, the value of utilized loans, and the market value of outstanding bonds held by CCAR banks at the reference entity level. Because we compare CDS use to credit exposure, we reverse the sign of the total net positions so that a positive number represents the net amount of protection sold. The first thing to note is that the size of total net protection sold is generally larger than the size of direct credit exposure. Second, the utilized loan amount grows similarly to the overall utilized loan amounts in Figure 1. Third, the notional value of net protection sold on single name CDS contracts largely tracks the trajectory of the utilized loan amounts until the beginning of 2015. The growth in the notional value of net protection sold suggests that the banks were selling more protection against their obligors as the obligors were utilizing more of their loans. These data are in line with the results of Campbell and Gallin (2015). The authors document that banks and dealers are typically net sellers of single name credit protection, while hedge-funds and mutual-funds are net buyers of credit protection.
| Non-CDS | CDS | |
|---|---|---|
| Panel A: Firm characteristics | ||
| Total Assets | 1,611 | 26,728 |
| Cash | 159 | 1,683 |
| Total Liabilities | 1,016 | 9,505 |
| Current Liabilities | 370 | 5,660 |
| Net Income | 75 | 495 |
| Tangible Assets | 1,277 | 20,538 |
| Capital Expenditure | 17 | 820 |
| Total # Firms | 139,490 | 647 |
| Panel B: Loan Characteristics | ||
| Avg. Utilized Amount 10 | 10 | 72 |
| Avg. Committed Amount 24 | 24 | 629 |
| Tot. Utilized Amount | 651,622 | 31,186 |
| Tot. Committed Amount | 1,579,867 | 268,762 |
| Average # Lenders | 1 | 6 |
| Panel C: Bond Characteristics | ||
| Avg. Book Value | 30 | 39 |
| Avg. Market Value | 30 | 34 |
| Tot. Book Value | 33,325 | 15,281 |
| Tot. Market Value | 32,793 | 13,111 |
| Total # Bond Issuers | 2,915 | 526 |
Note: All the dollar amount in the table are expressed in millions.
Lastly, the market value of bonds issued by CDS firms declines similarly to the market value of the overall bond issuances held by large U.S. banks shown in Figure 1. The decline in bond portfolio values and the rising utilized loan exposure indicates there may be some substitution between how the banks construct their portfolios across the loan and bond markets.
We use DTCC data to split the sample according to whether or not debtors in the FR Y-14Q data have CDS contracts (CDS Firms) or not (non-CDS Firms). Specifically, we define "CDS Firm" as a firm that has a CDS contract traded on its debt at least once in the four weeks prior to the reporting quarter. Our final sample includes 670 unique U.S. corporations with CDS contracts traded by at least one of the CCAR banks during the period from September 2011 to December 2015.
Panel A in Table 1 presents summary statistics for firms that have at least one outstanding loan issued and/or their bond issuances are held by at least one of the CCAR banks. The values are computed from Q3:2011-Q4:2015. Our data confirm the well-documented finding that CDS contracts tend to exist for larger and well established firms. On average, firms with CDS contracts have more assets, more cash and outstanding liabilities, and are more profitable than firms without CDS. Panels B and C present the loan and bond characteristics, respectively, for both CDS and non-CDS firms. In any given quarter, BHC's committed a total of $1.58 trillion in loans to non-CDS firms and $268 billion in loans to CDS firms. However, the average committed amount to non-CDS firms was only $24 million compared $629 million for CDS firms. Additionally, CDS firms have an average utilized exposure seven times larger than non-CDS firms. CDS firms borrow, on average, from six lenders and the non-CDS firms typically borrow from a single lender. Turning to bond positions, in any given quarter, BHCs hold a total book value of $32 billion in bonds issued by non-CDS firms compared to $15 billion in bonds issued by CDS firms. The average book value of the bond issuance held by BHC's is $39 million for a CDS firm compared to $30 million for a non-CDS firm.
We also distinguish the amount of loans that CDS and non-CDS firms obtain from the banks based on their rating. For this purpose we use the internal ratings that each BHC assigns to its obligors in the Schedule H of the FR Y-14 report. To allow comparison of the ratings across reporting institutions, the internal rating is converted to a standardized rating scale going from AAA (very low risk of default) to D (in default).15 Finally, if in a given quarter there is more than one rating assigned to one creditor, we take the lowest rating assigned by the reporting BHCs. As shown in Table 2, most of the loans to non-CDS firms are issued to firms with internal rating equivalent to BB (35% of the committed exposure and 44% of the utilized exposure), followed by firms with internal rating equivalent to BBB and A. For CDS firms, the loans are mostly issued to firms with internal rating equivalent to BBB (39% of the committed exposure and 46% of the utilized exposure) followed by A and AA or higher.
In Table 3 we repeat the same analysis on the bond positions. For issuer rating, when available, we use the same internal rating banks assign to their obligors in the loan schedule, otherwise we use Standard & Poor's (S&P) long-term issuer ratings from Compustat.16 For CDS-firms, most of the CDS positions are associated with firms with internal rating equivalent BBB (43% for both market and book values), followed by firms with internal rating equivalent to A or higher (37% for both market and book values). For non-CDS firms, CCAR banks hold bonds mostly issued by firms with internal rating equivalent to BBB (approximately 35% for both market and book values), followed by A and higher (60% for both market and book values).17 The ratings distribution for CDS firms is slightly more concentrated at the higher end of the rating scale than for non-CDS firms. The higher rated concentration is irrespective of the type of the credit exposure-loans or bonds-the banks have, and is consistent with the notion that the CDS market tends to exist for, relatively, less risky firms.
| Internal Issuer rating | # Loans | Avg Committed Exposure | Avg Utilized Exposure | Percentage Committed Exposure | Percentage Utilized Exposure |
|---|---|---|---|---|---|
| No CDS Firms | |||||
| (equiv. AA or higher) | 1,544 | 46.93 | 16.67 | 4.48 | 1.89 |
| (equiv. A) | 5,509 | 37.01 | 15.8 | 12.91 | 7.03 |
| (equiv. BBB) | 29,723 | 17.85 | 9.69 | 33.75 | 29.1 |
| (equiv. BB) | 49,796 | 10.87 | 7.38 | 34.53 | 43.89 |
| (equiv. B) | 14,624 | 11.28 | 7.27 | 10.53 | 13.03 |
| (equiv. CCC or lower) | 5,365 | 11.15 | 7.32 | 3.8 | 5.06 |
| CDS Firms | |||||
| (equiv. AA or higher) | 261 | 141.11 | 26.03 | 12.86 | 4.55 |
| (equiv. A) | 892 | 95.31 | 29.74 | 31.64 | 18.47 |
| (equiv. BBB) | 1,761 | 59.14 | 22.62 | 38.92 | 46.42 |
| (equiv. BB) | 687 | 44.23 | 18.78 | 11.25 | 20.95 |
| (equiv. B) | 201 | 41.98 | 19.71 | 3.12 | 5.44 |
| (equiv. CCC or lower) | 96 | 61.72 | 29.98 | 2.21 | 4.17 |
In Table 4 we pair the CDS positions (protection bought and protection sold) to the type of credit exposures the banks have. Specifically, we consider three types of credit exposures. In the first two panels we show the CDS positions for firms that have only bonds held by CCAR banks or have only loans (measured by utilized amount) Table 3: Bond Amount by Rating (in millions) issued by CCAR banks. The last panel shows the CDS positions for the firms that have both loans issued and bonds held by CCAR banks.
| Bond rating | Avg. # Issuers | Avg Market Value | Avg Book Value | Percentage Market Exposure | Percentage Book Exposure |
|---|---|---|---|---|---|
| No CDS Firms | |||||
| (equiv. A or higher) | 52 | 10.79 | 10.63 | 36.81 | 36.98 |
| (equiv. BBB) | 120 | 8.51 | 8.27 | 43.4 | 42.94 |
| (equiv. BB) | 72 | 6.56 | 6.52 | 14.67 | 14.77 |
| (equiv. B or lower) | 28 | 6.3 | 6.65 | 5.12 | 5.31 |
| CDS Firms | |||||
| (equiv. A or higher) | 95 | 14.81 | 14.52 | 59.69 | 60.21 |
| (equiv. BBB) | 151 | 10.04 | 9.65 | 34.94 | 34.48 |
| (equiv. BB) | 33 | 9.37 | 9.05 | 4.38 | 4.32 |
| (equiv. B or lower) | 14 | 5.47 | 5.35 | 0.99 | 0.98 |
There are a number of surprising observations to note. First, when banks have only loan exposure to an obligor, the banks tend to be net sellers rather than net buyers of credit protection, and the average size of net protection sold is substantially larger than the average size of net protection bought. This data is inconsistent with the assumption that banks use the CDS market largely to hedge their credit exposure (Minton et al. 2009). Second, the difference between the net value of protection bought and protection sold is much smaller when banks only hold a firm's bonds. Third, banks tend to be net buyers of protection when they own both loans and bonds of the same debtor, which is consistent with a hedging motive. Finally, banks tend to hold much larger loan exposures when they also own an obligor's bonds, but hold much smaller bond exposures when they also issue loans to the same obligors. The differences between loan and bond holdings may suggest loans act as a substitute for bonds in banks' portfolios, but not vice versa.
Table 5 shows the quarterly average total amount of loans issued to CDS and non-CDS firms, by lien position. Seventy percent of the loans issued to CDS firms are senior-unsecured loans, while only 20% of the loans issued to non-CDS firms are senior-unsecured. The propensity to issue unsecured loans is consistent with the notion that banks hedge unsecured credit risk through the CDS market. However, the last two columns in the table show that the banks have much larger net sell positions than net buy positions on their unsecured loan exposures, which is inconsistent with a hedging motive.
| obs | Net CDS Position | Total Exposure | Bond Exposure | Loan Exposure | |||||
|---|---|---|---|---|---|---|---|---|---|
| mean | median | mean | median | mean | median | mean | median | ||
| Panel A: Only Loans | |||||||||
| Protection Sold | 3277 | -55.34 | -33.6 | 45.39 | 20.14 | 45.39 | 20.14 | ||
| Protection Bought | 2211 | 31.78 | 16.08 | 45.32 | 19.94 | 45.32 | 19.94 | ||
| Panel B: Only Bonds | |||||||||
| Protection Sold | 2681 | -49.37 | -24.04 | 10.75 | 5.59 | 10.75 | 5.59 | ||
| Protection Bought | 2791 | 51.13 | 18.00 | 10.48 | 6.19 | 10.48 | 6.19 | ||
| Panel C: Bonds and Loans | |||||||||
| Protection Sold | 454 | -43.81 | -24.48 | 73.79 | 39.2 | 7.95 | 4.08 | 65.84 | 30.03 |
| Protection Bought | 512 | 69.41 | 17.5 | 59.24 | 29.28 | 9.19 | 5.54 | 50.06 | 16.39 |
| Lien Position | Utilized Exposure | Committed Exposure | Avg. # Obligors | Percent | Net Buy Positions | Net Sell Positions |
|---|---|---|---|---|---|---|
| Non-CDS Firms | ||||||
| First-Lien Senior | 482,801.38 | 953,396.28 | 54,208 | 78.12 | ||
| Second Lien | 6,994.06 | 13,566.94 | 956 | 1.22 | ||
| Senior Unsecured | 146,866.32 | 574,665.07 | 12,507 | 20.02 | ||
| Contractually Subordinated | 5,237.85 | 17,488.90 | 599 | 0.64 | ||
| CDS-Firms | ||||||
| First-Lien Senior | 10,202.80 | 50,526.96 | 247 | 28.13 | 3,919.63 | -7,442.26 |
| Second Lien | 199.42 | 1,396.23 | 14 | 0.63 | 648.21 | -742.31 |
| Senior Unsecured | 19,716.42 | 210,162.96 | 371 | 70.05 | 12,086.12 | -30,036.95 |
| Contractually Subordinated | 327.36 | 2,068.55 | 32 | 1.19 | 403.51 | -523.5 |
To perform an analysis for bond holdings by seniority and collateral, we supplement the FR Y-14 securities data with data from the Fixed Investment Securities Database (FISD). We are able to match only 7,538 out of 11,313 of the bond issues in the FR Y-14 Securities Schedule. Table 6 reports, by seniority, CCAR bank bond holdings issued by CDS and non-CDS firms. The vast majority of the bond issuances held by the banks are senior-unsecured, for both CDS and non-CDS firms. The percentage of unsecured bond holdings issued by CDS firms is larger than the percentage of unsecured bond holdings issued by non-CDS firms (93% and 83% respectively), though the difference is much less pronounced than the difference in the loan issuance data. The similarity in bond holdings issued by CDS and non-CDS firms suggests that seniority and collateral in bond markets is much less significant than the lien position in the loan market in determining how banks use CDS.
| Bond Seniority | Market Value | Book Value | Avg. # Obligors | Percent | Net Buy Positions | Net Sell Positions |
|---|---|---|---|---|---|---|
| Non-CDS Firms | ||||||
| Secured | 716.59 | 699.45 | 82 | 12.68 | ||
| Senior | 7,971.96 | 7,837.20 | 538 | 83.41 | ||
| Subordinated | 185.24 | 175.57 | 25 | 3.91 | ||
| CDS-Firms | ||||||
| Secured | 248.03 | 239.45 | 19 | 4.73 | 129.4 | -33.05 |
| Senior | 12,751.95 | 12,375.01 | 379 | 92.95 | 8,116.84 | -8,752.11 |
| Subordinated | 49.72 | 47.89 | 9 | 2.32 | 2.42 | -2.39 |
3 Conclusion
In conclusion, CDS firms tend to be larger and rated slightly higher than non-CDS firms. For the subset of firms for whom banks buy and sell CDS, the type of credit exposure - loan issuance or bond holding - seems to differentially affect banks' CDS positions. Mainly, larger loan exposures are correlated with larger net sell positions, and bond exposures do not tend to tilt CDS positions in either direction. Banks tend to be net buyers of protection only when they have both loan and bond exposure to an obligor. Additionally, lien and seniority considerations do not indicate that banks are hedging their credit exposure against lower priority debt claims. On the contrary, banks appear to be selling credit protection more frequently for the lien positions one would expect them to be buying credit protection against if hedging credit risk were their only motive. In sum, our data suggest that banks may be largely taking additional credit risk through the single name CDS market rather than using the market largely to hedge existing credit risk. The focus of our current and on-going research seeks to formally explain this novel finding.
References
1. Adam B. Ashcraft and Joao A.C. Santos. Has the cds market lowered the cost of corporate debt? Journal of Monetary Economics, 56:514-23, 2009.
2. Mascia Bedendo, Lara Cathcart, and Lina El-Jahel. Distressed debt restructuring in the presence of credit default swaps. Journal of Money, Credit and Banking, 48(1):165-201, February 2016.
3. Sean Campbell and Joshua Gallin. Risk transfer across economic sectors using credit default swaps. FEDS Notes 2014-09-03, Board of Governors of the Federal Reserve System (U.S.). 2014.
4. Andras Danis. Do empty creditors matter? Evidence from distressed exchange offers. Manuscript, Georgia Tech, 2015.
5. Beranadette Minton, René M. Stulz, and Rohan Williamson. How much do banks use credit derivatives to hedge loans? Journal of Financial Service Research, 35:1-31, 2009.
6 .Alessio Saretto and Heather Tookes. Corporate leverage, debt maturity, and credit default swaps: The role of credit supply. Review of Financial Studies, 26:1190-247, 2013.
7. Marti Subrahmanyam, Dragon Y. Tang, and Sarah Q. Wang. Does the tail wag the dog? the effect of credit default swaps on credit risk. Review of Financial Studies, 27:2927-60, 2014.
1. Federal Reserve Board of Governors: [email protected]. Return to text
2. Federal Reserve Board of Governors: [email protected]. Return to text
3. Federal Reserve Board of Governors: [email protected]. Return to text
4. A CDS is a contract between two counterparties for the transfer of a reference entity's credit risk. Typical reference entities in the corporate CDS market are either single firms, a basket of firms, or a large group of firms that comprise an index. The credit protection buyer pays monthly or quarterly premiums for the life of the contract to the credit protection seller in exchange for insurance against a pre-specified credit event. If a pre-specified credit event occurs, the protection buyer is entitled to receive payment equal to the notional value of the CDS contract purchased. If a credit event does not occur, the protection seller owes nothing to the protection buyer and the contract is closed. JP Morgan is credited with creating the first CDS contract referencing Exxon Valdez in 1997. Return to text
5. The current size of the CDS market, as measured by the gross notional amount, is $12.5 trillion. Although its size is substantially smaller relative to the peak levels of around $60 trillion before the financial crisis, the CDS market continues to represent an important venue for buying and selling credit risk (see the weekly Notional Outstanding Data posted on the International Swaps and Derivatives Association (ISDA) website: http://www.swapsinfo.org/charts/swaps/notional-outstanding) Return to text
6. The almost universally accepted identification strategy to assess the effects of CDS markets on various bond market outcomes is to assume that the existence of the CDS market captures the relevant effect (see Ashcraft and Santos (2009), Subrahmanyan et al.(2014), Saretto and Tookes (2014), Danis (2015), Bedendo et al.(2016)). Authors typically take the first time a quote for a given reference entity appears in the Markit or GFI Group database as the date at which the market develops for any given reference entity. However, the existence of a CDS quote or trade provides no information about who is buying or selling the derivative contract, much less whether or not the CDS buyer or seller has an insurable interest in the CDS reference entity. Return to text
7. The bank holding companies included in the sample are: beginning in Q3:2011 Ally Financial, Bank of America Corporation, BB&T Corporation, Bank of New York Mellon Corporation, Citigroup Incorporated, Capital One Financial Corporation, Fifth Third Bancorp, Goldman Sachs Group Incorporated, JPMorgan Chase & Co., Keycorp, Morgan Stanley, PNC Financial Services Group Incorporate, Regions Financial Corporation, Suntrust Banks Incorporated, State Street Corporation, U.S. Bancorp, Wells Fargo & Company. Beginning in Q3:2012 Comerica Incorporated, Huntington Bancshares Incorporated, HSBC North America Holdings Incorporated, M&T Bank Corporation, Northern Trust Corporation, RBC USA Holdco Corporation, Santander Holdings USA Incorporated, UnionBanCal Corporation (renamed to MUFG Americas Holding Corporation in Q3:2014), Zions Bancorporation. Beginning in Q2:2014 Discover Financial Services. Beginning in Q4:2014 BNP Paribas. Return to text
8. Each schedule must be completed by each BHC if a materiality threshold is met. Material portfolios are defined as those with asset balances greater than $5 billion or asset balances greater than 5% of Tier 1 capital, on average, for the four quarters preceding the reporting quarter. Return to text
9. A credit facility is defined as any legally binding credit extension to a legal entity under a specific credit agreement. A credit facility may be secured or unsecured, term or revolving, drawn or undrawn (excluding informal advised lines). Return to text
10. There is no materiality threshold for securities reporting at the individual obligor level. BHCs must report their securities holdings if the entire portfolio is greater than either $5 billion or five percent of Tier 1 capital on average for the four quarters preceding the reporting quarter. Return to text
11. Corporate bond holdings represent a small fraction of BHCs' total bond portfolios in our sample period. This evidence could reflect the post-crisis regulations, in particular the restrictions the Volcker Rule imposed on most banks regarding proprietary trading. Return to text
12. The data includes only trades that constitute risk transfer activity, that is new trades, terminations of existing transactions (due to a credit event that triggered the settlement of the contract or to the natural maturity of the contract), assignments of existing transactions to a third party, but exclude the portfolio compression trades. Return to text
13. The notional amount represents the par amount of credit protection bought or sold, equivalent to debt or bond amounts, and is used to compute the coupon payment and the recovery amounts in case of a credit event. The notional amount is most commonly denominated in US dollars, Euro, British Pound, Japanese Yen, and Swiss Franc. We use the prevailing foreign exchange rate for each end of the week the positions are computed. Return to text
14. The analysis reported here only includes single-name CDS contracts. We do not include index trades where the reference entity is an index constituent. Return to text
15. See, for example, the Supervisory Stress Test Methodology and Results document for CCAR 2015, https://www.federalreserve.gov/bankinforeg/stress-tests/2015-Appendix-B.htm. Return to text
16. The reported level of disaggregation for bond holdings is slightly different than level for loans due to confidentiality. Return to text
17. Since this analysis is conditional on the existence of internal rating, it is performed only for firms that also have a loan. Return to text
Please cite as:
Caglio, Cecilia, Matt Darst, and Eric Parolin (2016). "A Look Under the Hood: How Banks Use Credit Default Swaps," FEDS Notes. Washington: Board of Governors of the Federal Reserve System, December 22, 2016, https://doi.org/10.17016/2380-7172.1865.
Disclaimer: FEDS Notes are articles in which Board economists offer their own views and present analysis on a range of topics in economics and finance. These articles are shorter and less technically oriented than FEDS Working Papers.
