
FEDS Notes
 Print
PrintMarch 2, 2016
Annual Data on Investment and Capital Stocks
Christopher Kurz and Norman Morin
As part of the estimation of capacity for publication of its G.17 statistical release on industrial production and capacity utilization, the Federal Reserve Board produces annual information on the real capital stock and real investment for detailed industries within the manufacturing sector. This note provides a brief overview of the creation of the data, outlines the uses for the data, and is accompanied by a public release of the most recent vintage of the capital stock and investment series.
Investment and Capital Stock Series
An important component of the estimation of capacity indexes for most manufacturing industries is a measure of the flow of services derived from an industry's net stocks of physical assets.1,2 These service flows, called either capital input or capital services, are derived from estimates of the real capital stock.
For each industry, asset-level real capital stocks are estimated using investment data back to the 1860s (for structures) or 1870s (for equipment). The capital stocks are constructed using the perpetual inventory method, combining industry-level investment data (primarily from the Census Bureau's Annual Survey of Manufactures and Census of Manufactures), asset-level investment data (from the fixed assets tables issued by the Bureau of Economic Analysis [BEA]), and asset-level deflators (BEA).3
Industry-level capital stock measures are produced by chain-weighting the asset-level capital stocks for that industry. Industry-level capital stock data begin in 1952, extend through 2013, and cover 86 detailed four-digit manufacturing NAICS industries as well as related aggregates.
A Slowdown in Capital Growth
Economic growth since the 2007-09 recession has been somewhat slower, on average, than in previous recovery periods because of both disappointing productivity growth and investment that has been cyclically weak.4 For the overall economy, nonresidential private fixed investment increased at an average annual rate of only about 4-1/4 percent from 2012 through 2015, an unusually slow pace during an expansion.5
| Figure 1: Real manufacturing capital stock in equipment and structures (Chain weighted, billions $2009) |
|---|
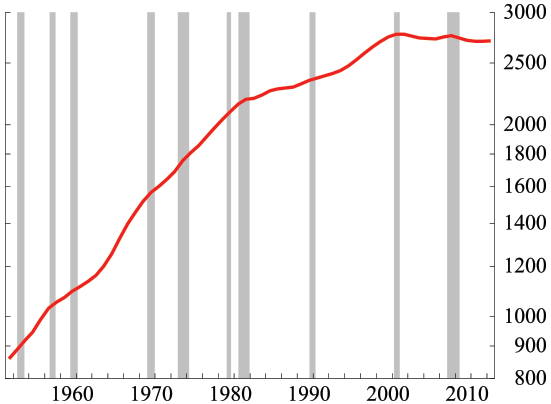 |
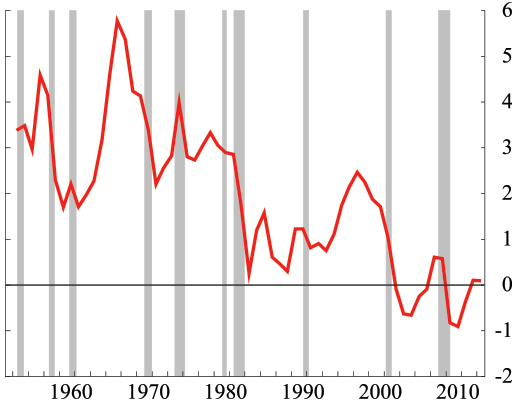
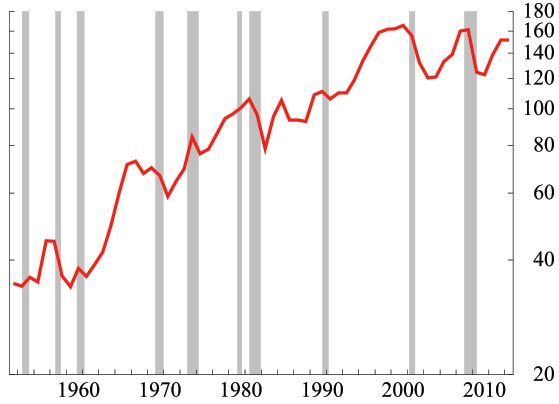
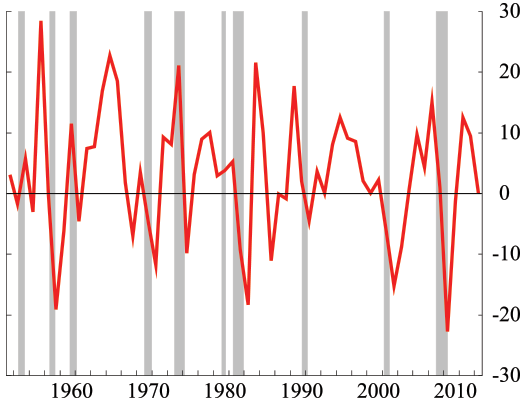
Figures 1 and 2 plot the real capital stock in equipment and structures for the manufacturing sector and its rate of change (gross investment less depreciation as a share of the stock at the end of the previous year). One striking aspect of the figure is the flattening out of the capital stock since 2000. After increasing around 3 percent per year, on average, through the 1960s and 1970s, the growth of the manufacturing capital stock remained positive but slowed dramatically during the dual recessions in the early 1980s. The capital stock expanded strongly in the 1990s and then posted unprecedented declines from 2002 to 2004 and from 2009 to 2011. It has risen only anemically since 2011. The post-2000 contour of the capital stock is a result of the pattern of investment spending by manufacturers. As can be seen in figures 3 and 4, since 2000, the cyclical declines in investment spending have been of longer duration, and they were not subsequently followed by prolonged bouts of sustained above-average rates of investment spending. In 2013, as a result, the level of the real capital stock in equipment and structures for manufacturing remained about 2-1/2 percent below its peak in 2001 and real investment in equipment and structures was nearly 5 percent below its peak in 2000.
Future Releases of the Investment and Capital Stock Data
In the coming years, the Federal Reserve Board plans to publish these data on an annual basis, timed to follow releases of the Annual Survey of Manufactures and Census of Manufactures, the primary sources for the industry-level investment series used to estimate capital stocks. In addition, upcoming releases will include an expanded set of data series. In particular, we plan to publish measures of capital input, as the services flow is the primary goal of our investment/capital estimation for the construction of our measures of manufacturing capacity. In addition, we plan to provide series for investment and capital for software in manufacturing industries. Moreover, the capital input series will be accompanied by a detailed explanation of their method of construction.
References
Becker, Randy, Wayne Gray, and Jordan Marvakov (2013), "NBER-CES Manufacturing Industry Database: Technical Notes," Working Paper.
Gilbert, Charles and Mike Mohr (1996), "Capital Stock Estimates for Manufacturing Industries: Methods and Data," Working Paper.
Gilbert, Morin, and Raddock (2000), "Industrial Production and Capacity Utilization: Recent Developments and the 1999 Revision (PDF)," Volume 86, March, pp. 19497.
Fernald, John (2015), "Productivity and Potential Output Before, During, and After the Great Recession," NBER Macroeconomics Annual 2014, Volume 29, pp. 151, Parker and Woodford. 2015
Pinto, Eugenio P., and Stacey Tevlin (2014), "Perspectives on the Recent Weakness in Investment," FEDS Notes 2014-05-21. Board of Governors of the Federal Reserve System (U.S.).
1. See Gilbert, Morin, and Raddock, "Industrial Production and Capacity Utilization: Recent Developments and the 1999 Revision (PDF)," Volume 86, March 2000, pp. 19497. Return to text
2. The NBER-CES Manufacturing Industry Database  employs the Federal Reserve Board's annual data on Investment and Capital Stocks to derive information on depreciation rates and for investment deflators. See Becker, Gray, and Marvakov (2013) for more information. Return to text
3. Please see the March 1996 document by Gilbert and Mohr "Capital Stock Estimates for Manufacturing Industries: Methods and Data (PDF)" for a detailed treatment of how industry-level investment and asset-level investment are combined to form estimates of industry investment across asset categories, and how the time series of industry-by-asset investment are used to form estimates of capital stocks.Return to text
4. See Fernald (2015). Return to text
5. See Pinto and Tevlin (2014). Return to text
Please cite this note as:
Kurz, Christopher J., and Norman J. Morin (2016). "Annual data on Investment and Capital Stocks," FEDS Notes. Washington: Board of Governors of the Federal Reserve System, March 2, 2016, http://dx.doi.org/10.17016/2380-7172.1717.
Disclaimer: FEDS Notes are articles in which Board economists offer their own views and present analysis on a range of topics in economics and finance. These articles are shorter and less technically oriented than FEDS Working Papers.