
FEDS Notes
 Print
PrintJuly 15, 2016
Bank Complexity: Is Size Everything?
Jeremy Oldfather, Stefan Gissler, and Doriana Ruffino
Can we measure the complexity of large banks by comparing their balance sheets? The Basel Committee on Banking Supervision (BCBS) acknowledges that we cannot, but it stops short of defining alternative non-balance-sheet measures.1 In this note, we propose a network-based analysis to study the structural complexity of banks through publicly available data on the structure of large U.S. banks. We show that our analysis is also informative more broadly for tailoring bank resolution plans.
The BCBS--composed of members from 28 nations--has developed three measures of overall complexity: (1) Level 3 assets, (2) trading and available-for-sale securities, and (3) the notional amount of over-the-counter derivatives (Basel Committee on Banking Supervision, 2013). Structure data could offer another measure of complexity to the regulators of member banks.2
Structure data allow us to address several shortcomings of the three BCBS balance sheet measures. First, Level 3 assets capture the complexity of the assets funding the bank's operations. Structure data allow us to quantify the complexity involved in managing the companies that play a direct role in the credit, maturity, and liquidity transformation process of those assets. Second, trading and available-for-sale securities measure the complexity involved in providing market liquidity. Structure data, along with counterparty data, allow us to analyze the firms to which liquidity is provided and how the liquidity of one asset class may differ from or affect another during a crisis. And, third, the notional amount of over-the-counter derivatives captures the value of bets that may be difficult to unwind during a crisis. Structure data may additionally identify the firms within the holding company that are building up these positions and how central these firms are to the operations of the holding company.
We assess the complexity of the eight U.S. global systemically important banks (G-SIBs). For each G-SIB, we build a network of its organizational structure based on its equity holdings and those of its subsidiaries. In our figures, each point (node) is a company, and each connection (edge) represents an equity relationship between two companies.
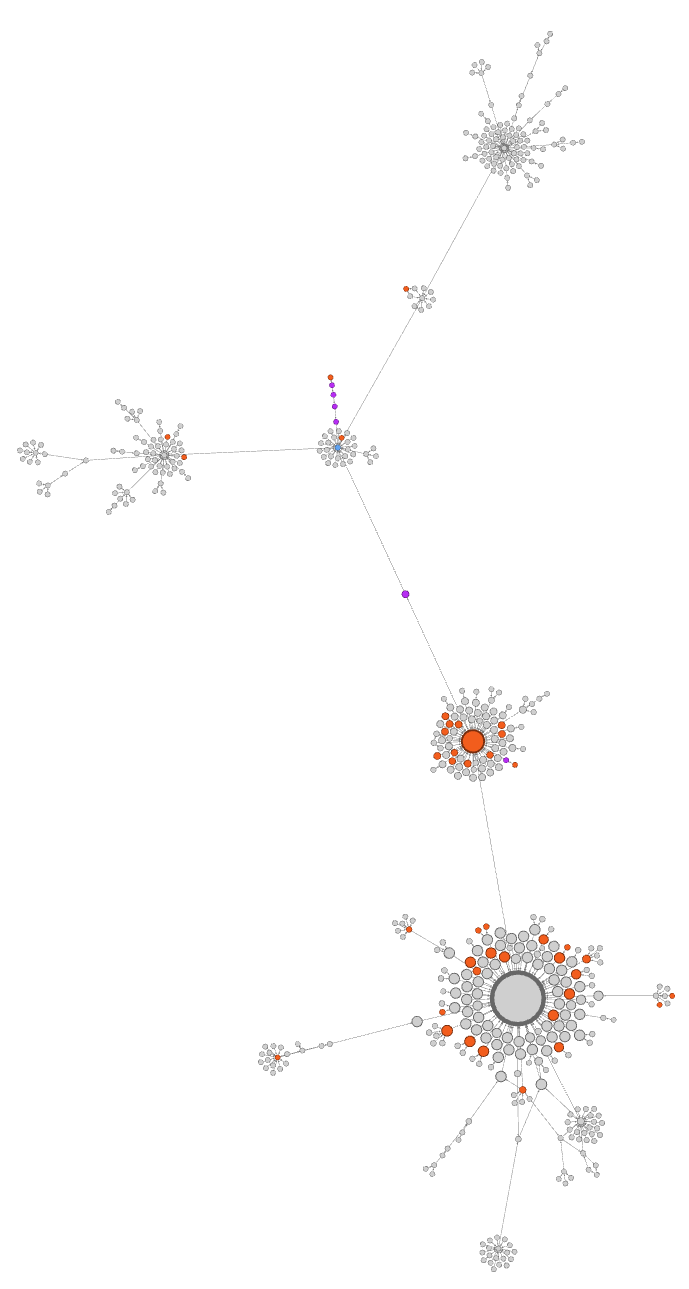
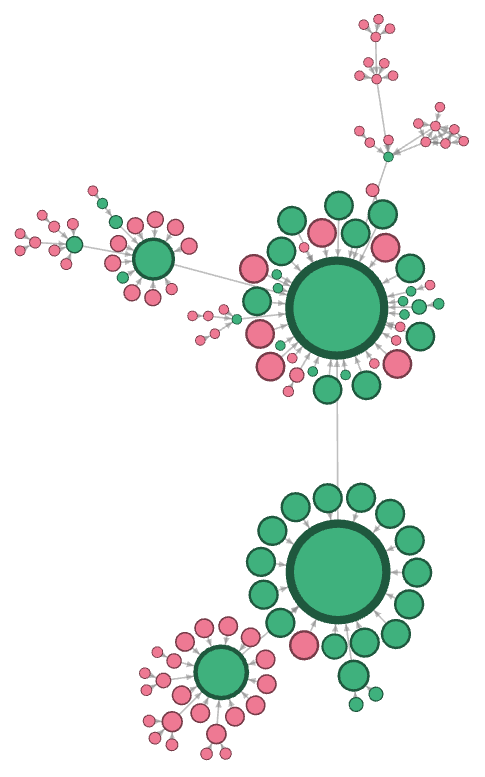
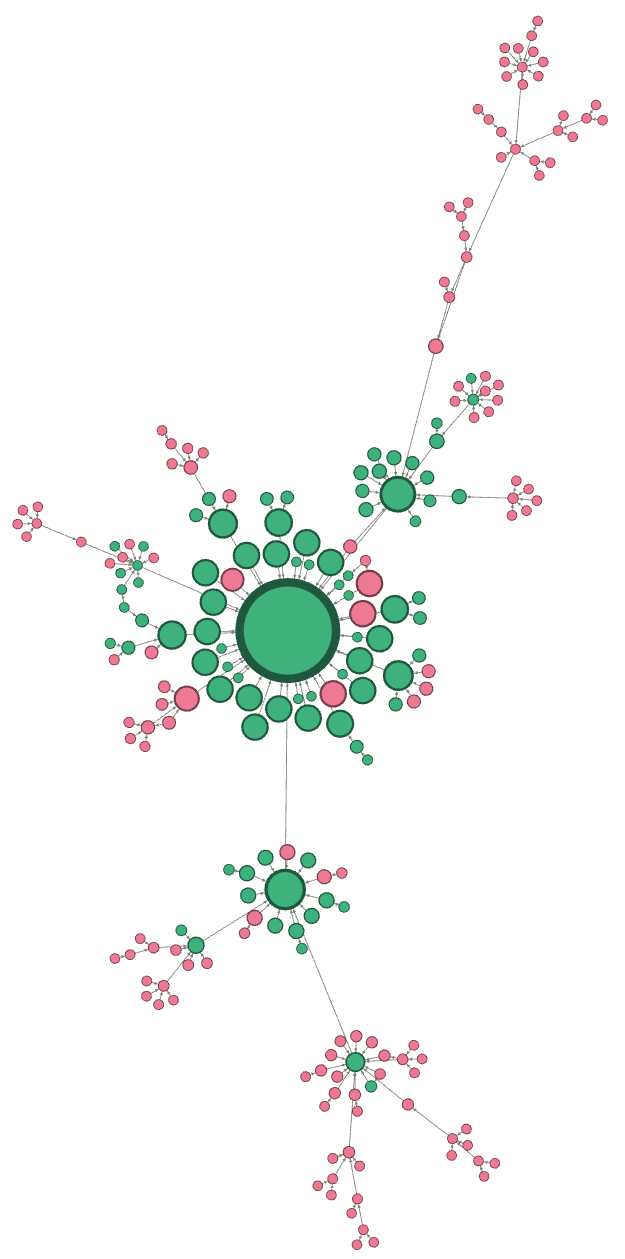
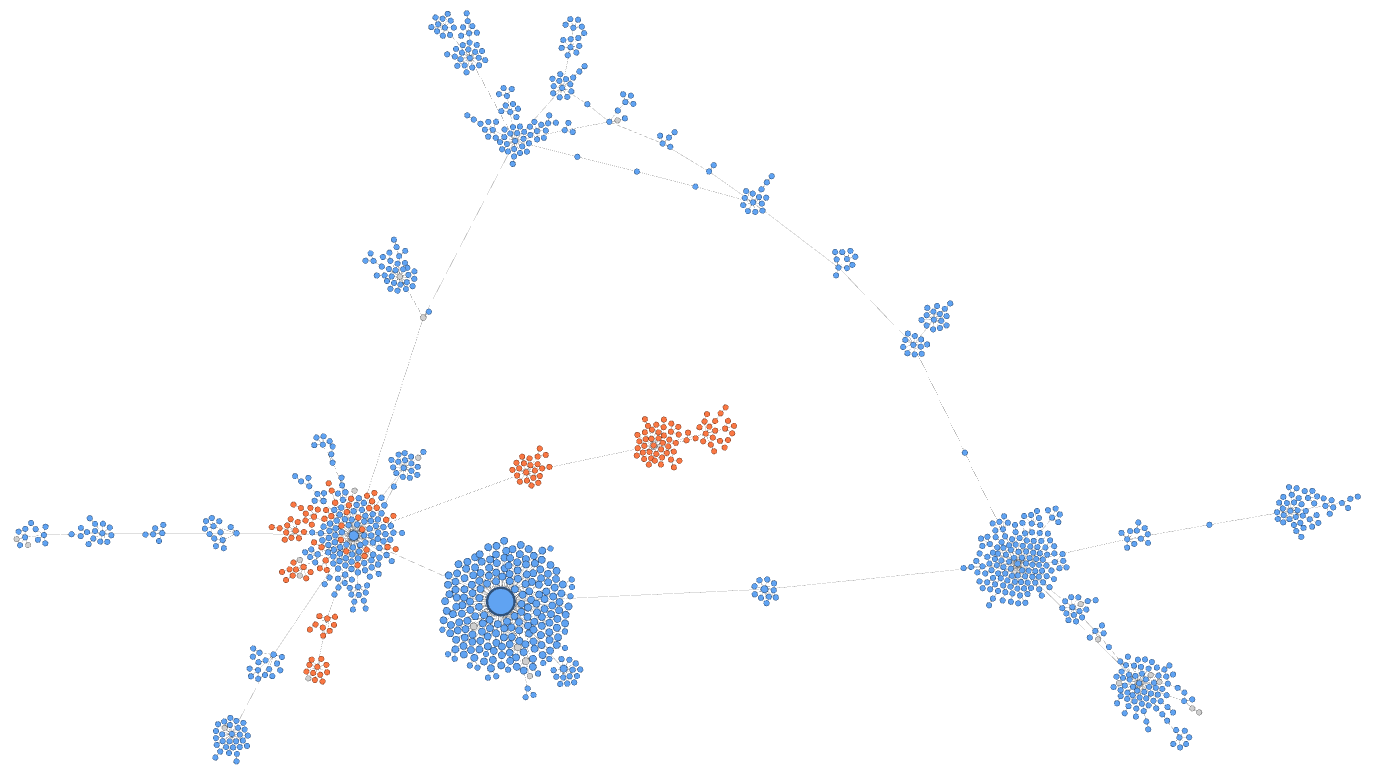
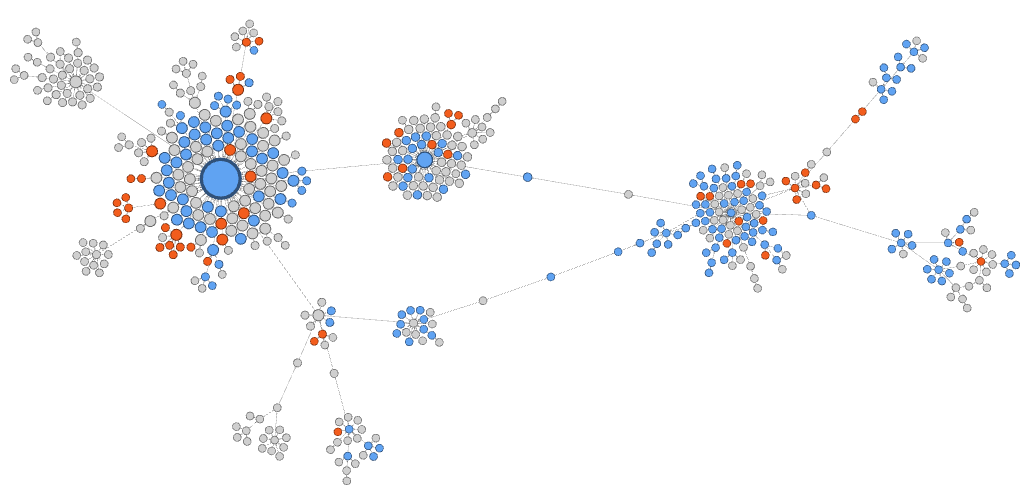
For example, Citigroup and Goldman Sachs score similarly according to balance sheet complexity.3 However, the side-by-side comparison of the two holding company networks reveals a stark contrast on the dimension of structural complexity (shown in figure 1).
|
| |
 |
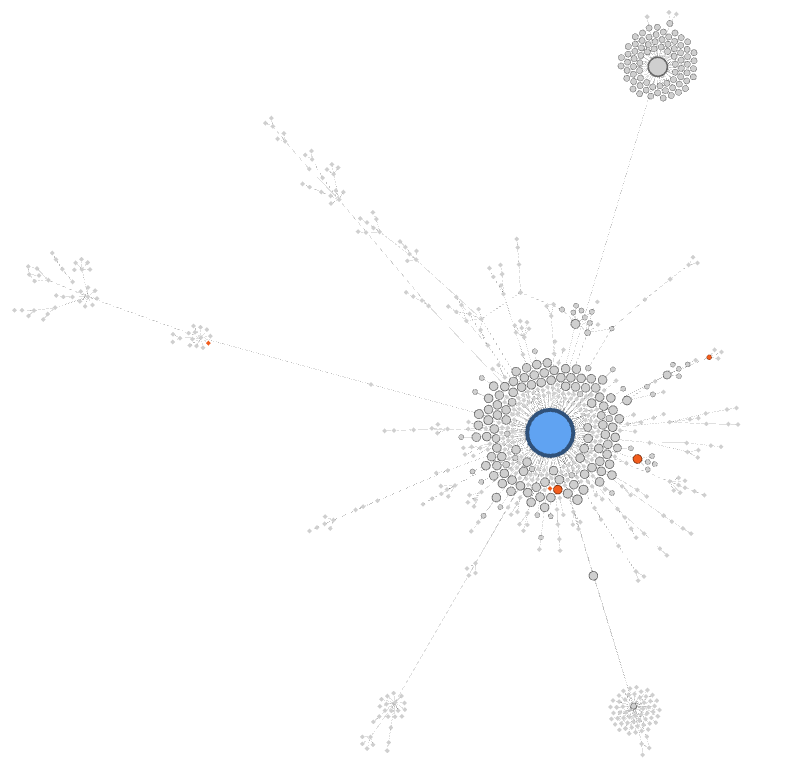 |
Citigroup exhibits a decentralized organizational structure, whereas the structure of Goldman Sachs resembles a "star graph"--a graph (or network) that is configured for maximum dependence on a single node. It is not surprising, then, that the centrality score (a dependence measure) of Citigroup is close to 0--the minimum--whereas the score for Goldman Sachs is close to 1--the maximum.4
Which bank is more complex? It depends on the context of the analysis. A centralized structure allows a holding company to quickly move liquidity to other entities--the structure makes it less likely to encounter regulatory caps or other difficulties that could delay the rapid deployment of liquidity. That said, how can such a central structure be broken up in a resolution process? A decentralized bank has an advantage here, as each node in the network is less central and thus less likely to cause instability if removed.
The need for a multidimensional approach to resolution planning strikes at the heart of criticism toward this process. Barney Frank, the former congressman and co-namesake of the Dodd-Frank Wall Street Reform and Consumer Protection Act, recently voiced one such critique in the New York Times, saying, "Some of the plans to break up the banks are simplistic because they take a one-size-fits-all approach . . . measures like the living wills allow regulators to press for banks to shrink, based on specific conditions at those firms."5 Considering the centrality of a bank's structure is one practical step toward addressing this criticism.
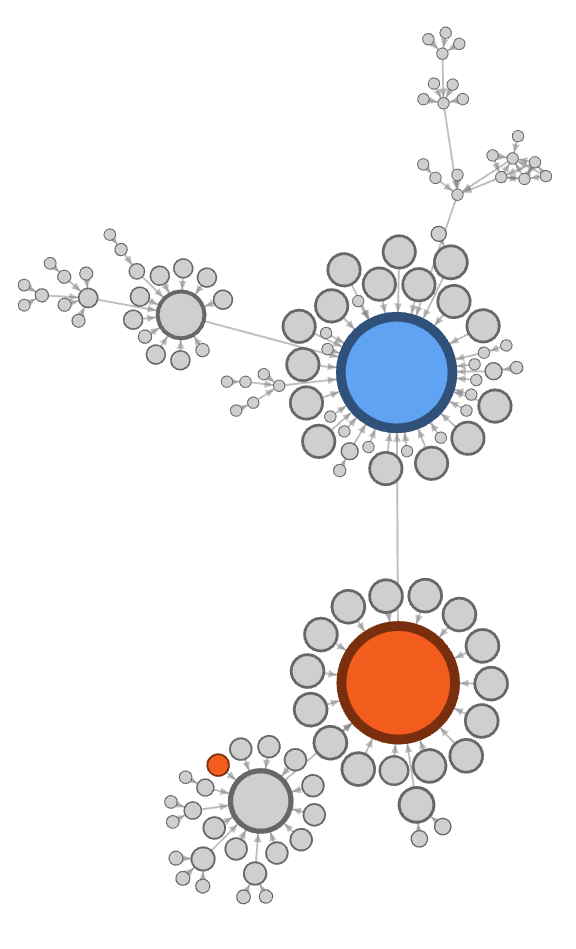
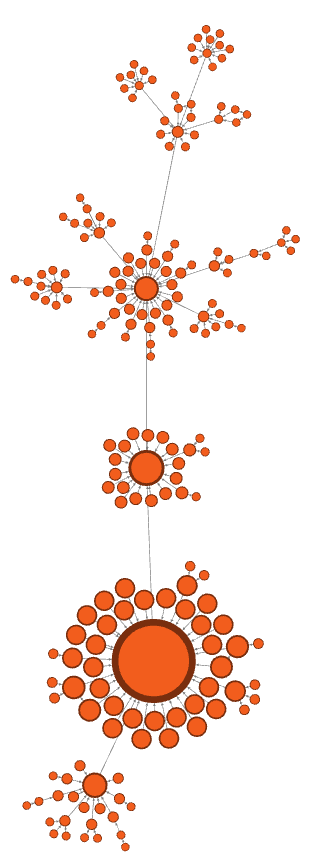
But centralization is only one aspect that we can visualize with bank networks. Each edge in the network represents a revealed preference by the bank of one firm over another. For instance, figure 2 shows that State Street and Bank of New York Mellon have both positioned a state-chartered member bank between the bank holding company and an Edge corporation--a legal entity that is allowed to engage in international banking operations. The choice of charter for the bank and its position within the holding company hint at the type of regulation the holding company finds most cost effective for its international banking operations. If we believe that complexity is costly to manage, then the network itself represents a bank holding company's revealed preference for complexity given its resource constraints.
|
|
|
 |
 |
 |
 |
How, then, might these preferences play out over time? A period of mergers or acquisition of other banks is the most revelatory. The target company or group of companies is absorbed to form a single organization through a process that may span several years. By observing this process, we can learn how the growth or decline of the bank holding company's resources affects its preference for complexity.
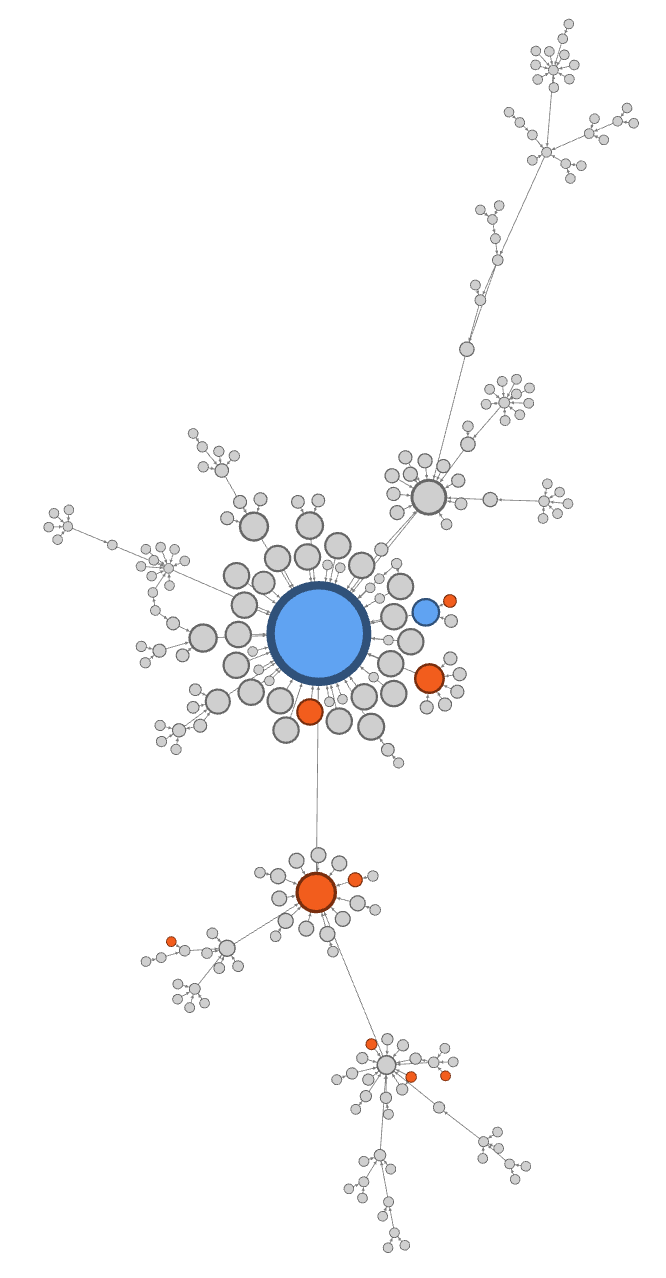
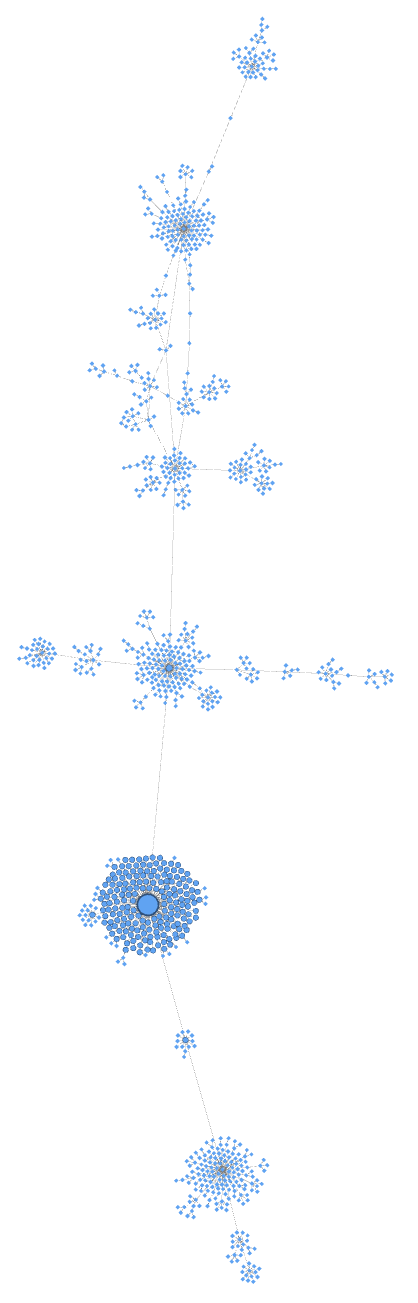
Consider the formation of JPMorgan Chase (JPMC) through the merger of JP Morgan with Chase Manhattan Bank, as shown in figure 3. Comparing pre-merger structures (panel A) with the post-merger one (panel B) reveals two important insights. First, post-merger JPMC likely operated as two separate companies with distinct roles for some time--structural complexity is the sum of individual company structures from the quarter before the merger. Second, while both networks were "line graphs" before the merger, the new company forms a "ring graph" so that its extremities can more easily access funds--a more decentralized structure. This decentralization persists 15 years later, even though the distinction between the two banks dissipates as their roles become integrated (panel C).
|
|
|
 |
 |
 | |
 |
|
But does the reduction in structural complexity associated with the integration of two companies carry unintended consequences for the merged firm? Between 2000 and 2015, JPMC increased its assets by 228 percent while reducing its number of subsidiaries by 53 percent--from 1,138 to 534. As structural complexity declined, firm size (as measured by firm assets) ramped up. However, a more careful analysis is needed to show conclusively that this effect exists more generally.
These examples highlight the need for a multidimensional analysis of bank complexity and resolvability. Regulators who already collect structure data may find them helpful for designing and updating bank resolution plans and for studying how mergers may affect the overall complexity of large banks.
References
BCBS. (2013, July 3). Global systemically important banks: updated assessment methodology and the higher loss absorbency requirement. Retrieved from bis.org: http://www.bis.org/publ/bcbs255.pdf 
FFIEC. (2000-2016). NIC Bulk Data Download. Retrieved from ffiec.gov: https://www.ffiec.gov/nicpubweb/nicweb/DataDownload.aspx
Wasserman, S., and Faust, K. (1997). Social Network Analysis: Methods and Applications. New York, NY: Cambridge University Press.
1. The BCBS identifies structural complexity as a component of overall complexity. For more information, see Basel Committee on Banking Supervision (2013, p. 7). Return to text
2. By structure data, we mean data on the organizational structure of a bank, including the equity holdings of its corporate tree that imply a control relationship. For example, we use National Information Center (NIC) data (Federal Financial Institutions Examination Council, 200016). Return to text
3. Measures computed by the authors as of the fourth quarter of 2015 are as follows: Citigroup (.620) and Goldman Sachs (.556). Return to text
4. In this paragraph, we minced the difference between structure centrality (group level) and firm centrality (node level). To be more clear, if we let $$C_A(n_i)$$ denote the centrality of some node $$n_i$$ and let $$C_A(n^*)$$ denote the largest node centrality measured in the network, then the structural centrality is the sum of residuals from the observed structure, $$ \sum_i^g C_A(n^*) - C_A(n_i) $$, normalized by the sum of residuals of the theoretical structure that maximizes the sum, $$ \max\limits_{g'} \sum_i^{g'} C_A(n^*)- C_A(n_i) $$. In most cases, the holding company is the node that attains $$C_A(n^*)$$, and a star graph is the structure that attains $$ \max\limits_{g'} \sum_i^{g'} C_A(n^*) - C_A(n_i) $$. For the organizational structures that we study, if the graph approaches a star, then it is true that the node centrality of the holding company approaches 1. For more details, see (Wasserman and Faust, 1994). Return to text
5. Nathaniel Popper and Peter Eavis (2016), "Regulators Warn 5 Top Banks They Are Still Too Big to Fail," New York Times, April 13. Return to text
Please cite this note as:
Oldfather, Jeremy D., Stefan Gissler, and Doriana Ruffino (2016). "Bank Complexity: Is Size Everything?," FEDS Notes. Washington: Board of Governors of the Federal Reserve System, July 15, 2016, http://dx.doi.org/10.17016/2380-7172.1802.
Disclaimer: FEDS Notes are articles in which Board economists offer their own views and present analysis on a range of topics in economics and finance. These articles are shorter and less technically oriented than FEDS Working Papers.