
FEDS Notes
 Print
PrintMarch 29, 2016
Corporate Equities by Issuer in the Financial Accounts of the United States
Richard E. Ogden, Damian R. Thomas, and Missaka Warusawitharana
Beginning with the December 2015 publication, the Financial Accounts of the United States reports estimates of the value of corporate equities of publicly traded and closely held corporations separately; closely held corporations are further broken down into S corporations and C corporations.1 This FEDS Note shows how we report the value of corporate equities outstanding in the Financial Accounts and describes how we estimate each of its components.
Definition
In the framework of the Financial Accounts, corporate equities reflect ownership shares in corporate businesses. This instrument category includes both common and preferred shares issued by domestic corporations, as well as shares issued by foreign corporations in domestic markets. There are three important exceptions. Mutual fund shares and inter-corporate equities holdings are excluded from the total outstanding for domestic corporations to prevent double counting of cross-holdings by firms. This reflects the fact that the Financial Accounts aim to capture the balance sheet dynamics of the nonfinancial corporate sector as a whole. Foreign direct investment--equity investment in a domestic corporation by a foreign entity that results in an ownership share greater than 10%--is recorded separately. Furthermore, holdings of a corporation's stock by itself (reported by firms as treasury stock holdings) are also not considered corporate equity.2
Presentation in the Financial Accounts
Table L.223 (PDF) of the Financial Accounts (not shown) summarizes the key series. The overall market value of corporate equities outstanding for domestic corporations is reported on line 2. Lines 3 and 6 present values for nonfinancial and financial corporations, respectively. The new detail is presented in lines 4 to 5 and 7 to 8, where the above totals are disaggregated into their publicly and closely held components. The memo section of the table (lines 28-31) breaks down the market value of domestic equities by whether they are publicly or closely held, with the closely held equities further disaggregated into the value of S and C corporations. Line 9 presents the value of corporate equities of foreign corporations sold on domestic financial markets. The lower portion of the Table L.223 (lines 11-27) presents the value of corporate equities from the holder's perspective. For example, line 11 presents the value of corporate equities owned by the household sector.3
| Table 1: Market Value of Corporate Equity Shares by Issuer as of 2015:Q4 |
|---|
| Issuer type | Percent of Total |
|---|---|
| Domestic equity | 81.1% |
| Publicly traded | 68.9% |
| Closely held | 12.3% |
| S corporations | 8.0% |
| C corporations | 4.3% |
| Rest of the world equity | 18.9% |
Table 1 presents the market value of corporate equity as a proportion of the total as of 2015:Q4 for selected categories. As the table indicates, publicly traded firms comprise the bulk of equities outstanding, with the value of closely held firms estimated to be about 12% of the value of corporate equities.
Valuation of publicly held corporations
Publicly traded corporations are domestic companies that are listed in public exchanges. The total market value of equity in these companies consists of the value of their common and preferred equity, with the former contributing the bulk of the total.4
The market value of common shares is measured directly by aggregating micro-level share data from the major exchanges. Source data are obtained from the Center for Research in Security Prices (CRSP) Monthly Stock file accessed through Wharton Research Data Services (WRDS). For each company, the share price and the number of shares outstanding at the end of each quarter are multiplied and then summed across firms. We categorize firms into financial and nonfinancial sectors based on Standard Industrial Classification (SIC) codes.
The market value of preferred shares is estimated using a perpetual inventory approach. We establish a historical benchmark as of 2007:Q1 based on a report by Standard and Poor's and then grow the series subsequently based on both the net issuance of preferred equity shares and the capital gains on existing shares. Net issuance of equities is estimated using data from SDC Platinum, from Thomson Reuters. The capital gains are calculated based on quarterly returns to the S&P preferred stock index.5
Valuation of closely held firms
Closely held corporations are companies with shares that are not traded in public exchanges. Since the sales of outstanding shares of equity in these companies are not directly observed we estimate the market value of equity in these companies based on available proxy measures for S corporations and closely held C corporations, respectively. We then apply a discount of 25% to the above estimates to reflect the lack of liquidity for closely held shares.6
The market value of equity in S corporations is estimated based on the book value of their net worth obtained from the IRS Statistics of Income.7 We obtain net worth, estimated as the sum of capital stock, additional paid-in capital, and retained earnings, less treasury stock, for S corporations in 15 distinct industry groups. We convert this net worth into a market value measure by multiplying it by the ratio of market value to net worth (obtained from the Compustat dataset) for public corporations in the corresponding industries. As the IRS data on net worth is available only at annual frequency, we interpolate quarterly values based on changes in the market value of public corporations. Furthermore, as the benchmark data are available only with a lag, market values after the last benchmark are obtained by extrapolation using the Russell 2000 index.
The total market value of outstanding equities in closely held C corporations is estimated based on annual revenues of the largest closely held corporations. We obtain data on revenues for large closely held C corporations from Forbes Magazine, which provides annual revenue data for companies with revenues greater than $2 billion.8 We follow a similar procedure as above to estimate market value based on the revenue data. First, we create a matched sample of publicly traded companies based on a variety of company characteristics such as industry, number of employees, and revenues. We compute an aggregate ratio of market value to revenue for each quarter using the data for the public companies in the matched sample (obtained from Compustat). These quarterly conversion factors are then multiplied by the aggregate revenue of closely held C companies in the same year to obtain the estimated quarterly market values. Finally, the resulting market values are then raised by a multiplicative factor to account for the exclusion of smaller closely held companies in the Forbes Magazine list.9 Quarterly values after the most recent annual data from Forbes are obtained by extrapolation using the Russell 2000 Index.
Rest of the world
Equity issued by foreign firms in domestic markets, including both American Depository Receipts and directly listed companies, are included in this category. Investment in U.S. operations that results in ownership of more than 10 percent by foreign corporations is not included in this category but is shown as foreign direct investment in the United States on Table L.230.
Evolution of corporate equity by issuers over time
| Figure 1: Market Value of Corporate Equity Shares by Issuer Type. |
|---|
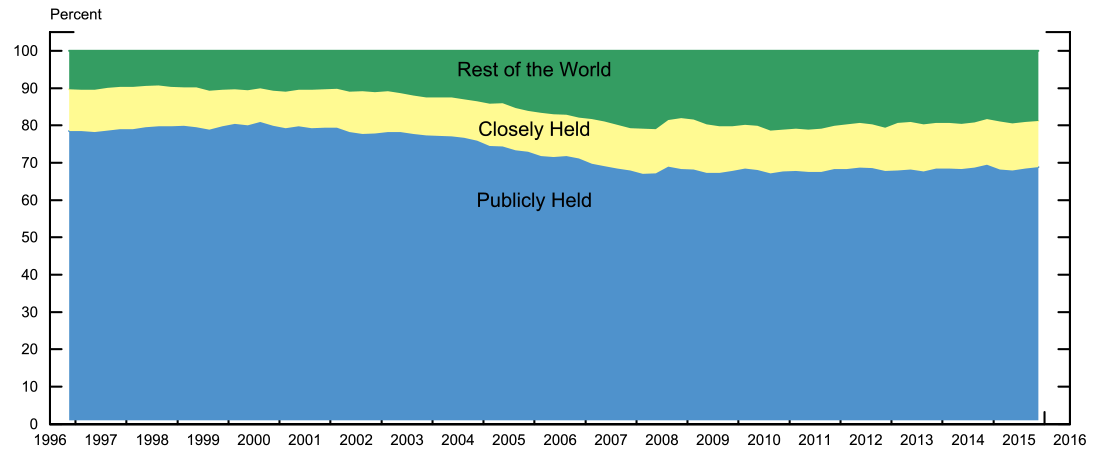 |
Source: Financial Accounts of the United States
Figure 1 presents the evolution of the share of corporate equities issued by publicly held corporations, closely held corporations, and the rest of the world from 1996:Q4 onwards. The share of corporate equities issued by the rest of the world has almost doubled over this period, reflecting increased globalization of financial markets. The share of corporate equities issued by closely held firms has also risen, but more modestly.
1. S Corporations are domestic corporations that elect to be taxed under subchapter S of the Internal Revenue Code, which enables them to pass untaxed corporate profits directly to their shareholders who are then taxed individually. Along with other requirements, S corporations must have 100 or fewer eligible shareholders and must have only one class of stock. C corporations are taxed separately from their owners--both the dividends distributed to shareholders and the profits earned by the corporation are taxed. For additional detail, see https://www.irs.gov/Businesses/Small-Businesses-&-Self-Employed/S-Corporations and https://www.irs.gov/Businesses/Small-Businesses-&-Self-Employed/Corporations. Return to text
2. See the descriptions of Tables L.223, L.224, and L.230 in the online Financial Accounts Guide for further details. Return to text
3. As with many other instrument categories, the household sector holdings are obtained residually by subtracting the holdings of the other sectors from the total value of equities outstanding. Return to text
4. Since 2007, the value of preferred equity has been less than 2% of the value of publicly traded corporations. Return to text
5. The S&P Preferred Stock Index ("Index") is a product of S&P Dow Jones Indices LLC and/or its affiliates and has been licensed for use by the Board. Copyright © 2016 S&P Dow Jones Indices LLC, a subsidiary of the McGraw Hill Financial Inc., and/or its affiliates. All rights reserved. Redistribution, reproduction and/or photocopying in whole or in part are prohibited without written permission of S&P Dow Jones Indices LLC. For more information on any of S&P Dow Jones Indices LLC's indices please visit www.spdji.com. S&P® is a registered trademark of Standard & Poor's Financial Services LLC and Dow Jones® is a registered trademark of Dow Jones Trademark Holdings LLC. Neither S&P Dow Jones Indices LLC, Dow Jones Trademark Holdings LLC, their affiliates nor their third party licensors make any representation or warranty, express or implied, as to the ability of any index to accurately represent the asset class or market sector that it purports to represent and neither S&P Dow Jones Indices LLC, Dow Jones Trademark Holdings LLC, their affiliates nor their third party licensors shall have any liability for any errors, omissions, or interruptions of any index or the data included therein. Return to text
6. See Z. Christopher Mercer, 1997, Quantifying Marketability Discounts, Peabody Publishers. Return to text
7. https://www.irs.gov/uac/SOI-Tax-Stats-Returns-of-Active-Corporations,-Form-1120S-Table-7. Return to text
8. Prior to 2009, the Forbes Magazine compiled revenue data for firms with revenues above $1 billion. Return to text
9. Based on Forbes Magazine data on firms with revenues between $1 and $2 billion from 2006 to 2008, we currently set this multiplicative factor to be 1.2. Return to text
Please cite this note as:
Ogden, Richard E., Damian R. Thomas, and Missaka Warusawitharana (2016). "Corporate Equities by Issuer in the Financial Accounts of the United States," FEDS Notes. Washington: Board of Governors of the Federal Reserve System, March 29, 2016, http://dx.doi.org/10.17016/2380-7172.1731.
Disclaimer: FEDS Notes are articles in which Board economists offer their own views and present analysis on a range of topics in economics and finance. These articles are shorter and less technically oriented than FEDS Working Papers.
