
FEDS Notes
 Print
PrintSeptember 29, 2016
Credit Availability and the Decline in Mortgage Lending to Minorities after the Housing Boom
Neil Bhutta and Daniel Ringo
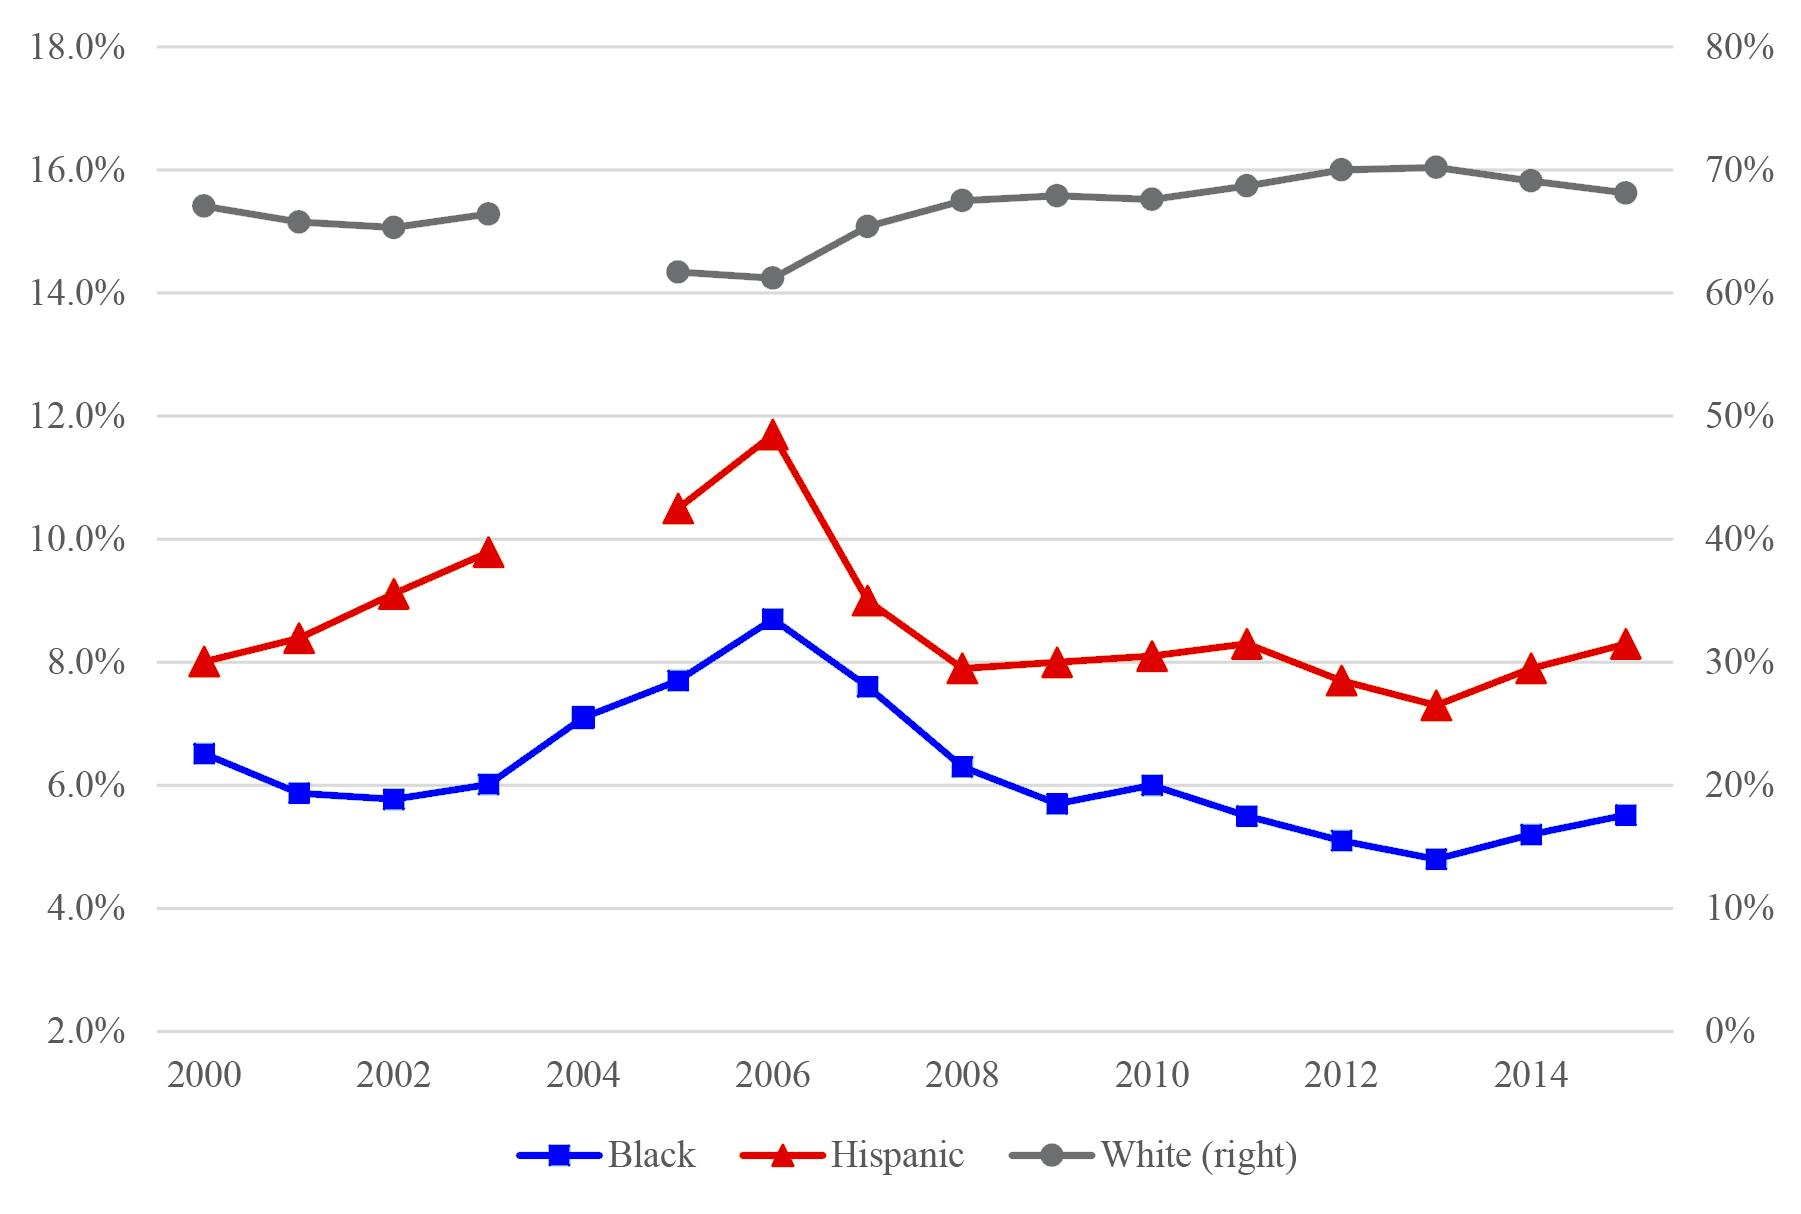
Since 2006, the shares of home purchase loans originated to black and Hispanic borrowers have declined considerably (Figure 1). These declines have raised concerns about access to credit for minorities following the financial crisis, and whether banks are meeting their obligations under the Community Reinvestment Act to help safely make credit available throughout their communities. Demand-side factors could also be playing a role, such as differential unemployment growth by race and ethnicity or differential changes in preferences for homeownership since the housing bust.
 |
|
Source: Home Mortgage Disclosure Act data
Notes: Not shown are the market shares for other minority groups such as Asians and Native Americans, or the share of loans where race and ethnicity were not reported. Due to reporting changes in 2004, the data may not be perfectly consistent over time. Starting in 2004, both the race and ethnicity (Hispanic or not) of mortgage borrowers could be reported, whereas prior to 2004 borrowers could only be classified as Hispanic or as being in one of five racial categories. In addition, starting in 2004 lenders reported the lien status of loans. In this figure, after 2003 junior liens are excluded, and "Hispanic" refers to Hispanic-white borrowers, while "white" refers to non-Hispanic white borrowers. In 2004 -- the first year of the new reporting regime -- ethnicity was often coded as missing, and thus the 2004 white and Hispanic shares are omitted.
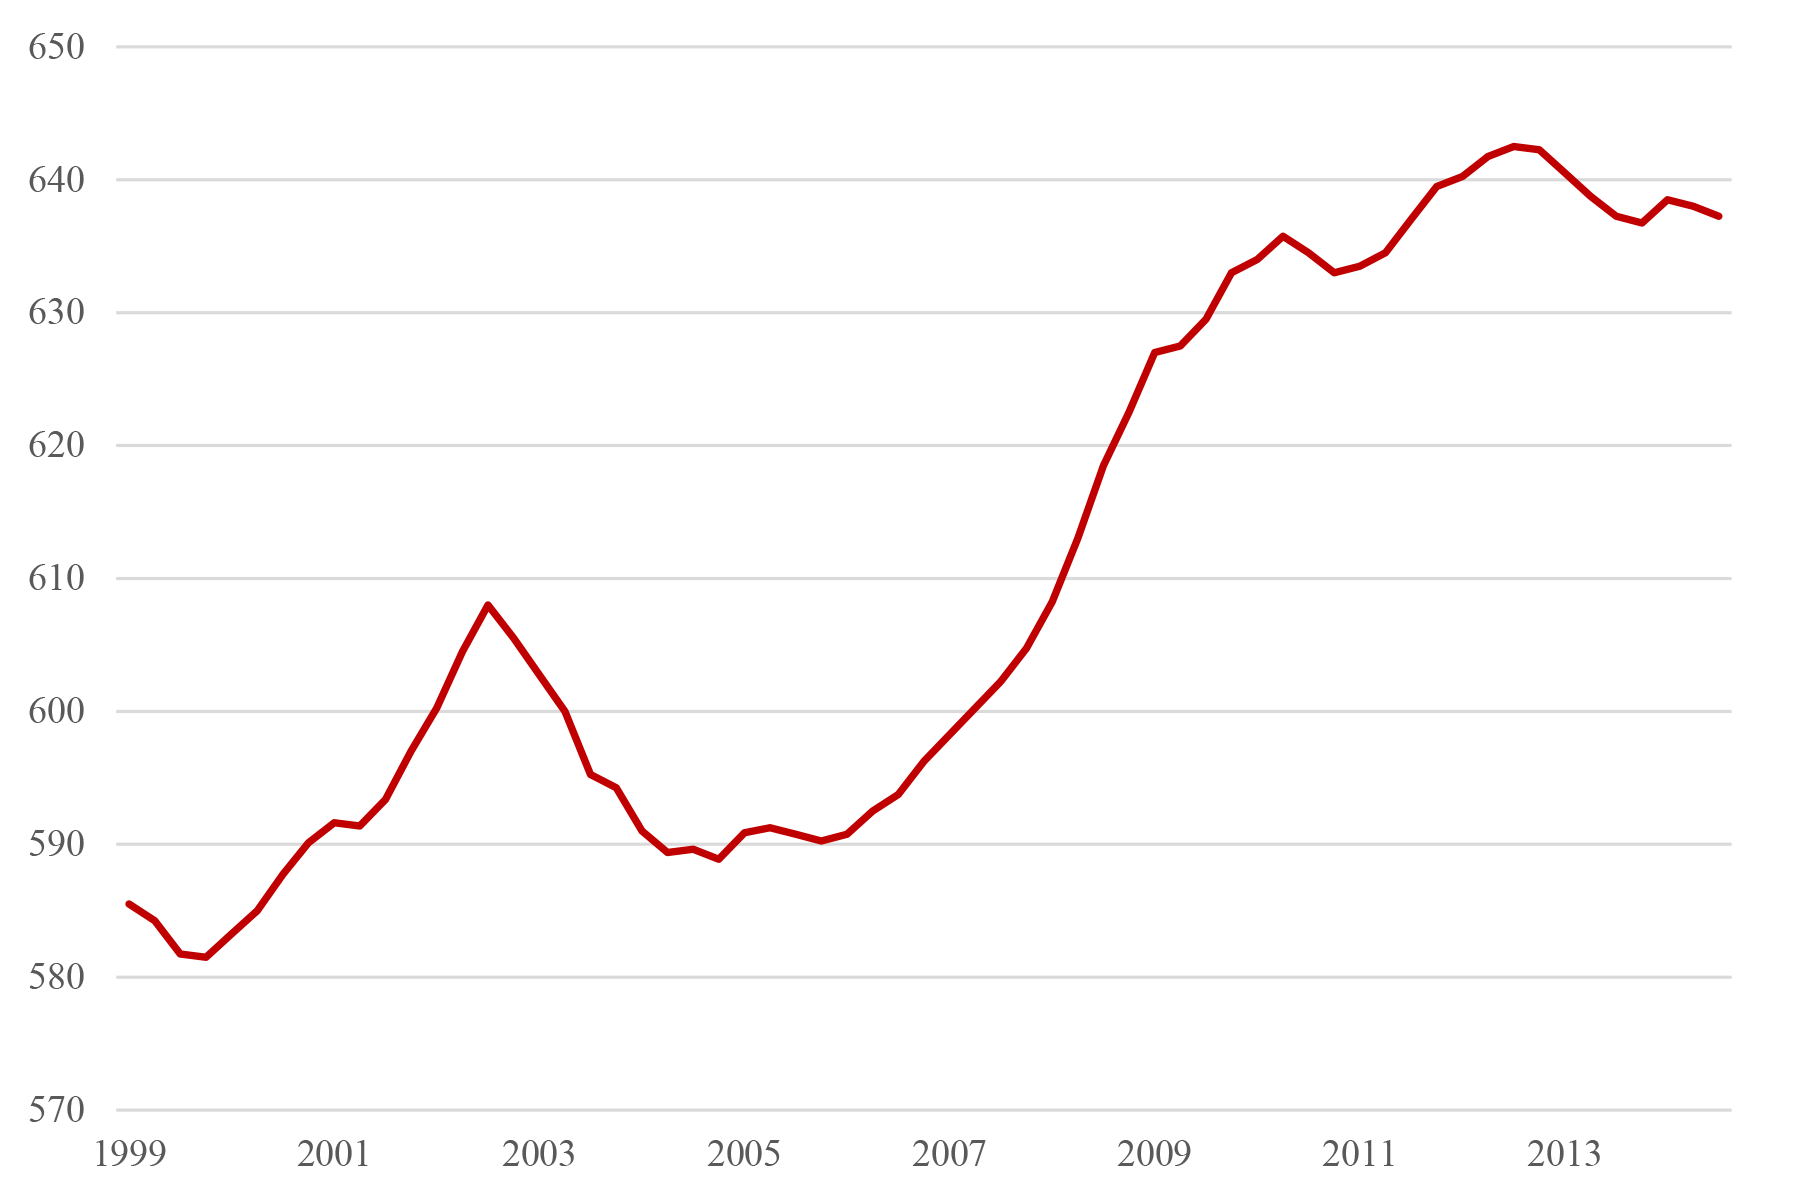
This note sheds light on the factors contributing to the disproportionate decline in lending to minorities since 2006. It provides evidence that the bulk of this decline reflects a general reduction in lending to borrowers with low credit scores, regardless of race and ethnicity. Figure 2 shows that after 2006, the 10th percentile score of new home-purchase-loan borrowers soared by about 50 points, reflecting an outsized decline in lending to low-score borrowers -- consistent with a tightening of lending standards as reported in the Federal Reserve's Senior Loan Officer Opinion Survey. As we document below, black and Hispanic mortgage borrowers tend to have much lower credit scores than white borrowers, and thus in recent years a tightening of credit for all groups appears to have had a relatively large effect on lending to minority groups. We find that while the market shares of minority borrowers with low credit scores declined sharply between 2006 and 2014, the market shares of minorities with mid to high credit scores remained nearly the same.
 |
|
Source: FRBNY Consumer Credit Panel/Equifax
Notes: This figure shows the four-quarter moving average of Equifax 3.0 Risk Scores for borrowers in the CCP in the quarter prior to the origination of a new home purchase loan. Because lenders do not report in credit bureau data like the CCP whether new loans are used for the purpose of purchasing one's principal residence, we infer the loan purpose based on whether a change in the borrower's mailing address is recorded after origination.
Data
This note draws on a unique dataset composed of individual credit record data from the Federal Reserve Bank of New York Consumer Credit Panel/Equifax (CCP) matched to loan level data reported under the Home Mortgage Disclosure Act (HMDA).1 Under HMDA, the vast majority of mortgage lenders across the U.S. are required to annually report data on all closed-end home purchase and refinance mortgage applications received, making it one of the most comprehensive sources of data on mortgage lending. The CCP is a 5 percent, nationally representative sample of all individuals with a credit record and a valid Social Security number, with quarterly snapshots since 1999.2 Thus, the matched dataset combines two highly representative datasets, and provides rich details about mortgage loans and borrowers over a long period of time.3 While the HMDA data provide demographic characteristics of borrowers, including their race and ethnicity, they lack information on the credit histories of borrowers. By linking mortgage borrowers in the HMDA data to their credit record data from the CCP, we are able to obtain the credit scores of borrowers in the quarter just before loan origination.4
Market Shares by Race and Ethnicity and by Credit Score
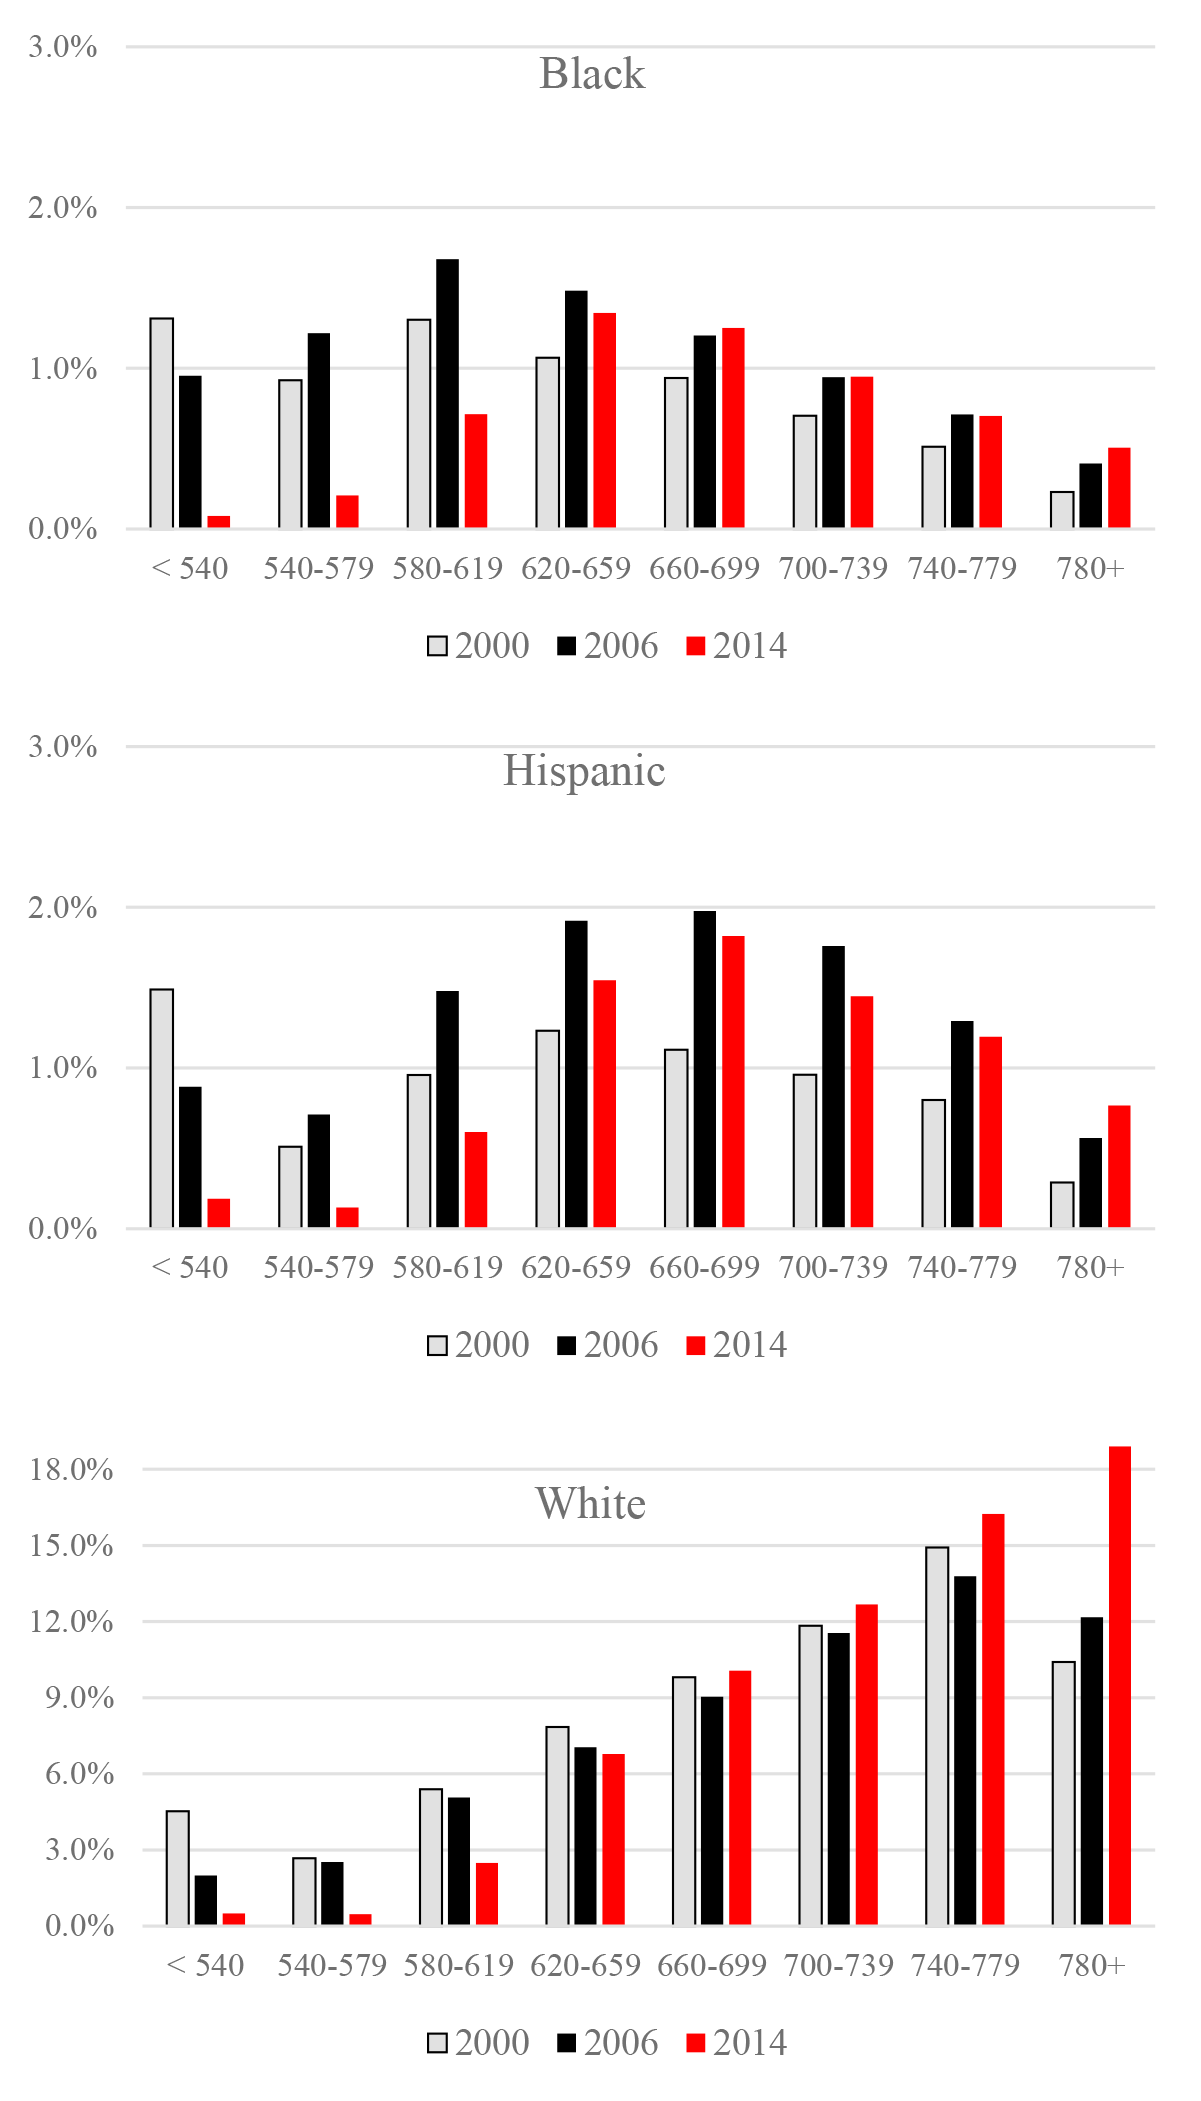
Figure 3 presents the market shares of black, Hispanic and white borrowers by credit score (40-point bins) at three different points in time: 2000, 2006 and 2014. For instance, in the top panel, the matched data indicate that black borrowers with a score between 620 and 659 accounted for about 1.5 percent of all first-lien owner-occupied home purchase mortgages originated in 2006.5
Comparing the bars for 2006 and 2014 in the top panel (colored black and red, respectively), the market share of black borrowers with scores of 620 or higher essentially held steady, preserving gains relative to 2000. In contrast, the market shares of those with scores in the three lowest bins declined dramatically from 2006 to 2014 (note that borrowers without scores in the quarter prior to origination are included in the sub-540 group). The stark difference in the market share patterns over time for borrowers with scores between 620 and 659 compared to those with slightly lower scores between 580 and 619 is particularly suggestive that credit supply, rather than credit demand, has played a key role in the decline in black market share.6
A similar pattern holds for Hispanic borrowers, shown in the middle panel. There were some slight declines in the market shares of Hispanic borrowers with scores in the upper five bins, but not nearly as severe as the drops among those with scores in the three lowest categories. The broader decline in Hispanic market share could reflect the more severe housing bust and recession in geographic locations where Hispanic families tend to reside, which we further examine below.
 |
|
Source: Home Mortgage Disclosure Act data merged to FRBNY Consumer Credit Panel/Equifax
Notes: Bars provide estimates of the share of all first-lien owner-occupied home purchase loan originated to a given population group, in a particular credit score category, in a given year. Credit scores refer to the Equifax 3.0 Risk Score in the quarter prior to origination.
Colors in key correspond with each bar segment, in order from left to right.
Finally, in the bottom panel, we show market shares for white borrowers. As with minorities, the market shares of white borrowers with scores in the lowest three categories declined sharply. However, comparing the black-colored bars across the three panels indicates that in 2006, black and Hispanic borrowers tended to have much lower scores than white borrowers. For instance, while almost 45 percent of black borrowers in 2006 were in the bottom three credit score categories, just 15 percent of white borrowers were in these three tiers. As such, if lenders became more reluctant to lend to low-score individuals, it would disproportionately affect access to credit for minorities.
Next, we examine more formally the connection between low credit scores and declines in market share using regression analysis. In table 1, panel A, the coefficient in the first column indicates that, in the matched HMDA-CCP data, the market share of black borrowers declined by about 2.9 percentage points between 2006 and 2014. For Hispanic borrowers (panel B) the estimated market share decline also stood at about 2.9 percentage points.
| (1) | (2) | (3) | (4) | (5) | (6) | |
|---|---|---|---|---|---|---|
| A. Black market Share | ||||||
| Change in black market share, 2006-2014 | -0.0285** | -0.0045* | -0.0249** | -0.0044** | -0.0215** | -0.0008 |
| (0.0037) | (0.0017) | (0.0031) | (0.0016) | (0.0024) | (0.0015) | |
| Controls for credit score | x | x | x | |||
| Controls for neighborhood income | x | x | ||||
| Controls for county location | x | x | ||||
| Adjusted R-square | 0.003 | 0.050 | 0.019 | 0.058 | 0.091 | 0.128 |
| B. Hispanic Market Share | ||||||
| Change in Hispanic market share, 2006-2014 | -0.0289** | -0.0144* | -0.0249** | -0.0145* | -0.0238** | -0.0109 |
| (0.0078) | (0.0066) | (0.0070) | (0.0063) | (0.0067) | (0.0055) | |
| Controls for credit score | x | x | x | |||
| Controls for neighborhood income | x | x | ||||
| Controls for county location | x | x | ||||
| Adjusted R-square | 0.002 | 0.027 | 0.023 | 0.041 | 0.144 | 0.162 |
Notes: Each column of each panel reports results from separate regressions using individual-level matched HMDA-CCP data for first-lien, owner-occupied home purchase loans in 2006 and 2014, with dummy outcome variables for black borrowers in panel A and Hispanic borrowers in panel B. Credit score refers to the Equifax Risk Score 3.0. Credit score and neighborhood income controls include 12 quantile dummy variables and a linear continuous control. County location controls includes a dummy variable for each county. Jointly held mortgages are given a weight of one-half. Standard errors, clustered at the state level, in parentheses. For each regression, N=259,432.
* P < 0.05
** P < 0.01
In column 2, we adjust the market share decline to account for borrowers' credit scores. As expected given the graphical evidence that lending to low score borrowers declined sharply regardless of race and ethnicity, controlling for credit score accounts for most of the decline in black market share, and over half of the decline in Hispanic market share. After adjusting for credit scores, the estimated decline in black market share was just 0.45 percentage points (as opposed to 2.9 percentage points unconditionally), and the estimated decline in Hispanic market share was 1.4 percentage points.
Could the observed connection between the prevalence of low credit scores among black and Hispanic borrowers and declines in their market shares instead be attributed to low incomes, which also may play an important role in lending and borrowing decisions? The regression in column 3 is analogous to column 2, but adjusts for neighborhood income, measured as the census tract-to-metropolitan area median family income ratio, rather than credit score.7 The results imply that neighborhood income can explain only a small portion of the decline in market share for both black borrowers and Hispanic borrowers. Moreover, as shown in column 4, when we control for credit score and neighborhood income simultaneously, the estimated declines in market share for black and Hispanic borrowers are identical to column 2 where we only controlled for credit score. This result helps underscore the importance of credit scores, as opposed to income, for understanding changes in the distribution of lending since the financial crisis.
Finally, the last two columns explore the extent to which differences in the geographic locations where various population groups tend to reside -- and the associated differences in housing and economic conditions -- can help explain the variation in market share trends. The regressions in column 5 adjust for borrowers' county of residence (where they purchased their home), and suggests that location differences can help account for some of the decline in black and Hispanic market shares. In other words, black and Hispanic families tend to live in areas where, regardless of race or ethnicity, lending has declined relatively more since 2006. In column 6, simultaneously controlling for both credit scores and county of residence accounts for all of the decline in black market share, and the remaining decline in Hispanic market share drops to 1.1 percentage point and loses statistical significance.
Conclusion
Since 2006, the shares of home purchase mortgages to black and Hispanic borrowers declined significantly. This note provides evidence that most of the decline in black and Hispanic market shares have come from borrowers with low credit scores (less than 620). Within the white population, low-score lending has also declined sharply, but, historically, a much smaller fraction of white borrowers have low credit scores compared with black and Hispanic borrowers. Tighter credit conditions since 2006 has therefore had a disproportionate effect on minorities' credit access.
References
Avery, Robert B., Neil Bhutta, Kenneth P. Brevoort, and Glenn B. Canner. 2011. "The Mortgage Market in 2010: Highlights from the Data Reported Under the Home Mortgage Disclosure Act," Federal Reserve Bulletin, vol. 97, pp. 1-82.
Lee, Donghoon and Wilbert Van der Klaauw. 2010. "An Introduction to the FRBNY Consumer Credit Panel." Federal Reserve Bank of New York Staff Report No. 479.
Laufer, Steven and Andrew Paciorek. 2016. "The Persistent Consequences of Tight Credit: Evidence from Minimum Credit Score Mortgage Lending Rules." Working paper.
1. Neither the HMDA data nor the CCP include personal identifying information, but borrowers in the two data sets can be matched based on the mortgage loan information common to both data sets--specifically, loan amount (rounded to the nearest thousand), month of loan origination, and census-tract location. We conduct an exact match on these three variables. While the CCP provides the census-tract locations of consumers' mailing addresses, the HMDA records provide the census-tract location of the property securing the mortgage. For mortgages to purchase owner-occupied properties, which is the focus in this note, the mailing address should generally coincide with the property address. Overall, for 2000, 2006 and 2014, we matched about 4 percent of HMDA owner-occupied home purchase loans originated in metropolitan areas (using year 2000 metro area definitions); the theoretical maximum fraction of loans that could have been matched, given the size of the CCP and its sampling method, is about 7-8 percent. Return to text
2. For more information on the CCP, see Lee and van der Klaauw (2010). Return to text
3. One caveat is that because the HMDA data's coverage may be weaker in rural areas, we only include loans originated in counties that are in metropolitan statistical areas (MSA), using year 2000 MSA definitions. Return to text
4. The credit score available in the CCP is the Equifax 3.0 Risk Score, which is similar numerically and conceptually to the FICO score. The scores of mortgage borrowers reported in the CCP likely differ to some extent from the scores used in the actual underwriting. Return to text
5. In the matched data, first liens are identified as loans where the borrower did not originate any other mortgages simultaneously, and loans that are significantly larger than a second loan originated at the same time. Borrowers that simultaneously originate two loans of similar size, or simultaneously originate more than two loans are dropped. This method provides a way to identify lien status in a consistent way over time, since the HMDA data only provides lien status beginning in 2004. Return to text
6. Laufer and Paciorek (2016) provide more conclusive evidence for a credit score of 620 becoming a threshold for qualifying for a mortgage. Return to text
7. Although lenders report borrowers' incomes in HMDA, we prefer not to use this information due to concerns about the accuracy of such information, particularly at the peak of the housing boom in 2006 (see Avery et al. 2012). Return to text
Please cite as: Bhutta, Neil, and Daniel Ringo (2016). "Credit Availability and the Decline in Mortgage Lending to Minorities after the Housing Boom," FEDS Notes. Washington: Board of Governors of the Federal Reserve System, September 29, 2016, http://dx.doi.org/10.17016/2380-7172.1842.
Disclaimer: FEDS Notes are articles in which Board economists offer their own views and present analysis on a range of topics in economics and finance. These articles are shorter and less technically oriented than FEDS Working Papers.
