
FEDS Notes
 Print
PrintDecember 2, 2016
The Effect of Hurricane Matthew on Consumer Spending
Aditya Aladangady, Shifrah Aron-Dine, Wendy Dunn, Laura Feiveson, Paul Lengermann, and Claudia Sahm 1
Severe weather events, such as blizzards and hurricanes, can temporarily disrupt economic activity. The imprints of these events on aggregate statistics can make it challenging for macroeconomists to analyze and forecast economic conditions. As one illustration, the minutes from March FOMC meetings in six of the past seven years cited unseasonable temperatures or winter storms as influencing economic activity.
Weather events present an opportunity to observe how consumers adjust their spending in the face of unanticipated shocks. Thus far, however, there has been little analysis of the spending effects from weather events, partly due to a lack of data at both a sufficiently high frequency and a geographically detailed level. For example, official statistics, such as retail sales from the Census Bureau, are only estimated nationally at a monthly frequency. In this note, we take a step forward in this regard using a new dataset of transaction volumes to examine how consumers reacted to Hurricane Matthew, which struck the East Coast in October 2016.
Our results reveal that the hurricane significantly reduced consumer spending in the affected states (Florida, Georgia, South Carolina, and North Carolina) in early October. Although the level of spending after the storm quickly returned to normal, very little of the preceding shortfall appears to have been made up in the subsequent weeks, suggesting that, on net over the span of a few weeks, the hurricane had a negative effect on spending. The drop in activity was most apparent in the discretionary components of spending, such as restaurants, as opposed to necessities, such as grocery stores.2 The net negative effect on spending implies that inter-temporal smoothing through this temporary shock is either incomplete or slow to occur.
Description of the Payment Transactions Data
The data we use for this analysis are the outcome of a trial collaboration between the Federal Reserve Board, Palantir Technologies, and First Data Corporation. The anonymized transactions aggregates originate from First Data, an electronic payments processor that provides merchants with the technology to process credit, debit, and electronic payment transactions. Palantir constructed daily indexes of purchases by state and industry for the Board.3 The daily indexes are available with only a three-day delay so it is possible to study spending almost in real time. The indexes are based on a subset of transactions that excludes variation arising from changes in First Data's client base over time. Even so, the resulting sample is not necessarily representative of all debit, credit, and electronic transactions in the United States; in addition, the data do not include payments made via cash or check.4 Thus, when we aggregated the detailed industry indexes up to broad spending categories, we applied weights based on each industry's share in the official Census Bureau estimates. In the analysis presented here, we focus on a broad spending measure that we refer to as the "retail sales group."5 The retail sales group accounts for about one third of total consumer spending and appears to be well measured by the First Data transactions.
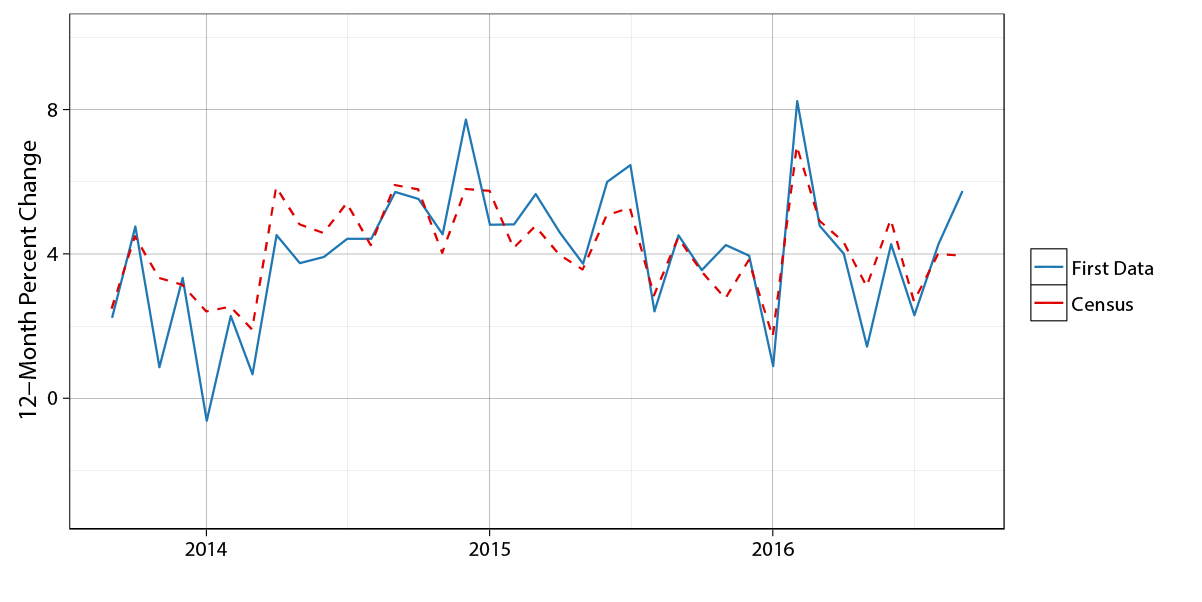
The daily, state-level indexes from First Data have no counterpart in the official statistics. Comparisons with Census monthly retail sales data at the national level, however, reveal similar patterns in changes in consumer spending over 2014 to 2016.6 Figure 1 shows the 12-month percent change in Census retail sales group spending along with comparable estimates from the First Data Retail volume aggregates. The correlation between the two series is 0.8. These and other comparisons provided us some assurance that the state-level estimates are of reasonably high quality.
 |
|
Source: First Data Retail volume aggregates, Census Bureau.
Note: Retail sales group is all retail sales and food services establishments minus motor vehicle dealers, building material stores, and gasoline stations. Not seasonally adjusted.
Hurricane Matthew and Consumer Spending
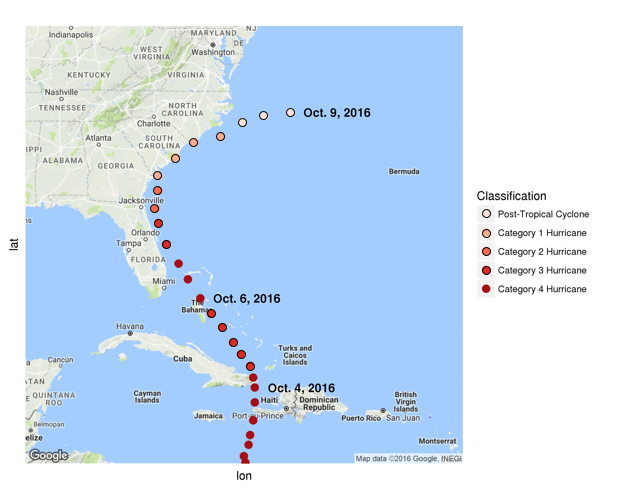
On October 4, 2016, Hurricane Matthew began to make headlines in the United States as the powerful storm devastated Haiti (figure 2). By that time, the governors of Florida, Georgia, North Carolina, and South Carolina had all declared a state of emergency and preparations were underway for the storm. On the evening of October 6, Hurricane Matthew made landfall in Florida, slightly weakened from its peak intensity, before sweeping up the coast through North Carolina over the following three days.
 |
|
Source: National Oceanic and Atmospheric Administration (NOAA), Hurricane Matthew Advisory Archive, http://www.nhc.noaa.gov/archive/2016/MATTHEW.shtml, mapped with Google Maps api.
Note: Weather data mapped using the ggmap package in R, as presented in Kahle and Wickham (2013).
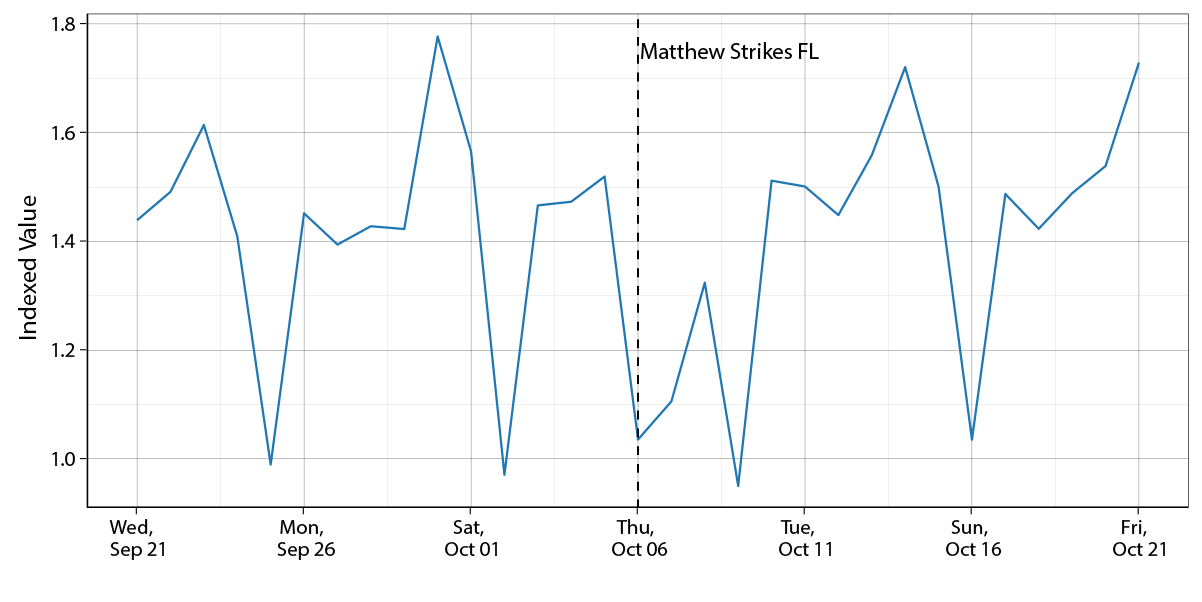
Using the daily, state-level indexes, we examined the pattern of activity in the days surrounding the occurrence of Hurricane Matthew. Figure 3 shows the index of daily retail sales group spending in Florida from two weeks before the hurricane through two weeks after the storm. The daily aggregates exhibit large, predictable fluctuations in spending across the days of the week. In particular, spending in the retail sales group tends to peak each week on Fridays and records lows on Sundays; however, Hurricane Matthew disrupted this pattern noticeably.
 |
|
Source: First Data Retail volume aggregates.
Note: Retail sales group is all retail sales and food services establishments minus motor vehicle dealers, building material stores, and gasoline stations. Not seasonally adjusted.
To quantify the size of the hurricane's effect, we estimated the following regression for each affected state using the daily spending indexes:
The state-specific hurricane effects are captured by the coefficients on the indicator variables, $$H_{t-s}$$, which equal one if the hurricane occurred on day t-s, and zero otherwise. The regression also controls for variation in spending due to the day of week, the month of year, and a linear time trend ($$T_t$$). The coefficient $$\beta_0$$ is thus the estimated effect on (log) spending in that state on the day the hurricane struck.
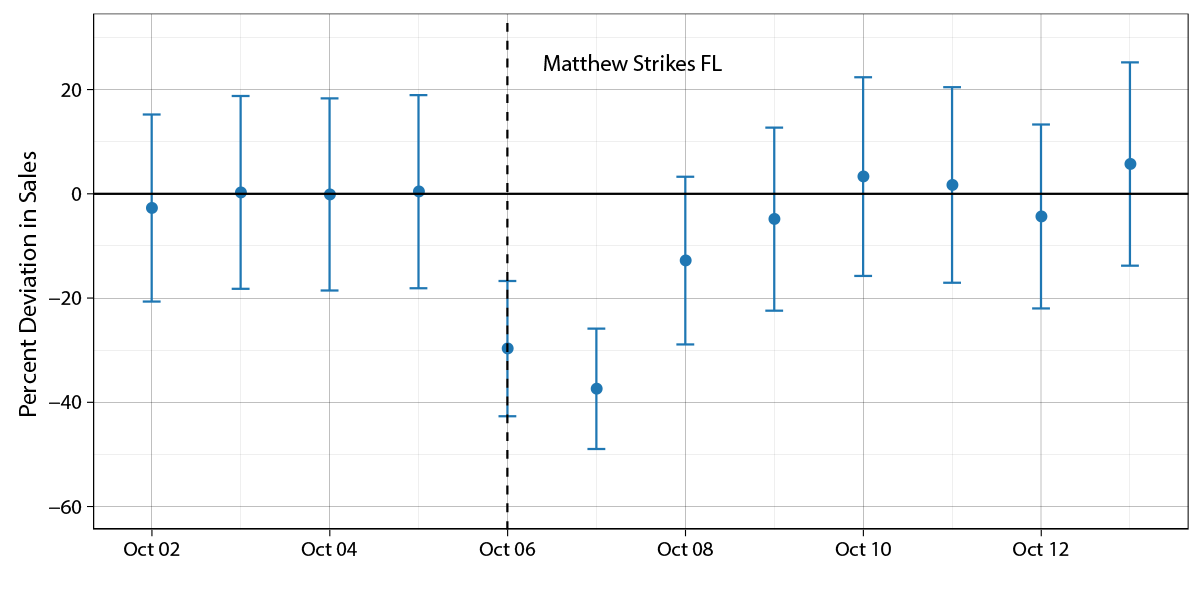
Figure 4 illustrates the results of the regression for Hurricane Matthew's effects on daily retail sales group spending in Florida. For this broad category of spending, there is no sign of spending in advance of the storm. During the hurricane itself, daily retail sales group spending in Florida was 30 to 40 percent lower than what normally would have occurred without a hurricane. However, the level of spending rebounded quickly after the storm.
 |
|
Source: First Data Retail volume aggregates.
Note. For ease of interpretation, we convert the log-deviations from the regression into percent deviations in daily spending. The dots are the estimated coefficients for the daily hurricane effects and the whiskers are the 95-percent confidence interval.
On balance, these data suggest that little of the "lost" spending associated with Hurricane Matthew was offset by higher spending in the days before or just after the storm. In fact, by summing across the daily effects, we estimate that Hurricane Matthew depressed overall retail sales group spending in Florida by 2.6 percent in October.
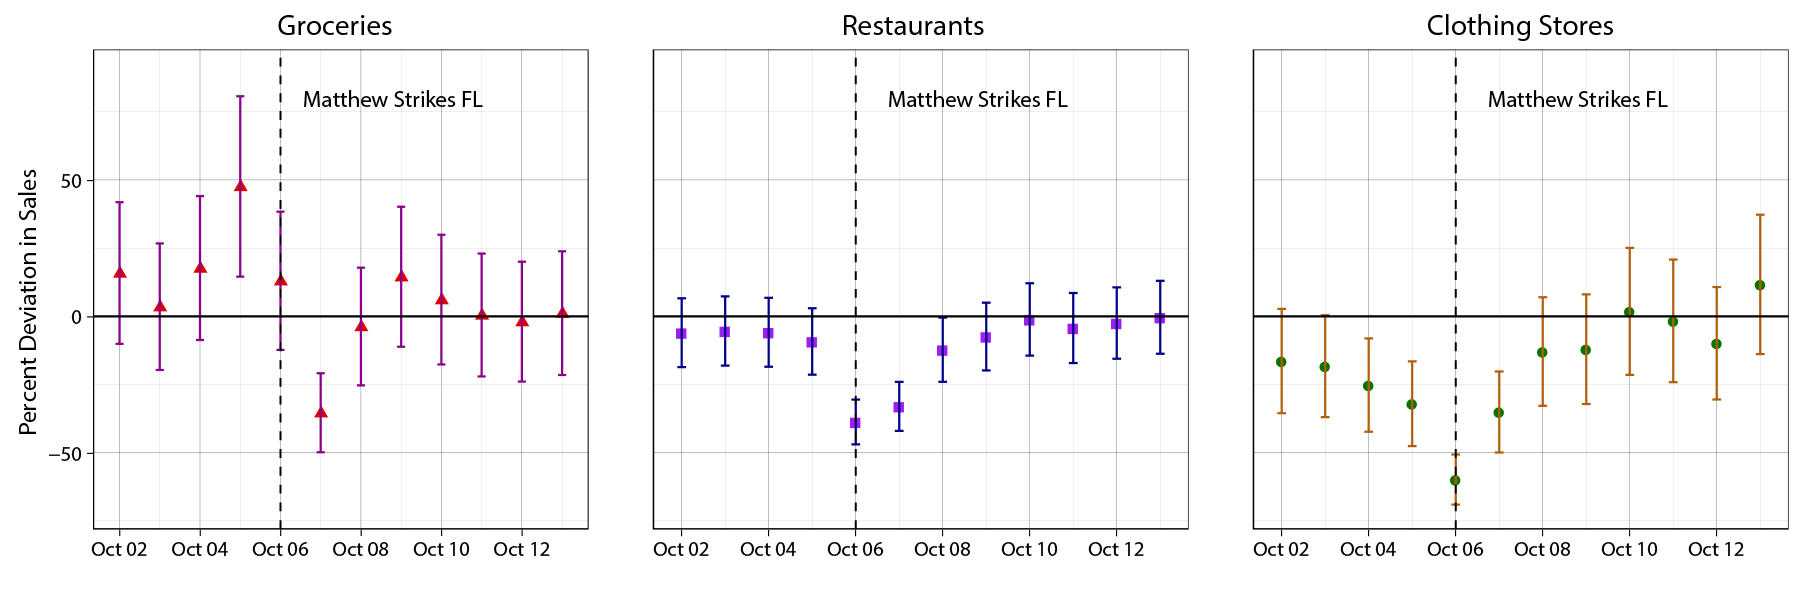
To further unpack this result, we estimated the same regression using more detailed categories of spending (figure 5).7 Interestingly, responses around the day of the storm vary noticeably among these categories. Spending at grocery stores actually ramped up before the hurricane and rebounded afterwards, such that the net effect for this category is positive (2.6 percent). This particular pattern accords with the traditional theory that forward-looking households adjust the timing of purchases to smooth consumption in the face of temporary shocks, with little or no net effect on spending. In this case, the net positive effect on groceries may be due to the fact that Hurricane Matthew turned out to be not as severe in Florida as many had feared.
 |
|
Source: First Data Retail volume aggregates.
Notes. In Florida, grocery stores account for 18 percent of total retail sales group spending, restaurants 20 percent, and clothing stores 10 percent. The dots are the estimated coefficients for the daily hurricane effects and the whiskers are the 95 percent confidence interval.
However, other retail categories look quite different, showing no evidence of a ramp up in spending prior to the storm or a quick make-up in spending afterwards. In these cases, the spending lost during the storm appears to be largely foregone, at least in the near term. For example, our estimates indicate net reductions in spending in October due to the hurricane at restaurants (‑4.1 percent) and clothing stores (‑6.8 percent).
One possible explanation for the lack of a quick make-up in spending is that some purchases are tied together with time use.8 For example, going out to eat requires time spent at a restaurant. If the storm makes it more difficult to spend time on such activities, then individuals are likely to cut back on restaurant spending, and some may substitute to alternatives such as buying groceries to eat at home. In addition, purchases that are directly tied to an experience, such as an afternoon out with friends, may be foregone or postponed for some time.
Another potential explanation for the apparent lack of make-up spending is that some portion of spending are "impulse purchases" that arise from a mood or temptation in the moment.9 If bad weather disrupts a shopping trip or damps the mood of consumers, then these impulse purchases may never happen. Such psychological factors seem like a plausible explanation for the lack of make-up spending in several types of purchases, like clothing.
Of course, we cannot rule out that the make-up in spending was gradual enough that the estimated effects in the days following the storm cannot be statistically distinguished from zero.10 Furthermore, we cannot observe whether consumers make up spending in online sales rather than brick-and-mortar establishments. Even so, the transactions aggregates provide suggestive evidence that temporary disruptions like hurricanes can have persistent effects on some types of spending.
Macroeconomic Effects of Hurricane Matthew
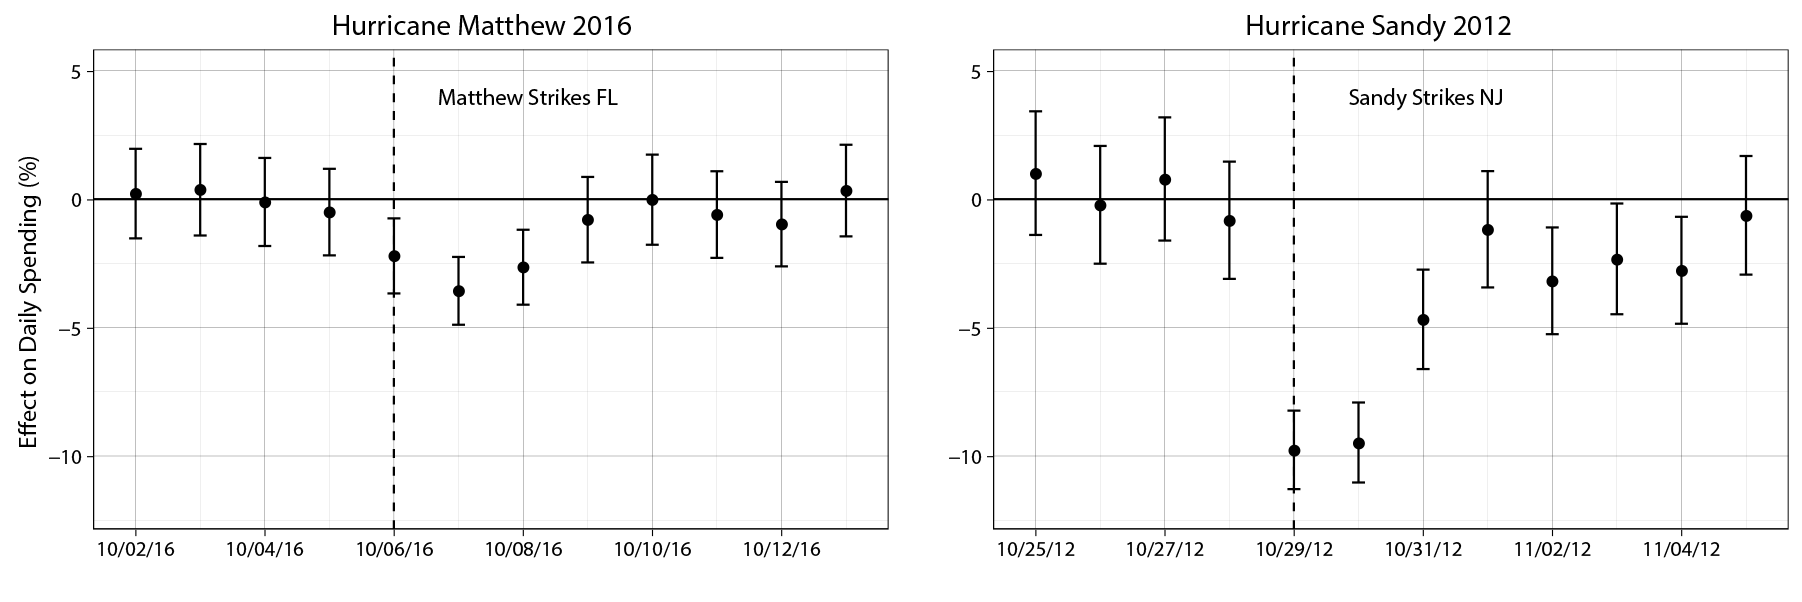
To quantify the macroeconomic importance of hurricane effects, we separately estimated the regression for retail sales group spending in each of the affected states (Florida, Georgia, South Carolina and North Carolina). We then aggregated the state-level effects using weights based on each state's share of national Census retail sales group spending. Figure 6 illustrates the results of this exercise for Hurricane Matthew and for Hurricane Sandy, another major hurricane that made landfall in October 2012. Notably, we estimate that the macroeconomic impact of Hurricane Sandy was roughly four times as large as Hurricane Matthew. This macroeconomic differential underscores the tremendous variation in the effects of hurricanes and other weather events. In all, our analysis indicates that national spending in the retail sales group in October 2016 was roughly 0.3 percent less than would have occurred in the absence of Hurricane Matthew. Therefore, in contrast to past weather events such as Hurricane Sandy, the imprint of Hurricane Matthew on quarterly measures of GDP will likely be quite small. (Of course, Hurricane Matthew may have disrupted economic activity through other channels such as employment and construction, but these channels are outside the scope of our analysis.)
 |
|
Source: First Data Retail volume aggregates, Census Bureau.
Note: The state-level spending weights used to aggregate up to national effects are from the 2012 Economic Census. The dots are the estimated coefficients for the daily hurricane effects and the whiskers are the 95 percent confidence interval.
Conclusion
Using anonymized daily transaction aggregates at the state level, we estimate that Hurricane Matthew had noticeable negative effects on retail sales group spending in the affected areas in October 2016. We find little evidence that the shortfall in this category of spending is made up in the days prior to and after the storm, suggesting an overall net loss in sales due to the hurricanes. However, because Hurricane Matthew was short-lived and the affected states only represent a small share of national spending, the overall impact of October's storm on quarterly measures of GDP will likely be very small. The daily transaction aggregates offer an extremely valuable means to gain new insights into how consumer spending is affected by unforeseen events like hurricanes.
References
Busse, Meghan R., Devin G. Pope, Jaren C. Pope, and Jorge Silva-Risso. (2015). "The Psychological Effect of Weather on Car Purchases." Quarterly Journal of Economics. 130(1): 371-414.
First Data, First Data Retail volume aggregates, https://www.firstdata.com/en_us/home.html.
Kahle, David and Hadley Wickham (2013). "ggmap: Spatial Visualization with ggplot2." The R Journal. 5(1). 144-161.
Matheny, Wendy, Shaun O'Brien, and Claire Wang. (2016). "The State of Cash: Preliminary Findings from the 2015 Diary of Consumer Payment Choice." Cash Product Office, Federal Reserve System.
Roth Tran, Brigitte (2016). "Blame it on the Rain: Weather Shocks and Retail Sales." Working Paper.
Spies, Kordelia, Friedrich Hesse, and Kerstin Loesch. (1997). "Store Atmosphere, Mood and Purchasing Behavior." International Journal of Research in Marketing. 14(1): 1-17.
Starr-McCluer, Martha (2000). "The Effects of Weather on Retail Sales." Finance and Economics Discussion Series, 2000-08. Board of Governors of the Federal Reserve System.
1. We thank Aaron Jaffe, Dan Moulton, and their colleagues at Palantir for extensive work and conversations in constructing the state-level aggregates analyzed here. This note is the first of several planned notes that will make use of these new transaction aggregates. Return to text
2. Our results are qualitatively similar to Roth Tran (2016), who found persistent spending effects from weather shocks using store-level data. Return to text
3. First Data client merchants are classified by Merchant Category Codes (MCC). To facilitate comparisons with Census data on retail sales, these MCC codes were mapped to the relevant NAICS 4-digit industry codes. Return to text
4. According to the Federal Reserve's 2015 Diary of Consumer Payment Choice survey (see Matheny et al, 2016), cash and checks account for 28 percent of the value of all consumer payments, down from 33 percent in 2012. Return to text
5. The "retail sales group" includes all retail sales and food services other than sales at motor vehicle dealers, building material stores, and gasoline stations; it is the portion of the Census retail sales data that the BEA uses to construct its estimate of personal consumer expenditures. First Data also has good coverage of gasoline stations and some service-industries outside of the retail sales group but does not cover all consumer spending. Return to text
6. Currently the First Data Retail volume aggregates are available beginning in September 2012. Return to text
7. While our analysis focused on spending categories in the retail sales group, we did explore some additional categories. For example, spending at gasoline stations exhibited a significant ramp up of spending before the hurricane, and then a prolonged divot in spending during the hurricane and the subsequent few days, such that that the net effect was roughly zero. Spending in building materials was also significantly higher than normal in the days before and immediately after the hurricane, and the overall net effect for this category was positive. In future analysis, we will likely broaden the scope of our analysis to include other retail categories that are well-measured by the First Data Retail volume aggregates. Return to text
8. In a study of weather effects in national retail sales spending, Starr-McCluer (2000) uses a Becker-style model in which consumption commodities are the product of both market expenditures and time inputs. Weather changes the productivity (or cost) of time use in certain activities outside the home like shopping, and thus changes in market expenditure may be used to smooth out consumption. In such a model, net positive or net negative effects on market spending from weather are possible. Return to text
9. As some examples of related research, Busse, Pope, Pope, and Silva-Risso (2014) find that weather has a psychological effect on car purchases and Spies, Hesse, and Loesch (1997) argue that mood can influence purchases. Return to text
10. We also tested specifications that allowed for hurricane effects more than 7 days after the storm. The longer window did not materially change the results, and estimated coefficients for 7 to 21 days after the storm were not statistically different from zero. Return to text
Please cite as:
Aladangady, Aditya, Shifrah Aron-Dine, Wendy Dunn, Laura Feiveson, Paul Lengermann, and Claudia Sahm (2016). "The Effect of Hurricane Matthew on Consumer Spending," FEDS Notes. Washington: Board of Governors of the Federal Reserve System, December 2, 2016, https://doi.org/10.17016/2380-7172.1888.
Disclaimer: FEDS Notes are articles in which Board economists offer their own views and present analysis on a range of topics in economics and finance. These articles are shorter and less technically oriented than FEDS Working Papers.
